
Key Insights
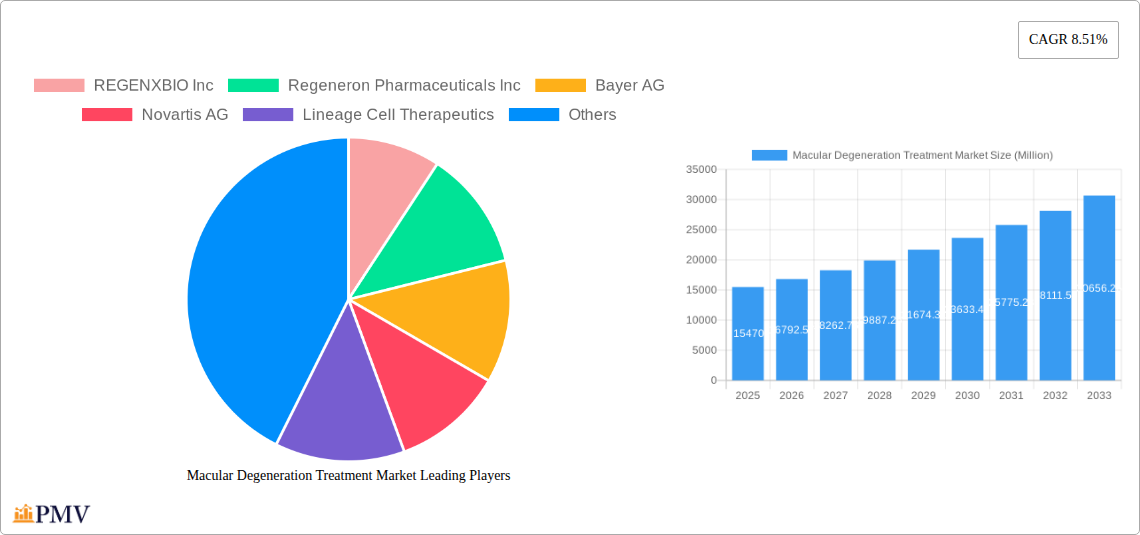
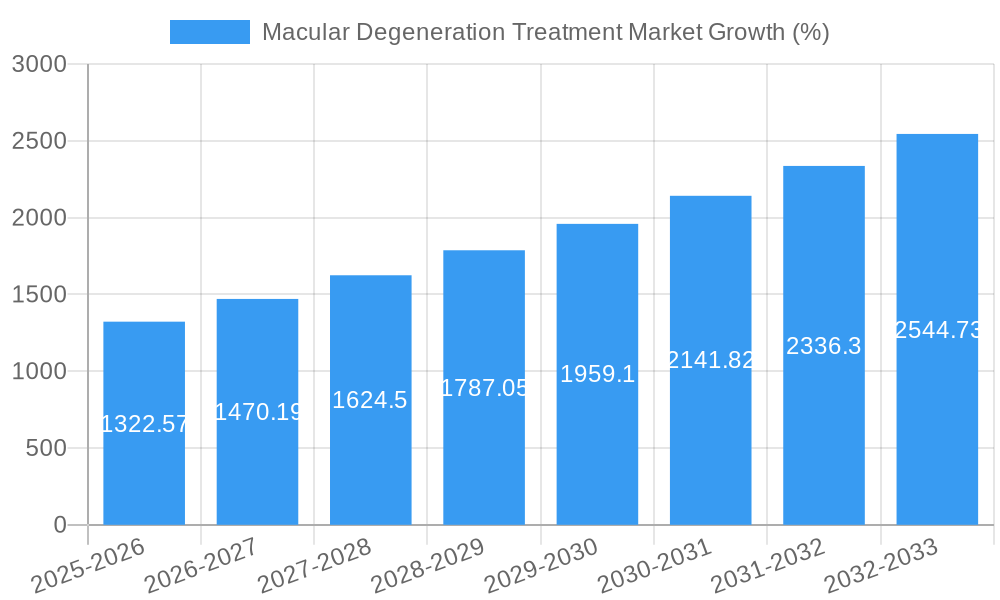
The global macular degeneration (AMD) treatment market, valued at $15.47 billion in 2025, is projected to experience robust growth, exhibiting a compound annual growth rate (CAGR) of 8.51% from 2025 to 2033. This expansion is driven by several key factors. The aging global population represents a significant contributing factor, as AMD predominantly affects individuals over 50. Technological advancements in diagnostic tools and treatment modalities, including the development of novel anti-VEGF therapies and gene therapies, are further fueling market growth. Increased awareness of AMD and improved access to healthcare, particularly in emerging economies, are also playing a role. The market is segmented by treatment type (drug vs. device), route of administration (intravitreal, intravenous), sales channel (hospitals, ambulatory surgical centers), disease stage (early, intermediate, late), and AMD type (dry, wet). The wet AMD segment currently dominates due to its more severe nature and availability of targeted therapies. However, significant research and development efforts are focused on effective treatments for dry AMD, presenting substantial future growth opportunities. Competitive dynamics are intense, with major pharmaceutical and biotechnology companies vying for market share through innovative product development and strategic partnerships.
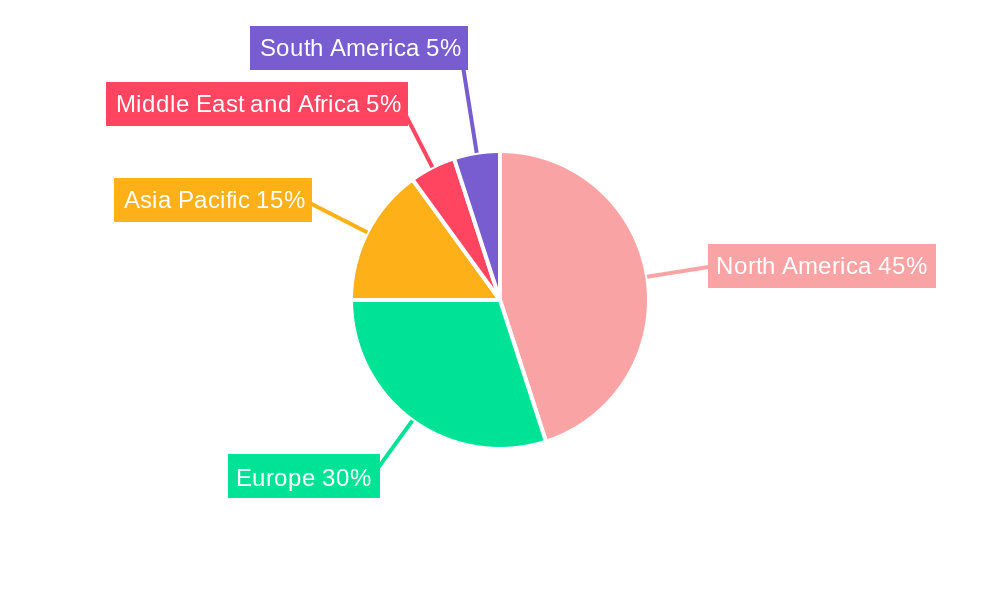
Geographic distribution shows a concentration of market share in North America and Europe due to higher healthcare expenditure and prevalence rates. However, Asia Pacific is expected to witness significant growth in the coming years, driven by rising healthcare infrastructure and increasing awareness in countries like China and India. While the market faces challenges like high treatment costs and potential side effects associated with certain therapies, the overall outlook remains positive, with significant potential for growth propelled by ongoing innovation and expanding treatment access globally. The continued development of more effective and convenient treatment options, along with improved early detection strategies, will be crucial in shaping the future of this market.
This comprehensive report provides a detailed analysis of the global Macular Degeneration Treatment Market, offering invaluable insights for stakeholders across the pharmaceutical and medical device industries. The report covers the period from 2019 to 2033, with a focus on the forecast period 2025-2033, using 2025 as the base year. The study encompasses a detailed segmentation analysis, competitive landscape review, and identification of key growth drivers and challenges. The market is projected to reach xx Million by 2033, exhibiting a robust CAGR of xx% during the forecast period.
Macular Degeneration Treatment Market Market Structure & Competitive Dynamics
The Macular Degeneration Treatment Market is characterized by a moderately concentrated structure, with a handful of major players holding significant market share. Market concentration is influenced by factors including the high cost of R&D, stringent regulatory approvals, and the complexity of treating macular degeneration. The innovation ecosystem is dynamic, driven by advancements in gene therapy, biologics, and novel drug delivery systems. The regulatory framework varies across geographies, influencing market access and pricing strategies. The market also experiences competition from substitute treatments and therapies, alongside ongoing mergers and acquisitions (M&A) activities shaping the competitive landscape.
- Market Leaders: Regeneron Pharmaceuticals Inc, F Hoffmann-La Roche Ltd, Novartis AG, Bayer AG, and Pfizer Inc hold substantial market shares.
- M&A Activity: The past five years have seen significant M&A activity, with deal values ranging from xx Million to xx Million, reflecting strategic moves to expand product portfolios and market presence. These activities have altered the competitive dynamics and market share distribution, creating both opportunities and challenges for players.
- Innovation Ecosystems: Collaborative partnerships between pharmaceutical companies and biotech firms are driving innovation in areas like gene therapy and novel drug delivery systems, leading to the development of new treatment options and increasing the overall market size.
- End-User Trends: The growing elderly population and rising prevalence of age-related macular degeneration (AMD) are key drivers boosting demand for effective treatments.
Macular Degeneration Treatment Market Industry Trends & Insights
The Macular Degeneration Treatment Market is experiencing significant growth, primarily fueled by the increasing prevalence of AMD, particularly wet AMD, a leading cause of vision loss globally. Technological advancements in diagnostics, drug delivery, and therapeutic modalities are revolutionizing treatment approaches, contributing to higher treatment success rates and market expansion. Consumer preferences are shifting towards minimally invasive treatments with improved efficacy and reduced side effects. The competitive landscape is highly dynamic, with ongoing R&D efforts, new product launches, and strategic partnerships shaping market dynamics. The market penetration of novel therapies is steadily increasing, reflecting the growing adoption of advanced treatment options. Several factors impact the market growth, including aging populations and technological advancement.
- CAGR: The market is expected to grow at a CAGR of xx% during the forecast period (2025-2033).
- Market Penetration: The penetration of novel therapies, such as anti-VEGF injections and gene therapies, is steadily increasing, indicating significant market growth opportunities.
- Growth Drivers: Aging population, rising prevalence of AMD, technological advancements, increased healthcare spending.
- Technological Disruptions: Gene therapy and advanced drug delivery systems are disrupting the traditional treatment landscape, creating new avenues for therapeutic interventions.
Dominant Markets & Segments in Macular Degeneration Treatment Market
The North American region holds a dominant position in the Macular Degeneration Treatment Market, driven by high healthcare expenditure, advanced infrastructure, and a significant number of patients with AMD. Within the market segmentation, the Wet Age-related Macular Degeneration segment holds the largest market share due to its higher prevalence and the availability of numerous effective treatments. The Intravitreal Route is also the dominant route of administration owing to its targeted delivery and effectiveness.
- Leading Region: North America
- Dominant Segment: Wet Age-related Macular Degeneration
- Key Drivers (North America): High healthcare expenditure, advanced medical infrastructure, well-established healthcare systems.
- Key Drivers (Wet AMD Segment): Higher prevalence, availability of effective treatments (e.g., anti-VEGF injections).
- Key Drivers (Intravitreal Route): Targeted drug delivery, high efficacy, reduced systemic side effects.
- Ambulatory Surgical Centers: This sales channel is showing significant growth due to its cost-effectiveness and convenience.
Other Segments: The other segments like Dry Age-related Macular Degeneration, Early-stage AMD, Intermediate AMD, Late-stage AMD, and other sales channels are also experiencing moderate growth with potential expansion in the upcoming years.
Macular Degeneration Treatment Market Product Innovations
Recent years have witnessed significant advancements in Macular Degeneration treatment, with a focus on developing more effective and safer therapies. This includes the emergence of gene therapies targeting underlying genetic causes of AMD, novel drug delivery systems for improved efficacy and reduced side effects, and advancements in imaging technologies for early diagnosis and personalized treatment. These innovative approaches cater to unmet medical needs and address limitations of existing therapies, leading to enhanced patient outcomes and increased market growth.
Report Segmentation & Scope
This report comprehensively segments the Macular Degeneration Treatment Market across several parameters:
- By Type: Dry Age-related Macular Degeneration and Wet Age-related Macular Degeneration (Wet AMD segment is projected to grow significantly due to increased prevalence and availability of effective treatments).
- By Stage of Disease: Early-stage AMD, Intermediate AMD, and Late-stage AMD (Late-stage AMD segment represents a significant market due to high treatment needs).
- By Treatment Type: Drug and Device (Drug therapy dominates the market, while devices play a supporting role in diagnosis and treatment).
- By Route of Administration: Intravenous Route and Intravitreal Route (Intravitreal route is projected to maintain its dominance due to its targeted delivery).
- By Sales Channel: Ambulatory Surgical Centers, Hospitals, and Other Sales Channels (Ambulatory Surgical Centers segment is witnessing robust growth due to increasing preference for cost-effective treatment settings).
- Other Drugs & Devices: This segment includes a variety of supplementary treatments and diagnostic tools.
- Other Devices & Surgery: This segment covers surgical interventions and other related devices in conjunction with drug therapies.
Each segment's market size, growth projections, and competitive dynamics are thoroughly analyzed within the report.
Key Drivers of Macular Degeneration Treatment Market Growth
The Macular Degeneration Treatment Market is driven by several key factors:
- Increasing Prevalence of AMD: The aging global population is significantly contributing to the rise in AMD cases, thereby increasing demand for effective treatments.
- Technological Advancements: Innovations in gene therapy, targeted drug delivery, and imaging techniques are enhancing treatment options and outcomes.
- Favorable Regulatory Environment: Approvals for new and improved therapies fuel market expansion.
- Rising Healthcare Expenditure: Increased spending on healthcare globally supports market growth by making advanced treatments more accessible.
Challenges in the Macular Degeneration Treatment Market Sector
Despite the growth potential, the Macular Degeneration Treatment Market faces several challenges:
- High Cost of Treatments: Advanced therapies can be expensive, limiting accessibility for many patients.
- Stringent Regulatory Approvals: Obtaining regulatory approvals for new treatments is time-consuming and costly, hindering market entry for new players.
- Competition from Generic Drugs: The entry of generic drugs can impact the pricing and profitability of innovative therapies.
- Treatment limitations: Currently available treatments do not address all forms and stages of AMD equally effectively.
Leading Players in the Macular Degeneration Treatment Market Market
- REGENXBIO Inc
- Regeneron Pharmaceuticals Inc
- Bayer AG
- Novartis AG
- Lineage Cell Therapeutics
- Panoptica
- Oxurion
- F Hoffmann-La Roche Ltd
- Clover Therapeutics
- Aerie Pharmaceutical Inc
- ONL Therapeutics
- MeiraGTx
- Ocugen Inc
- Bausch Health Companies Inc
- Pfizer Inc
Key Developments in Macular Degeneration Treatment Market Sector
- November 2022: IVERIC bio, Inc. submitted the first part of its NDA to the US FDA for a rolling review of avacincaptad pegol, a novel complement C5 inhibitor, for geographic atrophy (GA) secondary to AMD. This signifies progress towards new treatment options for a currently underserved patient population.
- November 2022: The European Commission granted marketing authorization for Ximluci, a ranibizumab biosimilar. This increases competition and potentially lowers treatment costs, improving access to effective therapies.
Strategic Macular Degeneration Treatment Market Market Outlook
The future of the Macular Degeneration Treatment Market is bright, with continued growth driven by advancements in gene therapy, personalized medicine, and improved diagnostic tools. Strategic opportunities exist for companies focusing on innovative therapies, improved drug delivery systems, and addressing unmet needs in dry AMD and geographic atrophy. Expanding into emerging markets and focusing on patient access and affordability will be crucial for long-term success. The market offers exciting prospects for players who can adapt to the evolving therapeutic landscape and bring innovative, cost-effective treatments to patients.
Macular Degeneration Treatment Market Segmentation
-
1. Type
- 1.1. Dry Age-related Macular Degeneration
- 1.2. Wet Age-related Macular Degeneration
-
2. Stage of Disease
- 2.1. Early-stage AMD
- 2.2. Intermediate AMD
- 2.3. Late-stage AMD
-
3. Treatment Type
-
3.1. Drug
- 3.1.1. Anti-vascular Endothelial Growth Factor
- 3.1.2. Dietary Supplements
- 3.1.3. Other Drugs
-
3.2. Devices
- 3.2.1. Glasses
- 3.2.2. Contact Lenses
- 3.2.3. Other Devices
-
3.3. Surgery
- 3.3.1. Laser Surgery
- 3.3.2. Other Surgeries
-
3.1. Drug
-
4. Route of Administration
- 4.1. Intravenous Route
- 4.2. Intravitreal Route
-
5. Sales Channel
- 5.1. Ambulatory Surgical Centers
- 5.2. Hospitals
- 5.3. Other Sales Channels
Macular Degeneration Treatment Market Segmentation By Geography
-
1. North America
- 1.1. United States
- 1.2. Canada
- 1.3. Mexico
-
2. Europe
- 2.1. Germany
- 2.2. United Kingdom
- 2.3. France
- 2.4. Italy
- 2.5. Spain
- 2.6. Rest of Europe
-
3. Asia Pacific
- 3.1. China
- 3.2. Japan
- 3.3. India
- 3.4. Australia
- 3.5. South Korea
- 3.6. Rest of Asia Pacific
-
4. Middle East and Africa
- 4.1. GCC
- 4.2. South Africa
- 4.3. Rest of Middle East and Africa
-
5. South America
- 5.1. Brazil
- 5.2. Argentina
- 5.3. Rest of South America
Macular Degeneration Treatment Market REPORT HIGHLIGHTS
| Aspects | Details |
|---|---|
| Study Period | 2019-2033 |
| Base Year | 2024 |
| Estimated Year | 2025 |
| Forecast Period | 2025-2033 |
| Historical Period | 2019-2024 |
| Growth Rate | CAGR of 8.51% from 2019-2033 |
| Segmentation |
|
Table of Contents
- 1. Introduction
- 1.1. Research Scope
- 1.2. Market Segmentation
- 1.3. Research Methodology
- 1.4. Definitions and Assumptions
- 2. Executive Summary
- 2.1. Introduction
- 3. Market Dynamics
- 3.1. Introduction
- 3.2. Market Drivers
- 3.2.1. Increasing Burden of Retinal Disorders; Upsurge in the Geriatric Population; Increase in Research and Development Investments
- 3.3. Market Restrains
- 3.3.1. Increasing Use of Off-label Drugs; Lack of Awareness Regarding AMD
- 3.4. Market Trends
- 3.4.1. Wet Age-related Macular Degeneration is Expected to Hold Significant Market Share Over the Forecast Period
- 4. Market Factor Analysis
- 4.1. Porters Five Forces
- 4.2. Supply/Value Chain
- 4.3. PESTEL analysis
- 4.4. Market Entropy
- 4.5. Patent/Trademark Analysis
- 5. Global Macular Degeneration Treatment Market Analysis, Insights and Forecast, 2019-2031
- 5.1. Market Analysis, Insights and Forecast - by Type
- 5.1.1. Dry Age-related Macular Degeneration
- 5.1.2. Wet Age-related Macular Degeneration
- 5.2. Market Analysis, Insights and Forecast - by Stage of Disease
- 5.2.1. Early-stage AMD
- 5.2.2. Intermediate AMD
- 5.2.3. Late-stage AMD
- 5.3. Market Analysis, Insights and Forecast - by Treatment Type
- 5.3.1. Drug
- 5.3.1.1. Anti-vascular Endothelial Growth Factor
- 5.3.1.2. Dietary Supplements
- 5.3.1.3. Other Drugs
- 5.3.2. Devices
- 5.3.2.1. Glasses
- 5.3.2.2. Contact Lenses
- 5.3.2.3. Other Devices
- 5.3.3. Surgery
- 5.3.3.1. Laser Surgery
- 5.3.3.2. Other Surgeries
- 5.3.1. Drug
- 5.4. Market Analysis, Insights and Forecast - by Route of Administration
- 5.4.1. Intravenous Route
- 5.4.2. Intravitreal Route
- 5.5. Market Analysis, Insights and Forecast - by Sales Channel
- 5.5.1. Ambulatory Surgical Centers
- 5.5.2. Hospitals
- 5.5.3. Other Sales Channels
- 5.6. Market Analysis, Insights and Forecast - by Region
- 5.6.1. North America
- 5.6.2. Europe
- 5.6.3. Asia Pacific
- 5.6.4. Middle East and Africa
- 5.6.5. South America
- 5.1. Market Analysis, Insights and Forecast - by Type
- 6. North America Macular Degeneration Treatment Market Analysis, Insights and Forecast, 2019-2031
- 6.1. Market Analysis, Insights and Forecast - by Type
- 6.1.1. Dry Age-related Macular Degeneration
- 6.1.2. Wet Age-related Macular Degeneration
- 6.2. Market Analysis, Insights and Forecast - by Stage of Disease
- 6.2.1. Early-stage AMD
- 6.2.2. Intermediate AMD
- 6.2.3. Late-stage AMD
- 6.3. Market Analysis, Insights and Forecast - by Treatment Type
- 6.3.1. Drug
- 6.3.1.1. Anti-vascular Endothelial Growth Factor
- 6.3.1.2. Dietary Supplements
- 6.3.1.3. Other Drugs
- 6.3.2. Devices
- 6.3.2.1. Glasses
- 6.3.2.2. Contact Lenses
- 6.3.2.3. Other Devices
- 6.3.3. Surgery
- 6.3.3.1. Laser Surgery
- 6.3.3.2. Other Surgeries
- 6.3.1. Drug
- 6.4. Market Analysis, Insights and Forecast - by Route of Administration
- 6.4.1. Intravenous Route
- 6.4.2. Intravitreal Route
- 6.5. Market Analysis, Insights and Forecast - by Sales Channel
- 6.5.1. Ambulatory Surgical Centers
- 6.5.2. Hospitals
- 6.5.3. Other Sales Channels
- 6.1. Market Analysis, Insights and Forecast - by Type
- 7. Europe Macular Degeneration Treatment Market Analysis, Insights and Forecast, 2019-2031
- 7.1. Market Analysis, Insights and Forecast - by Type
- 7.1.1. Dry Age-related Macular Degeneration
- 7.1.2. Wet Age-related Macular Degeneration
- 7.2. Market Analysis, Insights and Forecast - by Stage of Disease
- 7.2.1. Early-stage AMD
- 7.2.2. Intermediate AMD
- 7.2.3. Late-stage AMD
- 7.3. Market Analysis, Insights and Forecast - by Treatment Type
- 7.3.1. Drug
- 7.3.1.1. Anti-vascular Endothelial Growth Factor
- 7.3.1.2. Dietary Supplements
- 7.3.1.3. Other Drugs
- 7.3.2. Devices
- 7.3.2.1. Glasses
- 7.3.2.2. Contact Lenses
- 7.3.2.3. Other Devices
- 7.3.3. Surgery
- 7.3.3.1. Laser Surgery
- 7.3.3.2. Other Surgeries
- 7.3.1. Drug
- 7.4. Market Analysis, Insights and Forecast - by Route of Administration
- 7.4.1. Intravenous Route
- 7.4.2. Intravitreal Route
- 7.5. Market Analysis, Insights and Forecast - by Sales Channel
- 7.5.1. Ambulatory Surgical Centers
- 7.5.2. Hospitals
- 7.5.3. Other Sales Channels
- 7.1. Market Analysis, Insights and Forecast - by Type
- 8. Asia Pacific Macular Degeneration Treatment Market Analysis, Insights and Forecast, 2019-2031
- 8.1. Market Analysis, Insights and Forecast - by Type
- 8.1.1. Dry Age-related Macular Degeneration
- 8.1.2. Wet Age-related Macular Degeneration
- 8.2. Market Analysis, Insights and Forecast - by Stage of Disease
- 8.2.1. Early-stage AMD
- 8.2.2. Intermediate AMD
- 8.2.3. Late-stage AMD
- 8.3. Market Analysis, Insights and Forecast - by Treatment Type
- 8.3.1. Drug
- 8.3.1.1. Anti-vascular Endothelial Growth Factor
- 8.3.1.2. Dietary Supplements
- 8.3.1.3. Other Drugs
- 8.3.2. Devices
- 8.3.2.1. Glasses
- 8.3.2.2. Contact Lenses
- 8.3.2.3. Other Devices
- 8.3.3. Surgery
- 8.3.3.1. Laser Surgery
- 8.3.3.2. Other Surgeries
- 8.3.1. Drug
- 8.4. Market Analysis, Insights and Forecast - by Route of Administration
- 8.4.1. Intravenous Route
- 8.4.2. Intravitreal Route
- 8.5. Market Analysis, Insights and Forecast - by Sales Channel
- 8.5.1. Ambulatory Surgical Centers
- 8.5.2. Hospitals
- 8.5.3. Other Sales Channels
- 8.1. Market Analysis, Insights and Forecast - by Type
- 9. Middle East and Africa Macular Degeneration Treatment Market Analysis, Insights and Forecast, 2019-2031
- 9.1. Market Analysis, Insights and Forecast - by Type
- 9.1.1. Dry Age-related Macular Degeneration
- 9.1.2. Wet Age-related Macular Degeneration
- 9.2. Market Analysis, Insights and Forecast - by Stage of Disease
- 9.2.1. Early-stage AMD
- 9.2.2. Intermediate AMD
- 9.2.3. Late-stage AMD
- 9.3. Market Analysis, Insights and Forecast - by Treatment Type
- 9.3.1. Drug
- 9.3.1.1. Anti-vascular Endothelial Growth Factor
- 9.3.1.2. Dietary Supplements
- 9.3.1.3. Other Drugs
- 9.3.2. Devices
- 9.3.2.1. Glasses
- 9.3.2.2. Contact Lenses
- 9.3.2.3. Other Devices
- 9.3.3. Surgery
- 9.3.3.1. Laser Surgery
- 9.3.3.2. Other Surgeries
- 9.3.1. Drug
- 9.4. Market Analysis, Insights and Forecast - by Route of Administration
- 9.4.1. Intravenous Route
- 9.4.2. Intravitreal Route
- 9.5. Market Analysis, Insights and Forecast - by Sales Channel
- 9.5.1. Ambulatory Surgical Centers
- 9.5.2. Hospitals
- 9.5.3. Other Sales Channels
- 9.1. Market Analysis, Insights and Forecast - by Type
- 10. South America Macular Degeneration Treatment Market Analysis, Insights and Forecast, 2019-2031
- 10.1. Market Analysis, Insights and Forecast - by Type
- 10.1.1. Dry Age-related Macular Degeneration
- 10.1.2. Wet Age-related Macular Degeneration
- 10.2. Market Analysis, Insights and Forecast - by Stage of Disease
- 10.2.1. Early-stage AMD
- 10.2.2. Intermediate AMD
- 10.2.3. Late-stage AMD
- 10.3. Market Analysis, Insights and Forecast - by Treatment Type
- 10.3.1. Drug
- 10.3.1.1. Anti-vascular Endothelial Growth Factor
- 10.3.1.2. Dietary Supplements
- 10.3.1.3. Other Drugs
- 10.3.2. Devices
- 10.3.2.1. Glasses
- 10.3.2.2. Contact Lenses
- 10.3.2.3. Other Devices
- 10.3.3. Surgery
- 10.3.3.1. Laser Surgery
- 10.3.3.2. Other Surgeries
- 10.3.1. Drug
- 10.4. Market Analysis, Insights and Forecast - by Route of Administration
- 10.4.1. Intravenous Route
- 10.4.2. Intravitreal Route
- 10.5. Market Analysis, Insights and Forecast - by Sales Channel
- 10.5.1. Ambulatory Surgical Centers
- 10.5.2. Hospitals
- 10.5.3. Other Sales Channels
- 10.1. Market Analysis, Insights and Forecast - by Type
- 11. North America Macular Degeneration Treatment Market Analysis, Insights and Forecast, 2019-2031
- 11.1. Market Analysis, Insights and Forecast - By Country/Sub-region
- 11.1.1 United States
- 11.1.2 Canada
- 11.1.3 Mexico
- 12. Europe Macular Degeneration Treatment Market Analysis, Insights and Forecast, 2019-2031
- 12.1. Market Analysis, Insights and Forecast - By Country/Sub-region
- 12.1.1 Germany
- 12.1.2 United Kingdom
- 12.1.3 France
- 12.1.4 Italy
- 12.1.5 Spain
- 12.1.6 Rest of Europe
- 13. Asia Pacific Macular Degeneration Treatment Market Analysis, Insights and Forecast, 2019-2031
- 13.1. Market Analysis, Insights and Forecast - By Country/Sub-region
- 13.1.1 China
- 13.1.2 Japan
- 13.1.3 India
- 13.1.4 Australia
- 13.1.5 South Korea
- 13.1.6 Rest of Asia Pacific
- 14. Middle East and Africa Macular Degeneration Treatment Market Analysis, Insights and Forecast, 2019-2031
- 14.1. Market Analysis, Insights and Forecast - By Country/Sub-region
- 14.1.1 GCC
- 14.1.2 South Africa
- 14.1.3 Rest of Middle East and Africa
- 15. South America Macular Degeneration Treatment Market Analysis, Insights and Forecast, 2019-2031
- 15.1. Market Analysis, Insights and Forecast - By Country/Sub-region
- 15.1.1 Brazil
- 15.1.2 Argentina
- 15.1.3 Rest of South America
- 16. Competitive Analysis
- 16.1. Global Market Share Analysis 2024
- 16.2. Company Profiles
- 16.2.1 REGENXBIO Inc
- 16.2.1.1. Overview
- 16.2.1.2. Products
- 16.2.1.3. SWOT Analysis
- 16.2.1.4. Recent Developments
- 16.2.1.5. Financials (Based on Availability)
- 16.2.2 Regeneron Pharmaceuticals Inc
- 16.2.2.1. Overview
- 16.2.2.2. Products
- 16.2.2.3. SWOT Analysis
- 16.2.2.4. Recent Developments
- 16.2.2.5. Financials (Based on Availability)
- 16.2.3 Bayer AG
- 16.2.3.1. Overview
- 16.2.3.2. Products
- 16.2.3.3. SWOT Analysis
- 16.2.3.4. Recent Developments
- 16.2.3.5. Financials (Based on Availability)
- 16.2.4 Novartis AG
- 16.2.4.1. Overview
- 16.2.4.2. Products
- 16.2.4.3. SWOT Analysis
- 16.2.4.4. Recent Developments
- 16.2.4.5. Financials (Based on Availability)
- 16.2.5 Lineage Cell Therapeutics
- 16.2.5.1. Overview
- 16.2.5.2. Products
- 16.2.5.3. SWOT Analysis
- 16.2.5.4. Recent Developments
- 16.2.5.5. Financials (Based on Availability)
- 16.2.6 Panoptica
- 16.2.6.1. Overview
- 16.2.6.2. Products
- 16.2.6.3. SWOT Analysis
- 16.2.6.4. Recent Developments
- 16.2.6.5. Financials (Based on Availability)
- 16.2.7 Oxurion
- 16.2.7.1. Overview
- 16.2.7.2. Products
- 16.2.7.3. SWOT Analysis
- 16.2.7.4. Recent Developments
- 16.2.7.5. Financials (Based on Availability)
- 16.2.8 F Hoffmann-La Roche Ltd
- 16.2.8.1. Overview
- 16.2.8.2. Products
- 16.2.8.3. SWOT Analysis
- 16.2.8.4. Recent Developments
- 16.2.8.5. Financials (Based on Availability)
- 16.2.9 Clover Therapeutics
- 16.2.9.1. Overview
- 16.2.9.2. Products
- 16.2.9.3. SWOT Analysis
- 16.2.9.4. Recent Developments
- 16.2.9.5. Financials (Based on Availability)
- 16.2.10 Aerie Pharmaceutical Inc
- 16.2.10.1. Overview
- 16.2.10.2. Products
- 16.2.10.3. SWOT Analysis
- 16.2.10.4. Recent Developments
- 16.2.10.5. Financials (Based on Availability)
- 16.2.11 ONL Therapeutics
- 16.2.11.1. Overview
- 16.2.11.2. Products
- 16.2.11.3. SWOT Analysis
- 16.2.11.4. Recent Developments
- 16.2.11.5. Financials (Based on Availability)
- 16.2.12 MeiraGTx
- 16.2.12.1. Overview
- 16.2.12.2. Products
- 16.2.12.3. SWOT Analysis
- 16.2.12.4. Recent Developments
- 16.2.12.5. Financials (Based on Availability)
- 16.2.13 Ocugen Inc
- 16.2.13.1. Overview
- 16.2.13.2. Products
- 16.2.13.3. SWOT Analysis
- 16.2.13.4. Recent Developments
- 16.2.13.5. Financials (Based on Availability)
- 16.2.14 Bausch Health Companies Inc
- 16.2.14.1. Overview
- 16.2.14.2. Products
- 16.2.14.3. SWOT Analysis
- 16.2.14.4. Recent Developments
- 16.2.14.5. Financials (Based on Availability)
- 16.2.15 Pfizer Inc
- 16.2.15.1. Overview
- 16.2.15.2. Products
- 16.2.15.3. SWOT Analysis
- 16.2.15.4. Recent Developments
- 16.2.15.5. Financials (Based on Availability)
- 16.2.1 REGENXBIO Inc
List of Figures
- Figure 1: Global Macular Degeneration Treatment Market Revenue Breakdown (Million, %) by Region 2024 & 2032
- Figure 2: Global Macular Degeneration Treatment Market Volume Breakdown (K Unit, %) by Region 2024 & 2032
- Figure 3: North America Macular Degeneration Treatment Market Revenue (Million), by Country 2024 & 2032
- Figure 4: North America Macular Degeneration Treatment Market Volume (K Unit), by Country 2024 & 2032
- Figure 5: North America Macular Degeneration Treatment Market Revenue Share (%), by Country 2024 & 2032
- Figure 6: North America Macular Degeneration Treatment Market Volume Share (%), by Country 2024 & 2032
- Figure 7: Europe Macular Degeneration Treatment Market Revenue (Million), by Country 2024 & 2032
- Figure 8: Europe Macular Degeneration Treatment Market Volume (K Unit), by Country 2024 & 2032
- Figure 9: Europe Macular Degeneration Treatment Market Revenue Share (%), by Country 2024 & 2032
- Figure 10: Europe Macular Degeneration Treatment Market Volume Share (%), by Country 2024 & 2032
- Figure 11: Asia Pacific Macular Degeneration Treatment Market Revenue (Million), by Country 2024 & 2032
- Figure 12: Asia Pacific Macular Degeneration Treatment Market Volume (K Unit), by Country 2024 & 2032
- Figure 13: Asia Pacific Macular Degeneration Treatment Market Revenue Share (%), by Country 2024 & 2032
- Figure 14: Asia Pacific Macular Degeneration Treatment Market Volume Share (%), by Country 2024 & 2032
- Figure 15: Middle East and Africa Macular Degeneration Treatment Market Revenue (Million), by Country 2024 & 2032
- Figure 16: Middle East and Africa Macular Degeneration Treatment Market Volume (K Unit), by Country 2024 & 2032
- Figure 17: Middle East and Africa Macular Degeneration Treatment Market Revenue Share (%), by Country 2024 & 2032
- Figure 18: Middle East and Africa Macular Degeneration Treatment Market Volume Share (%), by Country 2024 & 2032
- Figure 19: South America Macular Degeneration Treatment Market Revenue (Million), by Country 2024 & 2032
- Figure 20: South America Macular Degeneration Treatment Market Volume (K Unit), by Country 2024 & 2032
- Figure 21: South America Macular Degeneration Treatment Market Revenue Share (%), by Country 2024 & 2032
- Figure 22: South America Macular Degeneration Treatment Market Volume Share (%), by Country 2024 & 2032
- Figure 23: North America Macular Degeneration Treatment Market Revenue (Million), by Type 2024 & 2032
- Figure 24: North America Macular Degeneration Treatment Market Volume (K Unit), by Type 2024 & 2032
- Figure 25: North America Macular Degeneration Treatment Market Revenue Share (%), by Type 2024 & 2032
- Figure 26: North America Macular Degeneration Treatment Market Volume Share (%), by Type 2024 & 2032
- Figure 27: North America Macular Degeneration Treatment Market Revenue (Million), by Stage of Disease 2024 & 2032
- Figure 28: North America Macular Degeneration Treatment Market Volume (K Unit), by Stage of Disease 2024 & 2032
- Figure 29: North America Macular Degeneration Treatment Market Revenue Share (%), by Stage of Disease 2024 & 2032
- Figure 30: North America Macular Degeneration Treatment Market Volume Share (%), by Stage of Disease 2024 & 2032
- Figure 31: North America Macular Degeneration Treatment Market Revenue (Million), by Treatment Type 2024 & 2032
- Figure 32: North America Macular Degeneration Treatment Market Volume (K Unit), by Treatment Type 2024 & 2032
- Figure 33: North America Macular Degeneration Treatment Market Revenue Share (%), by Treatment Type 2024 & 2032
- Figure 34: North America Macular Degeneration Treatment Market Volume Share (%), by Treatment Type 2024 & 2032
- Figure 35: North America Macular Degeneration Treatment Market Revenue (Million), by Route of Administration 2024 & 2032
- Figure 36: North America Macular Degeneration Treatment Market Volume (K Unit), by Route of Administration 2024 & 2032
- Figure 37: North America Macular Degeneration Treatment Market Revenue Share (%), by Route of Administration 2024 & 2032
- Figure 38: North America Macular Degeneration Treatment Market Volume Share (%), by Route of Administration 2024 & 2032
- Figure 39: North America Macular Degeneration Treatment Market Revenue (Million), by Sales Channel 2024 & 2032
- Figure 40: North America Macular Degeneration Treatment Market Volume (K Unit), by Sales Channel 2024 & 2032
- Figure 41: North America Macular Degeneration Treatment Market Revenue Share (%), by Sales Channel 2024 & 2032
- Figure 42: North America Macular Degeneration Treatment Market Volume Share (%), by Sales Channel 2024 & 2032
- Figure 43: North America Macular Degeneration Treatment Market Revenue (Million), by Country 2024 & 2032
- Figure 44: North America Macular Degeneration Treatment Market Volume (K Unit), by Country 2024 & 2032
- Figure 45: North America Macular Degeneration Treatment Market Revenue Share (%), by Country 2024 & 2032
- Figure 46: North America Macular Degeneration Treatment Market Volume Share (%), by Country 2024 & 2032
- Figure 47: Europe Macular Degeneration Treatment Market Revenue (Million), by Type 2024 & 2032
- Figure 48: Europe Macular Degeneration Treatment Market Volume (K Unit), by Type 2024 & 2032
- Figure 49: Europe Macular Degeneration Treatment Market Revenue Share (%), by Type 2024 & 2032
- Figure 50: Europe Macular Degeneration Treatment Market Volume Share (%), by Type 2024 & 2032
- Figure 51: Europe Macular Degeneration Treatment Market Revenue (Million), by Stage of Disease 2024 & 2032
- Figure 52: Europe Macular Degeneration Treatment Market Volume (K Unit), by Stage of Disease 2024 & 2032
- Figure 53: Europe Macular Degeneration Treatment Market Revenue Share (%), by Stage of Disease 2024 & 2032
- Figure 54: Europe Macular Degeneration Treatment Market Volume Share (%), by Stage of Disease 2024 & 2032
- Figure 55: Europe Macular Degeneration Treatment Market Revenue (Million), by Treatment Type 2024 & 2032
- Figure 56: Europe Macular Degeneration Treatment Market Volume (K Unit), by Treatment Type 2024 & 2032
- Figure 57: Europe Macular Degeneration Treatment Market Revenue Share (%), by Treatment Type 2024 & 2032
- Figure 58: Europe Macular Degeneration Treatment Market Volume Share (%), by Treatment Type 2024 & 2032
- Figure 59: Europe Macular Degeneration Treatment Market Revenue (Million), by Route of Administration 2024 & 2032
- Figure 60: Europe Macular Degeneration Treatment Market Volume (K Unit), by Route of Administration 2024 & 2032
- Figure 61: Europe Macular Degeneration Treatment Market Revenue Share (%), by Route of Administration 2024 & 2032
- Figure 62: Europe Macular Degeneration Treatment Market Volume Share (%), by Route of Administration 2024 & 2032
- Figure 63: Europe Macular Degeneration Treatment Market Revenue (Million), by Sales Channel 2024 & 2032
- Figure 64: Europe Macular Degeneration Treatment Market Volume (K Unit), by Sales Channel 2024 & 2032
- Figure 65: Europe Macular Degeneration Treatment Market Revenue Share (%), by Sales Channel 2024 & 2032
- Figure 66: Europe Macular Degeneration Treatment Market Volume Share (%), by Sales Channel 2024 & 2032
- Figure 67: Europe Macular Degeneration Treatment Market Revenue (Million), by Country 2024 & 2032
- Figure 68: Europe Macular Degeneration Treatment Market Volume (K Unit), by Country 2024 & 2032
- Figure 69: Europe Macular Degeneration Treatment Market Revenue Share (%), by Country 2024 & 2032
- Figure 70: Europe Macular Degeneration Treatment Market Volume Share (%), by Country 2024 & 2032
- Figure 71: Asia Pacific Macular Degeneration Treatment Market Revenue (Million), by Type 2024 & 2032
- Figure 72: Asia Pacific Macular Degeneration Treatment Market Volume (K Unit), by Type 2024 & 2032
- Figure 73: Asia Pacific Macular Degeneration Treatment Market Revenue Share (%), by Type 2024 & 2032
- Figure 74: Asia Pacific Macular Degeneration Treatment Market Volume Share (%), by Type 2024 & 2032
- Figure 75: Asia Pacific Macular Degeneration Treatment Market Revenue (Million), by Stage of Disease 2024 & 2032
- Figure 76: Asia Pacific Macular Degeneration Treatment Market Volume (K Unit), by Stage of Disease 2024 & 2032
- Figure 77: Asia Pacific Macular Degeneration Treatment Market Revenue Share (%), by Stage of Disease 2024 & 2032
- Figure 78: Asia Pacific Macular Degeneration Treatment Market Volume Share (%), by Stage of Disease 2024 & 2032
- Figure 79: Asia Pacific Macular Degeneration Treatment Market Revenue (Million), by Treatment Type 2024 & 2032
- Figure 80: Asia Pacific Macular Degeneration Treatment Market Volume (K Unit), by Treatment Type 2024 & 2032
- Figure 81: Asia Pacific Macular Degeneration Treatment Market Revenue Share (%), by Treatment Type 2024 & 2032
- Figure 82: Asia Pacific Macular Degeneration Treatment Market Volume Share (%), by Treatment Type 2024 & 2032
- Figure 83: Asia Pacific Macular Degeneration Treatment Market Revenue (Million), by Route of Administration 2024 & 2032
- Figure 84: Asia Pacific Macular Degeneration Treatment Market Volume (K Unit), by Route of Administration 2024 & 2032
- Figure 85: Asia Pacific Macular Degeneration Treatment Market Revenue Share (%), by Route of Administration 2024 & 2032
- Figure 86: Asia Pacific Macular Degeneration Treatment Market Volume Share (%), by Route of Administration 2024 & 2032
- Figure 87: Asia Pacific Macular Degeneration Treatment Market Revenue (Million), by Sales Channel 2024 & 2032
- Figure 88: Asia Pacific Macular Degeneration Treatment Market Volume (K Unit), by Sales Channel 2024 & 2032
- Figure 89: Asia Pacific Macular Degeneration Treatment Market Revenue Share (%), by Sales Channel 2024 & 2032
- Figure 90: Asia Pacific Macular Degeneration Treatment Market Volume Share (%), by Sales Channel 2024 & 2032
- Figure 91: Asia Pacific Macular Degeneration Treatment Market Revenue (Million), by Country 2024 & 2032
- Figure 92: Asia Pacific Macular Degeneration Treatment Market Volume (K Unit), by Country 2024 & 2032
- Figure 93: Asia Pacific Macular Degeneration Treatment Market Revenue Share (%), by Country 2024 & 2032
- Figure 94: Asia Pacific Macular Degeneration Treatment Market Volume Share (%), by Country 2024 & 2032
- Figure 95: Middle East and Africa Macular Degeneration Treatment Market Revenue (Million), by Type 2024 & 2032
- Figure 96: Middle East and Africa Macular Degeneration Treatment Market Volume (K Unit), by Type 2024 & 2032
- Figure 97: Middle East and Africa Macular Degeneration Treatment Market Revenue Share (%), by Type 2024 & 2032
- Figure 98: Middle East and Africa Macular Degeneration Treatment Market Volume Share (%), by Type 2024 & 2032
- Figure 99: Middle East and Africa Macular Degeneration Treatment Market Revenue (Million), by Stage of Disease 2024 & 2032
- Figure 100: Middle East and Africa Macular Degeneration Treatment Market Volume (K Unit), by Stage of Disease 2024 & 2032
- Figure 101: Middle East and Africa Macular Degeneration Treatment Market Revenue Share (%), by Stage of Disease 2024 & 2032
- Figure 102: Middle East and Africa Macular Degeneration Treatment Market Volume Share (%), by Stage of Disease 2024 & 2032
- Figure 103: Middle East and Africa Macular Degeneration Treatment Market Revenue (Million), by Treatment Type 2024 & 2032
- Figure 104: Middle East and Africa Macular Degeneration Treatment Market Volume (K Unit), by Treatment Type 2024 & 2032
- Figure 105: Middle East and Africa Macular Degeneration Treatment Market Revenue Share (%), by Treatment Type 2024 & 2032
- Figure 106: Middle East and Africa Macular Degeneration Treatment Market Volume Share (%), by Treatment Type 2024 & 2032
- Figure 107: Middle East and Africa Macular Degeneration Treatment Market Revenue (Million), by Route of Administration 2024 & 2032
- Figure 108: Middle East and Africa Macular Degeneration Treatment Market Volume (K Unit), by Route of Administration 2024 & 2032
- Figure 109: Middle East and Africa Macular Degeneration Treatment Market Revenue Share (%), by Route of Administration 2024 & 2032
- Figure 110: Middle East and Africa Macular Degeneration Treatment Market Volume Share (%), by Route of Administration 2024 & 2032
- Figure 111: Middle East and Africa Macular Degeneration Treatment Market Revenue (Million), by Sales Channel 2024 & 2032
- Figure 112: Middle East and Africa Macular Degeneration Treatment Market Volume (K Unit), by Sales Channel 2024 & 2032
- Figure 113: Middle East and Africa Macular Degeneration Treatment Market Revenue Share (%), by Sales Channel 2024 & 2032
- Figure 114: Middle East and Africa Macular Degeneration Treatment Market Volume Share (%), by Sales Channel 2024 & 2032
- Figure 115: Middle East and Africa Macular Degeneration Treatment Market Revenue (Million), by Country 2024 & 2032
- Figure 116: Middle East and Africa Macular Degeneration Treatment Market Volume (K Unit), by Country 2024 & 2032
- Figure 117: Middle East and Africa Macular Degeneration Treatment Market Revenue Share (%), by Country 2024 & 2032
- Figure 118: Middle East and Africa Macular Degeneration Treatment Market Volume Share (%), by Country 2024 & 2032
- Figure 119: South America Macular Degeneration Treatment Market Revenue (Million), by Type 2024 & 2032
- Figure 120: South America Macular Degeneration Treatment Market Volume (K Unit), by Type 2024 & 2032
- Figure 121: South America Macular Degeneration Treatment Market Revenue Share (%), by Type 2024 & 2032
- Figure 122: South America Macular Degeneration Treatment Market Volume Share (%), by Type 2024 & 2032
- Figure 123: South America Macular Degeneration Treatment Market Revenue (Million), by Stage of Disease 2024 & 2032
- Figure 124: South America Macular Degeneration Treatment Market Volume (K Unit), by Stage of Disease 2024 & 2032
- Figure 125: South America Macular Degeneration Treatment Market Revenue Share (%), by Stage of Disease 2024 & 2032
- Figure 126: South America Macular Degeneration Treatment Market Volume Share (%), by Stage of Disease 2024 & 2032
- Figure 127: South America Macular Degeneration Treatment Market Revenue (Million), by Treatment Type 2024 & 2032
- Figure 128: South America Macular Degeneration Treatment Market Volume (K Unit), by Treatment Type 2024 & 2032
- Figure 129: South America Macular Degeneration Treatment Market Revenue Share (%), by Treatment Type 2024 & 2032
- Figure 130: South America Macular Degeneration Treatment Market Volume Share (%), by Treatment Type 2024 & 2032
- Figure 131: South America Macular Degeneration Treatment Market Revenue (Million), by Route of Administration 2024 & 2032
- Figure 132: South America Macular Degeneration Treatment Market Volume (K Unit), by Route of Administration 2024 & 2032
- Figure 133: South America Macular Degeneration Treatment Market Revenue Share (%), by Route of Administration 2024 & 2032
- Figure 134: South America Macular Degeneration Treatment Market Volume Share (%), by Route of Administration 2024 & 2032
- Figure 135: South America Macular Degeneration Treatment Market Revenue (Million), by Sales Channel 2024 & 2032
- Figure 136: South America Macular Degeneration Treatment Market Volume (K Unit), by Sales Channel 2024 & 2032
- Figure 137: South America Macular Degeneration Treatment Market Revenue Share (%), by Sales Channel 2024 & 2032
- Figure 138: South America Macular Degeneration Treatment Market Volume Share (%), by Sales Channel 2024 & 2032
- Figure 139: South America Macular Degeneration Treatment Market Revenue (Million), by Country 2024 & 2032
- Figure 140: South America Macular Degeneration Treatment Market Volume (K Unit), by Country 2024 & 2032
- Figure 141: South America Macular Degeneration Treatment Market Revenue Share (%), by Country 2024 & 2032
- Figure 142: South America Macular Degeneration Treatment Market Volume Share (%), by Country 2024 & 2032
List of Tables
- Table 1: Global Macular Degeneration Treatment Market Revenue Million Forecast, by Region 2019 & 2032
- Table 2: Global Macular Degeneration Treatment Market Volume K Unit Forecast, by Region 2019 & 2032
- Table 3: Global Macular Degeneration Treatment Market Revenue Million Forecast, by Type 2019 & 2032
- Table 4: Global Macular Degeneration Treatment Market Volume K Unit Forecast, by Type 2019 & 2032
- Table 5: Global Macular Degeneration Treatment Market Revenue Million Forecast, by Stage of Disease 2019 & 2032
- Table 6: Global Macular Degeneration Treatment Market Volume K Unit Forecast, by Stage of Disease 2019 & 2032
- Table 7: Global Macular Degeneration Treatment Market Revenue Million Forecast, by Treatment Type 2019 & 2032
- Table 8: Global Macular Degeneration Treatment Market Volume K Unit Forecast, by Treatment Type 2019 & 2032
- Table 9: Global Macular Degeneration Treatment Market Revenue Million Forecast, by Route of Administration 2019 & 2032
- Table 10: Global Macular Degeneration Treatment Market Volume K Unit Forecast, by Route of Administration 2019 & 2032
- Table 11: Global Macular Degeneration Treatment Market Revenue Million Forecast, by Sales Channel 2019 & 2032
- Table 12: Global Macular Degeneration Treatment Market Volume K Unit Forecast, by Sales Channel 2019 & 2032
- Table 13: Global Macular Degeneration Treatment Market Revenue Million Forecast, by Region 2019 & 2032
- Table 14: Global Macular Degeneration Treatment Market Volume K Unit Forecast, by Region 2019 & 2032
- Table 15: Global Macular Degeneration Treatment Market Revenue Million Forecast, by Country 2019 & 2032
- Table 16: Global Macular Degeneration Treatment Market Volume K Unit Forecast, by Country 2019 & 2032
- Table 17: United States Macular Degeneration Treatment Market Revenue (Million) Forecast, by Application 2019 & 2032
- Table 18: United States Macular Degeneration Treatment Market Volume (K Unit) Forecast, by Application 2019 & 2032
- Table 19: Canada Macular Degeneration Treatment Market Revenue (Million) Forecast, by Application 2019 & 2032
- Table 20: Canada Macular Degeneration Treatment Market Volume (K Unit) Forecast, by Application 2019 & 2032
- Table 21: Mexico Macular Degeneration Treatment Market Revenue (Million) Forecast, by Application 2019 & 2032
- Table 22: Mexico Macular Degeneration Treatment Market Volume (K Unit) Forecast, by Application 2019 & 2032
- Table 23: Global Macular Degeneration Treatment Market Revenue Million Forecast, by Country 2019 & 2032
- Table 24: Global Macular Degeneration Treatment Market Volume K Unit Forecast, by Country 2019 & 2032
- Table 25: Germany Macular Degeneration Treatment Market Revenue (Million) Forecast, by Application 2019 & 2032
- Table 26: Germany Macular Degeneration Treatment Market Volume (K Unit) Forecast, by Application 2019 & 2032
- Table 27: United Kingdom Macular Degeneration Treatment Market Revenue (Million) Forecast, by Application 2019 & 2032
- Table 28: United Kingdom Macular Degeneration Treatment Market Volume (K Unit) Forecast, by Application 2019 & 2032
- Table 29: France Macular Degeneration Treatment Market Revenue (Million) Forecast, by Application 2019 & 2032
- Table 30: France Macular Degeneration Treatment Market Volume (K Unit) Forecast, by Application 2019 & 2032
- Table 31: Italy Macular Degeneration Treatment Market Revenue (Million) Forecast, by Application 2019 & 2032
- Table 32: Italy Macular Degeneration Treatment Market Volume (K Unit) Forecast, by Application 2019 & 2032
- Table 33: Spain Macular Degeneration Treatment Market Revenue (Million) Forecast, by Application 2019 & 2032
- Table 34: Spain Macular Degeneration Treatment Market Volume (K Unit) Forecast, by Application 2019 & 2032
- Table 35: Rest of Europe Macular Degeneration Treatment Market Revenue (Million) Forecast, by Application 2019 & 2032
- Table 36: Rest of Europe Macular Degeneration Treatment Market Volume (K Unit) Forecast, by Application 2019 & 2032
- Table 37: Global Macular Degeneration Treatment Market Revenue Million Forecast, by Country 2019 & 2032
- Table 38: Global Macular Degeneration Treatment Market Volume K Unit Forecast, by Country 2019 & 2032
- Table 39: China Macular Degeneration Treatment Market Revenue (Million) Forecast, by Application 2019 & 2032
- Table 40: China Macular Degeneration Treatment Market Volume (K Unit) Forecast, by Application 2019 & 2032
- Table 41: Japan Macular Degeneration Treatment Market Revenue (Million) Forecast, by Application 2019 & 2032
- Table 42: Japan Macular Degeneration Treatment Market Volume (K Unit) Forecast, by Application 2019 & 2032
- Table 43: India Macular Degeneration Treatment Market Revenue (Million) Forecast, by Application 2019 & 2032
- Table 44: India Macular Degeneration Treatment Market Volume (K Unit) Forecast, by Application 2019 & 2032
- Table 45: Australia Macular Degeneration Treatment Market Revenue (Million) Forecast, by Application 2019 & 2032
- Table 46: Australia Macular Degeneration Treatment Market Volume (K Unit) Forecast, by Application 2019 & 2032
- Table 47: South Korea Macular Degeneration Treatment Market Revenue (Million) Forecast, by Application 2019 & 2032
- Table 48: South Korea Macular Degeneration Treatment Market Volume (K Unit) Forecast, by Application 2019 & 2032
- Table 49: Rest of Asia Pacific Macular Degeneration Treatment Market Revenue (Million) Forecast, by Application 2019 & 2032
- Table 50: Rest of Asia Pacific Macular Degeneration Treatment Market Volume (K Unit) Forecast, by Application 2019 & 2032
- Table 51: Global Macular Degeneration Treatment Market Revenue Million Forecast, by Country 2019 & 2032
- Table 52: Global Macular Degeneration Treatment Market Volume K Unit Forecast, by Country 2019 & 2032
- Table 53: GCC Macular Degeneration Treatment Market Revenue (Million) Forecast, by Application 2019 & 2032
- Table 54: GCC Macular Degeneration Treatment Market Volume (K Unit) Forecast, by Application 2019 & 2032
- Table 55: South Africa Macular Degeneration Treatment Market Revenue (Million) Forecast, by Application 2019 & 2032
- Table 56: South Africa Macular Degeneration Treatment Market Volume (K Unit) Forecast, by Application 2019 & 2032
- Table 57: Rest of Middle East and Africa Macular Degeneration Treatment Market Revenue (Million) Forecast, by Application 2019 & 2032
- Table 58: Rest of Middle East and Africa Macular Degeneration Treatment Market Volume (K Unit) Forecast, by Application 2019 & 2032
- Table 59: Global Macular Degeneration Treatment Market Revenue Million Forecast, by Country 2019 & 2032
- Table 60: Global Macular Degeneration Treatment Market Volume K Unit Forecast, by Country 2019 & 2032
- Table 61: Brazil Macular Degeneration Treatment Market Revenue (Million) Forecast, by Application 2019 & 2032
- Table 62: Brazil Macular Degeneration Treatment Market Volume (K Unit) Forecast, by Application 2019 & 2032
- Table 63: Argentina Macular Degeneration Treatment Market Revenue (Million) Forecast, by Application 2019 & 2032
- Table 64: Argentina Macular Degeneration Treatment Market Volume (K Unit) Forecast, by Application 2019 & 2032
- Table 65: Rest of South America Macular Degeneration Treatment Market Revenue (Million) Forecast, by Application 2019 & 2032
- Table 66: Rest of South America Macular Degeneration Treatment Market Volume (K Unit) Forecast, by Application 2019 & 2032
- Table 67: Global Macular Degeneration Treatment Market Revenue Million Forecast, by Type 2019 & 2032
- Table 68: Global Macular Degeneration Treatment Market Volume K Unit Forecast, by Type 2019 & 2032
- Table 69: Global Macular Degeneration Treatment Market Revenue Million Forecast, by Stage of Disease 2019 & 2032
- Table 70: Global Macular Degeneration Treatment Market Volume K Unit Forecast, by Stage of Disease 2019 & 2032
- Table 71: Global Macular Degeneration Treatment Market Revenue Million Forecast, by Treatment Type 2019 & 2032
- Table 72: Global Macular Degeneration Treatment Market Volume K Unit Forecast, by Treatment Type 2019 & 2032
- Table 73: Global Macular Degeneration Treatment Market Revenue Million Forecast, by Route of Administration 2019 & 2032
- Table 74: Global Macular Degeneration Treatment Market Volume K Unit Forecast, by Route of Administration 2019 & 2032
- Table 75: Global Macular Degeneration Treatment Market Revenue Million Forecast, by Sales Channel 2019 & 2032
- Table 76: Global Macular Degeneration Treatment Market Volume K Unit Forecast, by Sales Channel 2019 & 2032
- Table 77: Global Macular Degeneration Treatment Market Revenue Million Forecast, by Country 2019 & 2032
- Table 78: Global Macular Degeneration Treatment Market Volume K Unit Forecast, by Country 2019 & 2032
- Table 79: United States Macular Degeneration Treatment Market Revenue (Million) Forecast, by Application 2019 & 2032
- Table 80: United States Macular Degeneration Treatment Market Volume (K Unit) Forecast, by Application 2019 & 2032
- Table 81: Canada Macular Degeneration Treatment Market Revenue (Million) Forecast, by Application 2019 & 2032
- Table 82: Canada Macular Degeneration Treatment Market Volume (K Unit) Forecast, by Application 2019 & 2032
- Table 83: Mexico Macular Degeneration Treatment Market Revenue (Million) Forecast, by Application 2019 & 2032
- Table 84: Mexico Macular Degeneration Treatment Market Volume (K Unit) Forecast, by Application 2019 & 2032
- Table 85: Global Macular Degeneration Treatment Market Revenue Million Forecast, by Type 2019 & 2032
- Table 86: Global Macular Degeneration Treatment Market Volume K Unit Forecast, by Type 2019 & 2032
- Table 87: Global Macular Degeneration Treatment Market Revenue Million Forecast, by Stage of Disease 2019 & 2032
- Table 88: Global Macular Degeneration Treatment Market Volume K Unit Forecast, by Stage of Disease 2019 & 2032
- Table 89: Global Macular Degeneration Treatment Market Revenue Million Forecast, by Treatment Type 2019 & 2032
- Table 90: Global Macular Degeneration Treatment Market Volume K Unit Forecast, by Treatment Type 2019 & 2032
- Table 91: Global Macular Degeneration Treatment Market Revenue Million Forecast, by Route of Administration 2019 & 2032
- Table 92: Global Macular Degeneration Treatment Market Volume K Unit Forecast, by Route of Administration 2019 & 2032
- Table 93: Global Macular Degeneration Treatment Market Revenue Million Forecast, by Sales Channel 2019 & 2032
- Table 94: Global Macular Degeneration Treatment Market Volume K Unit Forecast, by Sales Channel 2019 & 2032
- Table 95: Global Macular Degeneration Treatment Market Revenue Million Forecast, by Country 2019 & 2032
- Table 96: Global Macular Degeneration Treatment Market Volume K Unit Forecast, by Country 2019 & 2032
- Table 97: Germany Macular Degeneration Treatment Market Revenue (Million) Forecast, by Application 2019 & 2032
- Table 98: Germany Macular Degeneration Treatment Market Volume (K Unit) Forecast, by Application 2019 & 2032
- Table 99: United Kingdom Macular Degeneration Treatment Market Revenue (Million) Forecast, by Application 2019 & 2032
- Table 100: United Kingdom Macular Degeneration Treatment Market Volume (K Unit) Forecast, by Application 2019 & 2032
- Table 101: France Macular Degeneration Treatment Market Revenue (Million) Forecast, by Application 2019 & 2032
- Table 102: France Macular Degeneration Treatment Market Volume (K Unit) Forecast, by Application 2019 & 2032
- Table 103: Italy Macular Degeneration Treatment Market Revenue (Million) Forecast, by Application 2019 & 2032
- Table 104: Italy Macular Degeneration Treatment Market Volume (K Unit) Forecast, by Application 2019 & 2032
- Table 105: Spain Macular Degeneration Treatment Market Revenue (Million) Forecast, by Application 2019 & 2032
- Table 106: Spain Macular Degeneration Treatment Market Volume (K Unit) Forecast, by Application 2019 & 2032
- Table 107: Rest of Europe Macular Degeneration Treatment Market Revenue (Million) Forecast, by Application 2019 & 2032
- Table 108: Rest of Europe Macular Degeneration Treatment Market Volume (K Unit) Forecast, by Application 2019 & 2032
- Table 109: Global Macular Degeneration Treatment Market Revenue Million Forecast, by Type 2019 & 2032
- Table 110: Global Macular Degeneration Treatment Market Volume K Unit Forecast, by Type 2019 & 2032
- Table 111: Global Macular Degeneration Treatment Market Revenue Million Forecast, by Stage of Disease 2019 & 2032
- Table 112: Global Macular Degeneration Treatment Market Volume K Unit Forecast, by Stage of Disease 2019 & 2032
- Table 113: Global Macular Degeneration Treatment Market Revenue Million Forecast, by Treatment Type 2019 & 2032
- Table 114: Global Macular Degeneration Treatment Market Volume K Unit Forecast, by Treatment Type 2019 & 2032
- Table 115: Global Macular Degeneration Treatment Market Revenue Million Forecast, by Route of Administration 2019 & 2032
- Table 116: Global Macular Degeneration Treatment Market Volume K Unit Forecast, by Route of Administration 2019 & 2032
- Table 117: Global Macular Degeneration Treatment Market Revenue Million Forecast, by Sales Channel 2019 & 2032
- Table 118: Global Macular Degeneration Treatment Market Volume K Unit Forecast, by Sales Channel 2019 & 2032
- Table 119: Global Macular Degeneration Treatment Market Revenue Million Forecast, by Country 2019 & 2032
- Table 120: Global Macular Degeneration Treatment Market Volume K Unit Forecast, by Country 2019 & 2032
- Table 121: China Macular Degeneration Treatment Market Revenue (Million) Forecast, by Application 2019 & 2032
- Table 122: China Macular Degeneration Treatment Market Volume (K Unit) Forecast, by Application 2019 & 2032
- Table 123: Japan Macular Degeneration Treatment Market Revenue (Million) Forecast, by Application 2019 & 2032
- Table 124: Japan Macular Degeneration Treatment Market Volume (K Unit) Forecast, by Application 2019 & 2032
- Table 125: India Macular Degeneration Treatment Market Revenue (Million) Forecast, by Application 2019 & 2032
- Table 126: India Macular Degeneration Treatment Market Volume (K Unit) Forecast, by Application 2019 & 2032
- Table 127: Australia Macular Degeneration Treatment Market Revenue (Million) Forecast, by Application 2019 & 2032
- Table 128: Australia Macular Degeneration Treatment Market Volume (K Unit) Forecast, by Application 2019 & 2032
- Table 129: South Korea Macular Degeneration Treatment Market Revenue (Million) Forecast, by Application 2019 & 2032
- Table 130: South Korea Macular Degeneration Treatment Market Volume (K Unit) Forecast, by Application 2019 & 2032
- Table 131: Rest of Asia Pacific Macular Degeneration Treatment Market Revenue (Million) Forecast, by Application 2019 & 2032
- Table 132: Rest of Asia Pacific Macular Degeneration Treatment Market Volume (K Unit) Forecast, by Application 2019 & 2032
- Table 133: Global Macular Degeneration Treatment Market Revenue Million Forecast, by Type 2019 & 2032
- Table 134: Global Macular Degeneration Treatment Market Volume K Unit Forecast, by Type 2019 & 2032
- Table 135: Global Macular Degeneration Treatment Market Revenue Million Forecast, by Stage of Disease 2019 & 2032
- Table 136: Global Macular Degeneration Treatment Market Volume K Unit Forecast, by Stage of Disease 2019 & 2032
- Table 137: Global Macular Degeneration Treatment Market Revenue Million Forecast, by Treatment Type 2019 & 2032
- Table 138: Global Macular Degeneration Treatment Market Volume K Unit Forecast, by Treatment Type 2019 & 2032
- Table 139: Global Macular Degeneration Treatment Market Revenue Million Forecast, by Route of Administration 2019 & 2032
- Table 140: Global Macular Degeneration Treatment Market Volume K Unit Forecast, by Route of Administration 2019 & 2032
- Table 141: Global Macular Degeneration Treatment Market Revenue Million Forecast, by Sales Channel 2019 & 2032
- Table 142: Global Macular Degeneration Treatment Market Volume K Unit Forecast, by Sales Channel 2019 & 2032
- Table 143: Global Macular Degeneration Treatment Market Revenue Million Forecast, by Country 2019 & 2032
- Table 144: Global Macular Degeneration Treatment Market Volume K Unit Forecast, by Country 2019 & 2032
- Table 145: GCC Macular Degeneration Treatment Market Revenue (Million) Forecast, by Application 2019 & 2032
- Table 146: GCC Macular Degeneration Treatment Market Volume (K Unit) Forecast, by Application 2019 & 2032
- Table 147: South Africa Macular Degeneration Treatment Market Revenue (Million) Forecast, by Application 2019 & 2032
- Table 148: South Africa Macular Degeneration Treatment Market Volume (K Unit) Forecast, by Application 2019 & 2032
- Table 149: Rest of Middle East and Africa Macular Degeneration Treatment Market Revenue (Million) Forecast, by Application 2019 & 2032
- Table 150: Rest of Middle East and Africa Macular Degeneration Treatment Market Volume (K Unit) Forecast, by Application 2019 & 2032
- Table 151: Global Macular Degeneration Treatment Market Revenue Million Forecast, by Type 2019 & 2032
- Table 152: Global Macular Degeneration Treatment Market Volume K Unit Forecast, by Type 2019 & 2032
- Table 153: Global Macular Degeneration Treatment Market Revenue Million Forecast, by Stage of Disease 2019 & 2032
- Table 154: Global Macular Degeneration Treatment Market Volume K Unit Forecast, by Stage of Disease 2019 & 2032
- Table 155: Global Macular Degeneration Treatment Market Revenue Million Forecast, by Treatment Type 2019 & 2032
- Table 156: Global Macular Degeneration Treatment Market Volume K Unit Forecast, by Treatment Type 2019 & 2032
- Table 157: Global Macular Degeneration Treatment Market Revenue Million Forecast, by Route of Administration 2019 & 2032
- Table 158: Global Macular Degeneration Treatment Market Volume K Unit Forecast, by Route of Administration 2019 & 2032
- Table 159: Global Macular Degeneration Treatment Market Revenue Million Forecast, by Sales Channel 2019 & 2032
- Table 160: Global Macular Degeneration Treatment Market Volume K Unit Forecast, by Sales Channel 2019 & 2032
- Table 161: Global Macular Degeneration Treatment Market Revenue Million Forecast, by Country 2019 & 2032
- Table 162: Global Macular Degeneration Treatment Market Volume K Unit Forecast, by Country 2019 & 2032
- Table 163: Brazil Macular Degeneration Treatment Market Revenue (Million) Forecast, by Application 2019 & 2032
- Table 164: Brazil Macular Degeneration Treatment Market Volume (K Unit) Forecast, by Application 2019 & 2032
- Table 165: Argentina Macular Degeneration Treatment Market Revenue (Million) Forecast, by Application 2019 & 2032
- Table 166: Argentina Macular Degeneration Treatment Market Volume (K Unit) Forecast, by Application 2019 & 2032
- Table 167: Rest of South America Macular Degeneration Treatment Market Revenue (Million) Forecast, by Application 2019 & 2032
- Table 168: Rest of South America Macular Degeneration Treatment Market Volume (K Unit) Forecast, by Application 2019 & 2032
Frequently Asked Questions
1. What is the projected Compound Annual Growth Rate (CAGR) of the Macular Degeneration Treatment Market?
The projected CAGR is approximately 8.51%.
2. Which companies are prominent players in the Macular Degeneration Treatment Market?
Key companies in the market include REGENXBIO Inc, Regeneron Pharmaceuticals Inc, Bayer AG, Novartis AG, Lineage Cell Therapeutics, Panoptica, Oxurion, F Hoffmann-La Roche Ltd, Clover Therapeutics, Aerie Pharmaceutical Inc, ONL Therapeutics, MeiraGTx, Ocugen Inc, Bausch Health Companies Inc, Pfizer Inc.
3. What are the main segments of the Macular Degeneration Treatment Market?
The market segments include Type, Stage of Disease, Treatment Type, Route of Administration, Sales Channel.
4. Can you provide details about the market size?
The market size is estimated to be USD 15.47 Million as of 2022.
5. What are some drivers contributing to market growth?
Increasing Burden of Retinal Disorders; Upsurge in the Geriatric Population; Increase in Research and Development Investments.
6. What are the notable trends driving market growth?
Wet Age-related Macular Degeneration is Expected to Hold Significant Market Share Over the Forecast Period.
7. Are there any restraints impacting market growth?
Increasing Use of Off-label Drugs; Lack of Awareness Regarding AMD.
8. Can you provide examples of recent developments in the market?
In November 2022, IVERIC bio, Inc. submitted the first part of its NDA to the US FDA for a rolling review of avacincaptad pegol a novel investigational complement C5 inhibitor, for the treatment of geographic atrophy (GA) secondary to Age-Related Macular Degeneration (AMD).
9. What pricing options are available for accessing the report?
Pricing options include single-user, multi-user, and enterprise licenses priced at USD 4750, USD 5250, and USD 8750 respectively.
10. Is the market size provided in terms of value or volume?
The market size is provided in terms of value, measured in Million and volume, measured in K Unit.
11. Are there any specific market keywords associated with the report?
Yes, the market keyword associated with the report is "Macular Degeneration Treatment Market," which aids in identifying and referencing the specific market segment covered.
12. How do I determine which pricing option suits my needs best?
The pricing options vary based on user requirements and access needs. Individual users may opt for single-user licenses, while businesses requiring broader access may choose multi-user or enterprise licenses for cost-effective access to the report.
13. Are there any additional resources or data provided in the Macular Degeneration Treatment Market report?
While the report offers comprehensive insights, it's advisable to review the specific contents or supplementary materials provided to ascertain if additional resources or data are available.
14. How can I stay updated on further developments or reports in the Macular Degeneration Treatment Market?
To stay informed about further developments, trends, and reports in the Macular Degeneration Treatment Market, consider subscribing to industry newsletters, following relevant companies and organizations, or regularly checking reputable industry news sources and publications.
Methodology
Step 1 - Identification of Relevant Samples Size from Population Database


Step 2 - Approaches for Defining Global Market Size (Value, Volume* & Price*)

Note*: In applicable scenarios
Step 3 - Data Sources
Primary Research
- Web Analytics
- Survey Reports
- Research Institute
- Latest Research Reports
- Opinion Leaders
Secondary Research
- Annual Reports
- White Paper
- Latest Press Release
- Industry Association
- Paid Database
- Investor Presentations

Step 4 - Data Triangulation
Involves using different sources of information in order to increase the validity of a study
These sources are likely to be stakeholders in a program - participants, other researchers, program staff, other community members, and so on.
Then we put all data in single framework & apply various statistical tools to find out the dynamic on the market.
During the analysis stage, feedback from the stakeholder groups would be compared to determine areas of agreement as well as areas of divergence


