
Key Insights
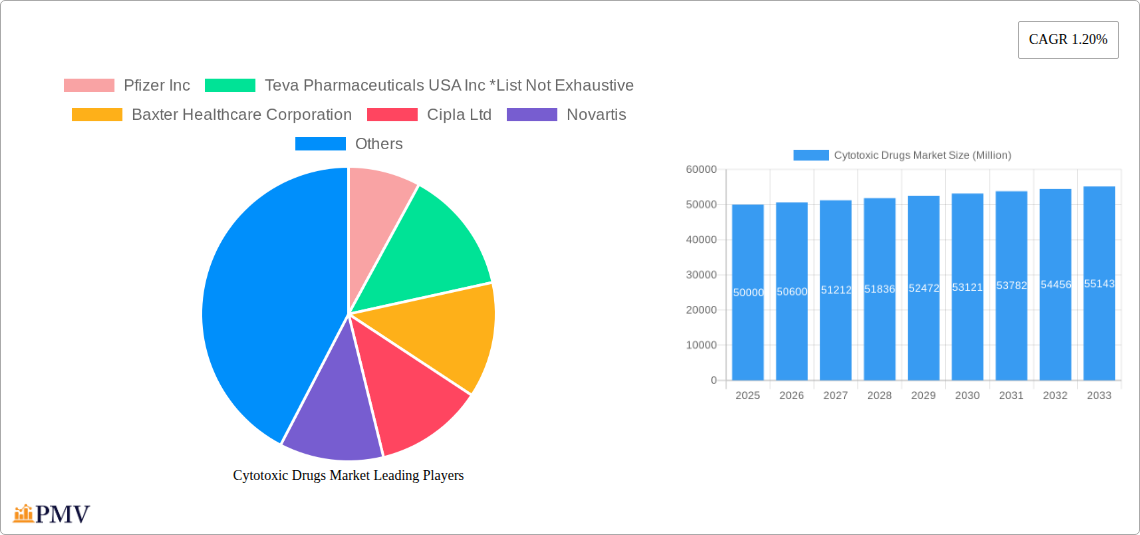
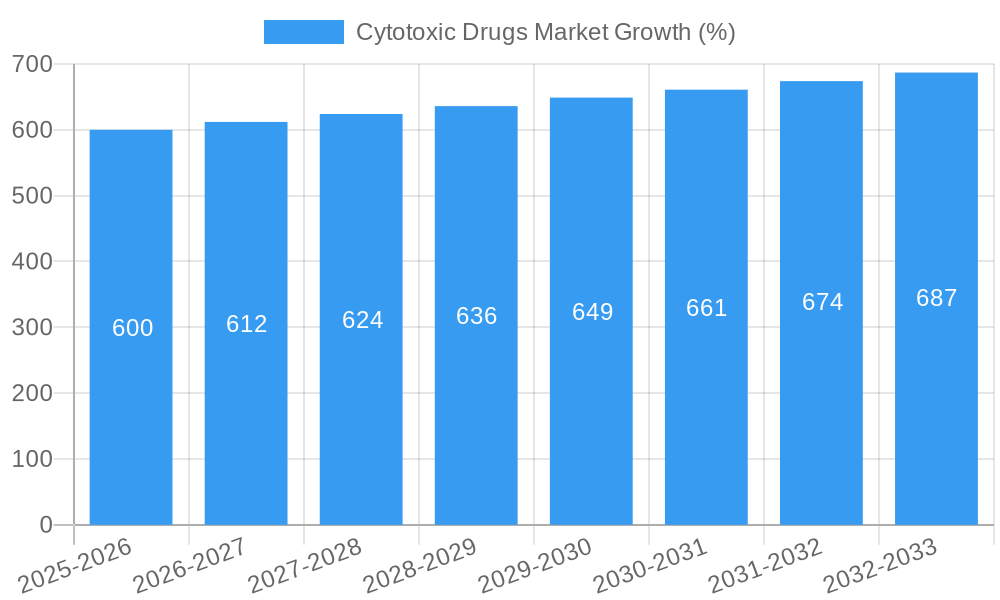
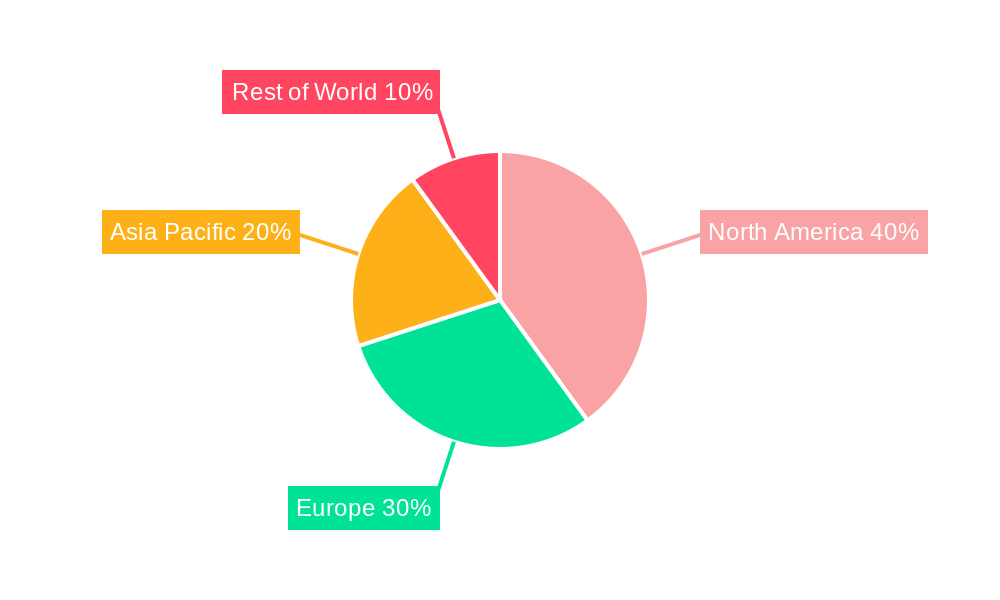
The Cytotoxic Drugs Market, characterized by a Compound Annual Growth Rate (CAGR) of 1.20% from 2019-2024, is poised for continued, albeit moderate, expansion through 2033. This growth is driven by several key factors. The rising incidence of cancers, particularly breast, prostate, and lung cancers, globally fuels demand for effective cytotoxic therapies. Technological advancements leading to the development of targeted cytotoxic agents with improved efficacy and reduced side effects contribute significantly to market expansion. Furthermore, increased investments in oncology research and development by pharmaceutical companies are fostering innovation and broadening the treatment options available, thereby stimulating market growth. However, the market faces certain restraints. The high cost of these drugs coupled with stringent regulatory approvals for new therapies can hinder accessibility and market penetration. Additionally, the development of drug resistance remains a significant challenge, requiring ongoing research into novel treatment strategies. The market is segmented by route of administration (parenteral and oral), drug type (alkylating agents, antitumor antibiotics, antimetabolites, plant alkaloids, and others), and application (breast, prostate, lung, pancreatic, and other cancers). The parenteral route currently dominates due to its effectiveness in delivering higher drug concentrations directly to the tumor site. However, oral administration is gaining traction due to improved patient convenience and compliance. The geographical distribution shows a strong market presence in North America and Europe, primarily due to high healthcare expenditure and established oncology infrastructure. However, emerging economies in Asia-Pacific are expected to witness notable growth in the coming years, driven by increasing cancer prevalence and rising healthcare awareness.
The competitive landscape is dominated by major pharmaceutical companies such as Pfizer, Teva, Baxter, Cipla, Novartis, Eli Lilly, Sun Pharmaceuticals, Fresenius Kabi, Mylan, and Johnson & Johnson, amongst others. These companies are engaged in intense research and development, focusing on novel cytotoxic drug development, strategic partnerships, and mergers and acquisitions to strengthen their market position. The market's future trajectory will depend on successful clinical trials of novel cytotoxic agents, regulatory approvals, pricing strategies, and the adoption of personalized medicine approaches in cancer treatment. Continued investment in research and development, coupled with effective strategies to address challenges like drug resistance and cost, will be crucial for sustained market growth.
Cytotoxic Drugs Market: A Comprehensive Analysis (2019-2033)
This in-depth report provides a comprehensive analysis of the Cytotoxic Drugs Market, offering invaluable insights into market dynamics, competitive landscapes, and future growth projections. The study period covers 2019-2033, with 2025 serving as the base and estimated year. The forecast period extends from 2025 to 2033, while the historical period encompasses 2019-2024. This report is crucial for stakeholders, including pharmaceutical companies, investors, and healthcare professionals seeking to understand and navigate this dynamic market. The market size in 2025 is estimated at xx Million, projected to reach xx Million by 2033, exhibiting a CAGR of xx%.
Cytotoxic Drugs Market Market Structure & Competitive Dynamics
The Cytotoxic Drugs market exhibits a moderately consolidated structure, with several key players holding significant market share. Pfizer Inc, Teva Pharmaceuticals USA Inc, Baxter Healthcare Corporation, Cipla Ltd, Novartis, Eli Lilly and Company, Sun Pharmaceuticals, Fresenius Kabi AG, Mylan NV, and Johnson & Johnson are among the prominent players, collectively commanding an estimated xx% market share in 2025. The market’s competitive landscape is characterized by intense R&D efforts focused on developing novel drugs with improved efficacy and reduced side effects.
Innovation within the cytotoxic drugs market is primarily driven by the need for targeted therapies and personalized medicine approaches. Stringent regulatory frameworks, including those imposed by agencies like the FDA and EMA, significantly influence product approvals and market entry. The market also witnesses considerable M&A activity, reflecting strategic moves by companies to expand their portfolios and enhance their market positions. Recent M&A deal values have ranged from xx Million to xx Million, primarily driven by the acquisition of promising drug candidates and established market players. Significant end-user trends include a growing preference for targeted therapies, personalized medicine approaches, and a focus on improving patient outcomes and quality of life. Product substitutes, such as immunotherapy and targeted cancer therapies, present a growing challenge to traditional cytotoxic drugs.
Cytotoxic Drugs Market Industry Trends & Insights
The Cytotoxic Drugs market is experiencing significant growth propelled by several key factors. The rising incidence of cancer globally is a major driver, necessitating increased demand for effective treatment options. Technological advancements, including the development of novel drug delivery systems and targeted therapies, contribute significantly to market expansion. Consumer preferences are shifting towards less toxic and more effective treatments with improved patient outcomes. The market's competitive dynamics involve continuous innovation, product differentiation, and strategic partnerships to maintain a competitive edge. The increasing prevalence of various cancers, including breast, lung, and prostate cancers, significantly fuels market expansion. Moreover, favorable reimbursement policies in several regions contribute to the higher adoption of these drugs. The market is also witnessing increased investment in R&D activities, leading to the launch of innovative drugs and improved treatment outcomes. The market's growth is further influenced by factors like rising healthcare expenditure and increasing awareness regarding cancer treatment. The ongoing technological advancements, focused on personalized cancer treatment and targeted drug delivery, significantly drive market growth and innovation.
Dominant Markets & Segments in Cytotoxic Drugs Market
By Route of Administration: The parenteral route dominates the market owing to its superior bioavailability and efficacy in delivering cytotoxic drugs directly to the tumor site. Oral administration remains a significant segment, particularly for certain drug types and specific cancer indications, offering convenience and improved patient compliance.
By Drug Type: Alkylating agents and antimetabolites represent significant segments, demonstrating consistent demand due to their widespread use in various cancer treatments. Antitumor antibiotics and plant alkaloids also hold substantial market shares, although their usage is often more specialized, based on specific cancer types and treatment protocols. Other drug types, comprising newer targeted therapies and immunotherapies, are witnessing significant growth, fuelled by ongoing research and development.
By Application: Breast cancer, lung cancer, and prostate cancer are major application areas for cytotoxic drugs due to their high prevalence and the effectiveness of these drugs in managing these cancers. The pancreatic cancer segment exhibits notable growth potential, driven by research focused on enhancing treatment efficacy. Other applications include a diverse range of cancers, including hematological malignancies, gastrointestinal cancers, and skin cancers. The substantial growth in these segments is influenced by increasing cancer incidence, expanding treatment options, and supportive regulatory environments. Economic factors, including healthcare spending patterns, and advancements in healthcare infrastructure also play significant roles in regional dominance. The developed economies in North America and Europe currently hold a significant share of the market. However, emerging markets are expected to experience rapid growth in the coming years due to increasing healthcare expenditure and improving healthcare infrastructure.
Cytotoxic Drugs Market Product Innovations
Recent product innovations focus on developing targeted therapies with enhanced efficacy and reduced side effects, such as antibody-drug conjugates (ADCs) and other targeted drug delivery systems. These advancements address the limitations of traditional cytotoxic drugs, thereby improving patient outcomes and quality of life. The emphasis on personalized medicine further shapes product innovation, tailoring treatment regimens based on individual patient characteristics and genetic profiles. This trend enhances the market fit for newly developed drugs and maximizes therapeutic benefits while minimizing adverse effects.
Report Segmentation & Scope
This report provides a detailed segmentation of the Cytotoxic Drugs market across multiple parameters:
By Route of Administration: Parenteral and Oral, each segment analyzed for market size, growth projections, and competitive dynamics.
By Drug Type: Alkylating Agents, Antitumor Antibiotics, Antimetabolites, Plant Alkaloids, and Other Drug Types, each analyzed for its individual market characteristics and growth trajectories.
By Application: Breast Cancer, Prostate Cancer, Lung Cancer, Pancreatic Cancer, and Other Applications, each detailing market size, growth prospects, and competitive landscape. Each segment’s analysis incorporates market size, growth projections, competitive dynamics, and key influencing factors.
Key Drivers of Cytotoxic Drugs Market Growth
The cytotoxic drugs market is driven by several key factors: a rising global cancer incidence rate, continuous advancements in drug development and targeted therapies, and increasing healthcare spending globally. Favorable reimbursement policies in several regions also contribute to higher drug adoption. Moreover, growing awareness of cancer treatment options and improved healthcare infrastructure further enhance market expansion.
Challenges in the Cytotoxic Drugs Market Sector
The market faces challenges such as stringent regulatory requirements for drug approvals, potential supply chain disruptions, and the emergence of competing treatment modalities, including immunotherapy and targeted therapies. These challenges can impact market growth and profitability, requiring manufacturers to strategically address these issues to maintain competitiveness. The development of drug resistance also poses a significant challenge, necessitating the development of new treatment strategies and drugs.
Leading Players in the Cytotoxic Drugs Market Market
- Pfizer Inc
- Teva Pharmaceuticals USA Inc
- Baxter Healthcare Corporation
- Cipla Ltd
- Novartis
- Eli Lilly and Company
- Sun Pharmaceuticals
- Fresenius Kabi AG
- Mylan NV
- Johnson & Johnson
Key Developments in Cytotoxic Drugs Market Sector
- 2022-Q4: Launch of a new targeted therapy by Pfizer Inc.
- 2023-Q1: Acquisition of a smaller biotech company by Novartis, expanding their cytotoxic drug portfolio.
- 2023-Q3: FDA approval of a novel alkylating agent.
- 2024-Q2: Strategic partnership between Teva Pharmaceuticals and a research institute for collaborative R&D. (Further developments to be added as available)
Strategic Cytotoxic Drugs Market Market Outlook
The Cytotoxic Drugs market presents significant opportunities for growth in the coming years. The continued rise in cancer incidence, coupled with ongoing advancements in targeted therapies and personalized medicine, will fuel demand for innovative and effective treatments. Strategic investments in R&D, focusing on overcoming drug resistance and minimizing adverse effects, will be crucial for sustaining growth. Companies that successfully leverage these opportunities and adapt to the evolving regulatory landscape will be well-positioned to succeed in this dynamic market.
Cytotoxic Drugs Market Segmentation
-
1. Route of Administration
- 1.1. Parenteral
- 1.2. Oral
-
2. Drug Type
- 2.1. Alkylating Agents
- 2.2. Antitumor Antibiotics
- 2.3. Antimetabolites
- 2.4. Plant Alkaloids
- 2.5. Other Drug Types
-
3. Application
- 3.1. Breast Cancer
- 3.2. Prostate Cancer
- 3.3. Lung Cancer
- 3.4. Pancreatic Cancer
- 3.5. Other Applications
Cytotoxic Drugs Market Segmentation By Geography
-
1. North America
- 1.1. United States
- 1.2. Canada
- 1.3. Mexico
-
2. Europe
- 2.1. Germany
- 2.2. United Kingdom
- 2.3. France
- 2.4. Italy
- 2.5. Spain
- 2.6. Rest of Europe
-
3. Asia Pacific
- 3.1. China
- 3.2. Japan
- 3.3. India
- 3.4. Australia
- 3.5. South Korea
- 3.6. Rest of Asia Pacific
- 4. Middle East
-
5. GCC
- 5.1. South Africa
- 5.2. Rest of Middle East
-
6. South America
- 6.1. Brazil
- 6.2. Argentina
- 6.3. Rest of South America
Cytotoxic Drugs Market REPORT HIGHLIGHTS
| Aspects | Details |
|---|---|
| Study Period | 2019-2033 |
| Base Year | 2024 |
| Estimated Year | 2025 |
| Forecast Period | 2025-2033 |
| Historical Period | 2019-2024 |
| Growth Rate | CAGR of 1.20% from 2019-2033 |
| Segmentation |
|
Table of Contents
- 1. Introduction
- 1.1. Research Scope
- 1.2. Market Segmentation
- 1.3. Research Methodology
- 1.4. Definitions and Assumptions
- 2. Executive Summary
- 2.1. Introduction
- 3. Market Dynamics
- 3.1. Introduction
- 3.2. Market Drivers
- 3.2.1. ; Increased Incidence of Target Disease; Supportive Government Legislation; Strong R&D Initiatives from Key Players
- 3.3. Market Restrains
- 3.3.1. ; Complications Associated with Cytotoxic Drugs; High Cost of Cytotoxic Cancer Drugs
- 3.4. Market Trends
- 3.4.1. The Breast Cancer Segment Is Anticipated To Expand At The Fastest CAGR And Is Expected To Continue The Same During The Forecast Period
- 4. Market Factor Analysis
- 4.1. Porters Five Forces
- 4.2. Supply/Value Chain
- 4.3. PESTEL analysis
- 4.4. Market Entropy
- 4.5. Patent/Trademark Analysis
- 5. Global Cytotoxic Drugs Market Analysis, Insights and Forecast, 2019-2031
- 5.1. Market Analysis, Insights and Forecast - by Route of Administration
- 5.1.1. Parenteral
- 5.1.2. Oral
- 5.2. Market Analysis, Insights and Forecast - by Drug Type
- 5.2.1. Alkylating Agents
- 5.2.2. Antitumor Antibiotics
- 5.2.3. Antimetabolites
- 5.2.4. Plant Alkaloids
- 5.2.5. Other Drug Types
- 5.3. Market Analysis, Insights and Forecast - by Application
- 5.3.1. Breast Cancer
- 5.3.2. Prostate Cancer
- 5.3.3. Lung Cancer
- 5.3.4. Pancreatic Cancer
- 5.3.5. Other Applications
- 5.4. Market Analysis, Insights and Forecast - by Region
- 5.4.1. North America
- 5.4.2. Europe
- 5.4.3. Asia Pacific
- 5.4.4. Middle East
- 5.4.5. GCC
- 5.4.6. South America
- 5.1. Market Analysis, Insights and Forecast - by Route of Administration
- 6. North America Cytotoxic Drugs Market Analysis, Insights and Forecast, 2019-2031
- 6.1. Market Analysis, Insights and Forecast - by Route of Administration
- 6.1.1. Parenteral
- 6.1.2. Oral
- 6.2. Market Analysis, Insights and Forecast - by Drug Type
- 6.2.1. Alkylating Agents
- 6.2.2. Antitumor Antibiotics
- 6.2.3. Antimetabolites
- 6.2.4. Plant Alkaloids
- 6.2.5. Other Drug Types
- 6.3. Market Analysis, Insights and Forecast - by Application
- 6.3.1. Breast Cancer
- 6.3.2. Prostate Cancer
- 6.3.3. Lung Cancer
- 6.3.4. Pancreatic Cancer
- 6.3.5. Other Applications
- 6.1. Market Analysis, Insights and Forecast - by Route of Administration
- 7. Europe Cytotoxic Drugs Market Analysis, Insights and Forecast, 2019-2031
- 7.1. Market Analysis, Insights and Forecast - by Route of Administration
- 7.1.1. Parenteral
- 7.1.2. Oral
- 7.2. Market Analysis, Insights and Forecast - by Drug Type
- 7.2.1. Alkylating Agents
- 7.2.2. Antitumor Antibiotics
- 7.2.3. Antimetabolites
- 7.2.4. Plant Alkaloids
- 7.2.5. Other Drug Types
- 7.3. Market Analysis, Insights and Forecast - by Application
- 7.3.1. Breast Cancer
- 7.3.2. Prostate Cancer
- 7.3.3. Lung Cancer
- 7.3.4. Pancreatic Cancer
- 7.3.5. Other Applications
- 7.1. Market Analysis, Insights and Forecast - by Route of Administration
- 8. Asia Pacific Cytotoxic Drugs Market Analysis, Insights and Forecast, 2019-2031
- 8.1. Market Analysis, Insights and Forecast - by Route of Administration
- 8.1.1. Parenteral
- 8.1.2. Oral
- 8.2. Market Analysis, Insights and Forecast - by Drug Type
- 8.2.1. Alkylating Agents
- 8.2.2. Antitumor Antibiotics
- 8.2.3. Antimetabolites
- 8.2.4. Plant Alkaloids
- 8.2.5. Other Drug Types
- 8.3. Market Analysis, Insights and Forecast - by Application
- 8.3.1. Breast Cancer
- 8.3.2. Prostate Cancer
- 8.3.3. Lung Cancer
- 8.3.4. Pancreatic Cancer
- 8.3.5. Other Applications
- 8.1. Market Analysis, Insights and Forecast - by Route of Administration
- 9. Middle East Cytotoxic Drugs Market Analysis, Insights and Forecast, 2019-2031
- 9.1. Market Analysis, Insights and Forecast - by Route of Administration
- 9.1.1. Parenteral
- 9.1.2. Oral
- 9.2. Market Analysis, Insights and Forecast - by Drug Type
- 9.2.1. Alkylating Agents
- 9.2.2. Antitumor Antibiotics
- 9.2.3. Antimetabolites
- 9.2.4. Plant Alkaloids
- 9.2.5. Other Drug Types
- 9.3. Market Analysis, Insights and Forecast - by Application
- 9.3.1. Breast Cancer
- 9.3.2. Prostate Cancer
- 9.3.3. Lung Cancer
- 9.3.4. Pancreatic Cancer
- 9.3.5. Other Applications
- 9.1. Market Analysis, Insights and Forecast - by Route of Administration
- 10. GCC Cytotoxic Drugs Market Analysis, Insights and Forecast, 2019-2031
- 10.1. Market Analysis, Insights and Forecast - by Route of Administration
- 10.1.1. Parenteral
- 10.1.2. Oral
- 10.2. Market Analysis, Insights and Forecast - by Drug Type
- 10.2.1. Alkylating Agents
- 10.2.2. Antitumor Antibiotics
- 10.2.3. Antimetabolites
- 10.2.4. Plant Alkaloids
- 10.2.5. Other Drug Types
- 10.3. Market Analysis, Insights and Forecast - by Application
- 10.3.1. Breast Cancer
- 10.3.2. Prostate Cancer
- 10.3.3. Lung Cancer
- 10.3.4. Pancreatic Cancer
- 10.3.5. Other Applications
- 10.1. Market Analysis, Insights and Forecast - by Route of Administration
- 11. South America Cytotoxic Drugs Market Analysis, Insights and Forecast, 2019-2031
- 11.1. Market Analysis, Insights and Forecast - by Route of Administration
- 11.1.1. Parenteral
- 11.1.2. Oral
- 11.2. Market Analysis, Insights and Forecast - by Drug Type
- 11.2.1. Alkylating Agents
- 11.2.2. Antitumor Antibiotics
- 11.2.3. Antimetabolites
- 11.2.4. Plant Alkaloids
- 11.2.5. Other Drug Types
- 11.3. Market Analysis, Insights and Forecast - by Application
- 11.3.1. Breast Cancer
- 11.3.2. Prostate Cancer
- 11.3.3. Lung Cancer
- 11.3.4. Pancreatic Cancer
- 11.3.5. Other Applications
- 11.1. Market Analysis, Insights and Forecast - by Route of Administration
- 12. North America Cytotoxic Drugs Market Analysis, Insights and Forecast, 2019-2031
- 12.1. Market Analysis, Insights and Forecast - By Country/Sub-region
- 12.1.1 United States
- 12.1.2 Canada
- 12.1.3 Mexico
- 13. Europe Cytotoxic Drugs Market Analysis, Insights and Forecast, 2019-2031
- 13.1. Market Analysis, Insights and Forecast - By Country/Sub-region
- 13.1.1 Germany
- 13.1.2 United Kingdom
- 13.1.3 France
- 13.1.4 Italy
- 13.1.5 Spain
- 13.1.6 Rest of Europe
- 14. Asia Pacific Cytotoxic Drugs Market Analysis, Insights and Forecast, 2019-2031
- 14.1. Market Analysis, Insights and Forecast - By Country/Sub-region
- 14.1.1 China
- 14.1.2 Japan
- 14.1.3 India
- 14.1.4 Australia
- 14.1.5 South Korea
- 14.1.6 Rest of Asia Pacific
- 15. Middle East Cytotoxic Drugs Market Analysis, Insights and Forecast, 2019-2031
- 15.1. Market Analysis, Insights and Forecast - By Country/Sub-region
- 15.1.1.
- 16. GCC Cytotoxic Drugs Market Analysis, Insights and Forecast, 2019-2031
- 16.1. Market Analysis, Insights and Forecast - By Country/Sub-region
- 16.1.1 South Africa
- 16.1.2 Rest of Middle East
- 17. South America Cytotoxic Drugs Market Analysis, Insights and Forecast, 2019-2031
- 17.1. Market Analysis, Insights and Forecast - By Country/Sub-region
- 17.1.1 Brazil
- 17.1.2 Argentina
- 17.1.3 Rest of South America
- 18. Competitive Analysis
- 18.1. Global Market Share Analysis 2024
- 18.2. Company Profiles
- 18.2.1 Pfizer Inc
- 18.2.1.1. Overview
- 18.2.1.2. Products
- 18.2.1.3. SWOT Analysis
- 18.2.1.4. Recent Developments
- 18.2.1.5. Financials (Based on Availability)
- 18.2.2 Teva Pharmaceuticals USA Inc *List Not Exhaustive
- 18.2.2.1. Overview
- 18.2.2.2. Products
- 18.2.2.3. SWOT Analysis
- 18.2.2.4. Recent Developments
- 18.2.2.5. Financials (Based on Availability)
- 18.2.3 Baxter Healthcare Corporation
- 18.2.3.1. Overview
- 18.2.3.2. Products
- 18.2.3.3. SWOT Analysis
- 18.2.3.4. Recent Developments
- 18.2.3.5. Financials (Based on Availability)
- 18.2.4 Cipla Ltd
- 18.2.4.1. Overview
- 18.2.4.2. Products
- 18.2.4.3. SWOT Analysis
- 18.2.4.4. Recent Developments
- 18.2.4.5. Financials (Based on Availability)
- 18.2.5 Novartis
- 18.2.5.1. Overview
- 18.2.5.2. Products
- 18.2.5.3. SWOT Analysis
- 18.2.5.4. Recent Developments
- 18.2.5.5. Financials (Based on Availability)
- 18.2.6 Eli Lilly and Company
- 18.2.6.1. Overview
- 18.2.6.2. Products
- 18.2.6.3. SWOT Analysis
- 18.2.6.4. Recent Developments
- 18.2.6.5. Financials (Based on Availability)
- 18.2.7 Sun Pharmaceuticals
- 18.2.7.1. Overview
- 18.2.7.2. Products
- 18.2.7.3. SWOT Analysis
- 18.2.7.4. Recent Developments
- 18.2.7.5. Financials (Based on Availability)
- 18.2.8 Fresenius Kabi AG
- 18.2.8.1. Overview
- 18.2.8.2. Products
- 18.2.8.3. SWOT Analysis
- 18.2.8.4. Recent Developments
- 18.2.8.5. Financials (Based on Availability)
- 18.2.9 Mylan NV
- 18.2.9.1. Overview
- 18.2.9.2. Products
- 18.2.9.3. SWOT Analysis
- 18.2.9.4. Recent Developments
- 18.2.9.5. Financials (Based on Availability)
- 18.2.10 Johnson & Johnson
- 18.2.10.1. Overview
- 18.2.10.2. Products
- 18.2.10.3. SWOT Analysis
- 18.2.10.4. Recent Developments
- 18.2.10.5. Financials (Based on Availability)
- 18.2.1 Pfizer Inc
List of Figures
- Figure 1: Global Cytotoxic Drugs Market Revenue Breakdown (Million, %) by Region 2024 & 2032
- Figure 2: North America Cytotoxic Drugs Market Revenue (Million), by Country 2024 & 2032
- Figure 3: North America Cytotoxic Drugs Market Revenue Share (%), by Country 2024 & 2032
- Figure 4: Europe Cytotoxic Drugs Market Revenue (Million), by Country 2024 & 2032
- Figure 5: Europe Cytotoxic Drugs Market Revenue Share (%), by Country 2024 & 2032
- Figure 6: Asia Pacific Cytotoxic Drugs Market Revenue (Million), by Country 2024 & 2032
- Figure 7: Asia Pacific Cytotoxic Drugs Market Revenue Share (%), by Country 2024 & 2032
- Figure 8: Middle East Cytotoxic Drugs Market Revenue (Million), by Country 2024 & 2032
- Figure 9: Middle East Cytotoxic Drugs Market Revenue Share (%), by Country 2024 & 2032
- Figure 10: GCC Cytotoxic Drugs Market Revenue (Million), by Country 2024 & 2032
- Figure 11: GCC Cytotoxic Drugs Market Revenue Share (%), by Country 2024 & 2032
- Figure 12: South America Cytotoxic Drugs Market Revenue (Million), by Country 2024 & 2032
- Figure 13: South America Cytotoxic Drugs Market Revenue Share (%), by Country 2024 & 2032
- Figure 14: North America Cytotoxic Drugs Market Revenue (Million), by Route of Administration 2024 & 2032
- Figure 15: North America Cytotoxic Drugs Market Revenue Share (%), by Route of Administration 2024 & 2032
- Figure 16: North America Cytotoxic Drugs Market Revenue (Million), by Drug Type 2024 & 2032
- Figure 17: North America Cytotoxic Drugs Market Revenue Share (%), by Drug Type 2024 & 2032
- Figure 18: North America Cytotoxic Drugs Market Revenue (Million), by Application 2024 & 2032
- Figure 19: North America Cytotoxic Drugs Market Revenue Share (%), by Application 2024 & 2032
- Figure 20: North America Cytotoxic Drugs Market Revenue (Million), by Country 2024 & 2032
- Figure 21: North America Cytotoxic Drugs Market Revenue Share (%), by Country 2024 & 2032
- Figure 22: Europe Cytotoxic Drugs Market Revenue (Million), by Route of Administration 2024 & 2032
- Figure 23: Europe Cytotoxic Drugs Market Revenue Share (%), by Route of Administration 2024 & 2032
- Figure 24: Europe Cytotoxic Drugs Market Revenue (Million), by Drug Type 2024 & 2032
- Figure 25: Europe Cytotoxic Drugs Market Revenue Share (%), by Drug Type 2024 & 2032
- Figure 26: Europe Cytotoxic Drugs Market Revenue (Million), by Application 2024 & 2032
- Figure 27: Europe Cytotoxic Drugs Market Revenue Share (%), by Application 2024 & 2032
- Figure 28: Europe Cytotoxic Drugs Market Revenue (Million), by Country 2024 & 2032
- Figure 29: Europe Cytotoxic Drugs Market Revenue Share (%), by Country 2024 & 2032
- Figure 30: Asia Pacific Cytotoxic Drugs Market Revenue (Million), by Route of Administration 2024 & 2032
- Figure 31: Asia Pacific Cytotoxic Drugs Market Revenue Share (%), by Route of Administration 2024 & 2032
- Figure 32: Asia Pacific Cytotoxic Drugs Market Revenue (Million), by Drug Type 2024 & 2032
- Figure 33: Asia Pacific Cytotoxic Drugs Market Revenue Share (%), by Drug Type 2024 & 2032
- Figure 34: Asia Pacific Cytotoxic Drugs Market Revenue (Million), by Application 2024 & 2032
- Figure 35: Asia Pacific Cytotoxic Drugs Market Revenue Share (%), by Application 2024 & 2032
- Figure 36: Asia Pacific Cytotoxic Drugs Market Revenue (Million), by Country 2024 & 2032
- Figure 37: Asia Pacific Cytotoxic Drugs Market Revenue Share (%), by Country 2024 & 2032
- Figure 38: Middle East Cytotoxic Drugs Market Revenue (Million), by Route of Administration 2024 & 2032
- Figure 39: Middle East Cytotoxic Drugs Market Revenue Share (%), by Route of Administration 2024 & 2032
- Figure 40: Middle East Cytotoxic Drugs Market Revenue (Million), by Drug Type 2024 & 2032
- Figure 41: Middle East Cytotoxic Drugs Market Revenue Share (%), by Drug Type 2024 & 2032
- Figure 42: Middle East Cytotoxic Drugs Market Revenue (Million), by Application 2024 & 2032
- Figure 43: Middle East Cytotoxic Drugs Market Revenue Share (%), by Application 2024 & 2032
- Figure 44: Middle East Cytotoxic Drugs Market Revenue (Million), by Country 2024 & 2032
- Figure 45: Middle East Cytotoxic Drugs Market Revenue Share (%), by Country 2024 & 2032
- Figure 46: GCC Cytotoxic Drugs Market Revenue (Million), by Route of Administration 2024 & 2032
- Figure 47: GCC Cytotoxic Drugs Market Revenue Share (%), by Route of Administration 2024 & 2032
- Figure 48: GCC Cytotoxic Drugs Market Revenue (Million), by Drug Type 2024 & 2032
- Figure 49: GCC Cytotoxic Drugs Market Revenue Share (%), by Drug Type 2024 & 2032
- Figure 50: GCC Cytotoxic Drugs Market Revenue (Million), by Application 2024 & 2032
- Figure 51: GCC Cytotoxic Drugs Market Revenue Share (%), by Application 2024 & 2032
- Figure 52: GCC Cytotoxic Drugs Market Revenue (Million), by Country 2024 & 2032
- Figure 53: GCC Cytotoxic Drugs Market Revenue Share (%), by Country 2024 & 2032
- Figure 54: South America Cytotoxic Drugs Market Revenue (Million), by Route of Administration 2024 & 2032
- Figure 55: South America Cytotoxic Drugs Market Revenue Share (%), by Route of Administration 2024 & 2032
- Figure 56: South America Cytotoxic Drugs Market Revenue (Million), by Drug Type 2024 & 2032
- Figure 57: South America Cytotoxic Drugs Market Revenue Share (%), by Drug Type 2024 & 2032
- Figure 58: South America Cytotoxic Drugs Market Revenue (Million), by Application 2024 & 2032
- Figure 59: South America Cytotoxic Drugs Market Revenue Share (%), by Application 2024 & 2032
- Figure 60: South America Cytotoxic Drugs Market Revenue (Million), by Country 2024 & 2032
- Figure 61: South America Cytotoxic Drugs Market Revenue Share (%), by Country 2024 & 2032
List of Tables
- Table 1: Global Cytotoxic Drugs Market Revenue Million Forecast, by Region 2019 & 2032
- Table 2: Global Cytotoxic Drugs Market Revenue Million Forecast, by Route of Administration 2019 & 2032
- Table 3: Global Cytotoxic Drugs Market Revenue Million Forecast, by Drug Type 2019 & 2032
- Table 4: Global Cytotoxic Drugs Market Revenue Million Forecast, by Application 2019 & 2032
- Table 5: Global Cytotoxic Drugs Market Revenue Million Forecast, by Region 2019 & 2032
- Table 6: Global Cytotoxic Drugs Market Revenue Million Forecast, by Country 2019 & 2032
- Table 7: United States Cytotoxic Drugs Market Revenue (Million) Forecast, by Application 2019 & 2032
- Table 8: Canada Cytotoxic Drugs Market Revenue (Million) Forecast, by Application 2019 & 2032
- Table 9: Mexico Cytotoxic Drugs Market Revenue (Million) Forecast, by Application 2019 & 2032
- Table 10: Global Cytotoxic Drugs Market Revenue Million Forecast, by Country 2019 & 2032
- Table 11: Germany Cytotoxic Drugs Market Revenue (Million) Forecast, by Application 2019 & 2032
- Table 12: United Kingdom Cytotoxic Drugs Market Revenue (Million) Forecast, by Application 2019 & 2032
- Table 13: France Cytotoxic Drugs Market Revenue (Million) Forecast, by Application 2019 & 2032
- Table 14: Italy Cytotoxic Drugs Market Revenue (Million) Forecast, by Application 2019 & 2032
- Table 15: Spain Cytotoxic Drugs Market Revenue (Million) Forecast, by Application 2019 & 2032
- Table 16: Rest of Europe Cytotoxic Drugs Market Revenue (Million) Forecast, by Application 2019 & 2032
- Table 17: Global Cytotoxic Drugs Market Revenue Million Forecast, by Country 2019 & 2032
- Table 18: China Cytotoxic Drugs Market Revenue (Million) Forecast, by Application 2019 & 2032
- Table 19: Japan Cytotoxic Drugs Market Revenue (Million) Forecast, by Application 2019 & 2032
- Table 20: India Cytotoxic Drugs Market Revenue (Million) Forecast, by Application 2019 & 2032
- Table 21: Australia Cytotoxic Drugs Market Revenue (Million) Forecast, by Application 2019 & 2032
- Table 22: South Korea Cytotoxic Drugs Market Revenue (Million) Forecast, by Application 2019 & 2032
- Table 23: Rest of Asia Pacific Cytotoxic Drugs Market Revenue (Million) Forecast, by Application 2019 & 2032
- Table 24: Global Cytotoxic Drugs Market Revenue Million Forecast, by Country 2019 & 2032
- Table 25: Cytotoxic Drugs Market Revenue (Million) Forecast, by Application 2019 & 2032
- Table 26: Global Cytotoxic Drugs Market Revenue Million Forecast, by Country 2019 & 2032
- Table 27: South Africa Cytotoxic Drugs Market Revenue (Million) Forecast, by Application 2019 & 2032
- Table 28: Rest of Middle East Cytotoxic Drugs Market Revenue (Million) Forecast, by Application 2019 & 2032
- Table 29: Global Cytotoxic Drugs Market Revenue Million Forecast, by Country 2019 & 2032
- Table 30: Brazil Cytotoxic Drugs Market Revenue (Million) Forecast, by Application 2019 & 2032
- Table 31: Argentina Cytotoxic Drugs Market Revenue (Million) Forecast, by Application 2019 & 2032
- Table 32: Rest of South America Cytotoxic Drugs Market Revenue (Million) Forecast, by Application 2019 & 2032
- Table 33: Global Cytotoxic Drugs Market Revenue Million Forecast, by Route of Administration 2019 & 2032
- Table 34: Global Cytotoxic Drugs Market Revenue Million Forecast, by Drug Type 2019 & 2032
- Table 35: Global Cytotoxic Drugs Market Revenue Million Forecast, by Application 2019 & 2032
- Table 36: Global Cytotoxic Drugs Market Revenue Million Forecast, by Country 2019 & 2032
- Table 37: United States Cytotoxic Drugs Market Revenue (Million) Forecast, by Application 2019 & 2032
- Table 38: Canada Cytotoxic Drugs Market Revenue (Million) Forecast, by Application 2019 & 2032
- Table 39: Mexico Cytotoxic Drugs Market Revenue (Million) Forecast, by Application 2019 & 2032
- Table 40: Global Cytotoxic Drugs Market Revenue Million Forecast, by Route of Administration 2019 & 2032
- Table 41: Global Cytotoxic Drugs Market Revenue Million Forecast, by Drug Type 2019 & 2032
- Table 42: Global Cytotoxic Drugs Market Revenue Million Forecast, by Application 2019 & 2032
- Table 43: Global Cytotoxic Drugs Market Revenue Million Forecast, by Country 2019 & 2032
- Table 44: Germany Cytotoxic Drugs Market Revenue (Million) Forecast, by Application 2019 & 2032
- Table 45: United Kingdom Cytotoxic Drugs Market Revenue (Million) Forecast, by Application 2019 & 2032
- Table 46: France Cytotoxic Drugs Market Revenue (Million) Forecast, by Application 2019 & 2032
- Table 47: Italy Cytotoxic Drugs Market Revenue (Million) Forecast, by Application 2019 & 2032
- Table 48: Spain Cytotoxic Drugs Market Revenue (Million) Forecast, by Application 2019 & 2032
- Table 49: Rest of Europe Cytotoxic Drugs Market Revenue (Million) Forecast, by Application 2019 & 2032
- Table 50: Global Cytotoxic Drugs Market Revenue Million Forecast, by Route of Administration 2019 & 2032
- Table 51: Global Cytotoxic Drugs Market Revenue Million Forecast, by Drug Type 2019 & 2032
- Table 52: Global Cytotoxic Drugs Market Revenue Million Forecast, by Application 2019 & 2032
- Table 53: Global Cytotoxic Drugs Market Revenue Million Forecast, by Country 2019 & 2032
- Table 54: China Cytotoxic Drugs Market Revenue (Million) Forecast, by Application 2019 & 2032
- Table 55: Japan Cytotoxic Drugs Market Revenue (Million) Forecast, by Application 2019 & 2032
- Table 56: India Cytotoxic Drugs Market Revenue (Million) Forecast, by Application 2019 & 2032
- Table 57: Australia Cytotoxic Drugs Market Revenue (Million) Forecast, by Application 2019 & 2032
- Table 58: South Korea Cytotoxic Drugs Market Revenue (Million) Forecast, by Application 2019 & 2032
- Table 59: Rest of Asia Pacific Cytotoxic Drugs Market Revenue (Million) Forecast, by Application 2019 & 2032
- Table 60: Global Cytotoxic Drugs Market Revenue Million Forecast, by Route of Administration 2019 & 2032
- Table 61: Global Cytotoxic Drugs Market Revenue Million Forecast, by Drug Type 2019 & 2032
- Table 62: Global Cytotoxic Drugs Market Revenue Million Forecast, by Application 2019 & 2032
- Table 63: Global Cytotoxic Drugs Market Revenue Million Forecast, by Country 2019 & 2032
- Table 64: Global Cytotoxic Drugs Market Revenue Million Forecast, by Route of Administration 2019 & 2032
- Table 65: Global Cytotoxic Drugs Market Revenue Million Forecast, by Drug Type 2019 & 2032
- Table 66: Global Cytotoxic Drugs Market Revenue Million Forecast, by Application 2019 & 2032
- Table 67: Global Cytotoxic Drugs Market Revenue Million Forecast, by Country 2019 & 2032
- Table 68: South Africa Cytotoxic Drugs Market Revenue (Million) Forecast, by Application 2019 & 2032
- Table 69: Rest of Middle East Cytotoxic Drugs Market Revenue (Million) Forecast, by Application 2019 & 2032
- Table 70: Global Cytotoxic Drugs Market Revenue Million Forecast, by Route of Administration 2019 & 2032
- Table 71: Global Cytotoxic Drugs Market Revenue Million Forecast, by Drug Type 2019 & 2032
- Table 72: Global Cytotoxic Drugs Market Revenue Million Forecast, by Application 2019 & 2032
- Table 73: Global Cytotoxic Drugs Market Revenue Million Forecast, by Country 2019 & 2032
- Table 74: Brazil Cytotoxic Drugs Market Revenue (Million) Forecast, by Application 2019 & 2032
- Table 75: Argentina Cytotoxic Drugs Market Revenue (Million) Forecast, by Application 2019 & 2032
- Table 76: Rest of South America Cytotoxic Drugs Market Revenue (Million) Forecast, by Application 2019 & 2032
Frequently Asked Questions
1. What is the projected Compound Annual Growth Rate (CAGR) of the Cytotoxic Drugs Market?
The projected CAGR is approximately 1.20%.
2. Which companies are prominent players in the Cytotoxic Drugs Market?
Key companies in the market include Pfizer Inc, Teva Pharmaceuticals USA Inc *List Not Exhaustive, Baxter Healthcare Corporation, Cipla Ltd, Novartis, Eli Lilly and Company, Sun Pharmaceuticals, Fresenius Kabi AG, Mylan NV, Johnson & Johnson.
3. What are the main segments of the Cytotoxic Drugs Market?
The market segments include Route of Administration, Drug Type, Application.
4. Can you provide details about the market size?
The market size is estimated to be USD XX Million as of 2022.
5. What are some drivers contributing to market growth?
; Increased Incidence of Target Disease; Supportive Government Legislation; Strong R&D Initiatives from Key Players.
6. What are the notable trends driving market growth?
The Breast Cancer Segment Is Anticipated To Expand At The Fastest CAGR And Is Expected To Continue The Same During The Forecast Period.
7. Are there any restraints impacting market growth?
; Complications Associated with Cytotoxic Drugs; High Cost of Cytotoxic Cancer Drugs.
8. Can you provide examples of recent developments in the market?
N/A
9. What pricing options are available for accessing the report?
Pricing options include single-user, multi-user, and enterprise licenses priced at USD 4750, USD 5250, and USD 8750 respectively.
10. Is the market size provided in terms of value or volume?
The market size is provided in terms of value, measured in Million.
11. Are there any specific market keywords associated with the report?
Yes, the market keyword associated with the report is "Cytotoxic Drugs Market," which aids in identifying and referencing the specific market segment covered.
12. How do I determine which pricing option suits my needs best?
The pricing options vary based on user requirements and access needs. Individual users may opt for single-user licenses, while businesses requiring broader access may choose multi-user or enterprise licenses for cost-effective access to the report.
13. Are there any additional resources or data provided in the Cytotoxic Drugs Market report?
While the report offers comprehensive insights, it's advisable to review the specific contents or supplementary materials provided to ascertain if additional resources or data are available.
14. How can I stay updated on further developments or reports in the Cytotoxic Drugs Market?
To stay informed about further developments, trends, and reports in the Cytotoxic Drugs Market, consider subscribing to industry newsletters, following relevant companies and organizations, or regularly checking reputable industry news sources and publications.
Methodology
Step 1 - Identification of Relevant Samples Size from Population Database


Step 2 - Approaches for Defining Global Market Size (Value, Volume* & Price*)

Note*: In applicable scenarios
Step 3 - Data Sources
Primary Research
- Web Analytics
- Survey Reports
- Research Institute
- Latest Research Reports
- Opinion Leaders
Secondary Research
- Annual Reports
- White Paper
- Latest Press Release
- Industry Association
- Paid Database
- Investor Presentations

Step 4 - Data Triangulation
Involves using different sources of information in order to increase the validity of a study
These sources are likely to be stakeholders in a program - participants, other researchers, program staff, other community members, and so on.
Then we put all data in single framework & apply various statistical tools to find out the dynamic on the market.
During the analysis stage, feedback from the stakeholder groups would be compared to determine areas of agreement as well as areas of divergence


