
Key Insights
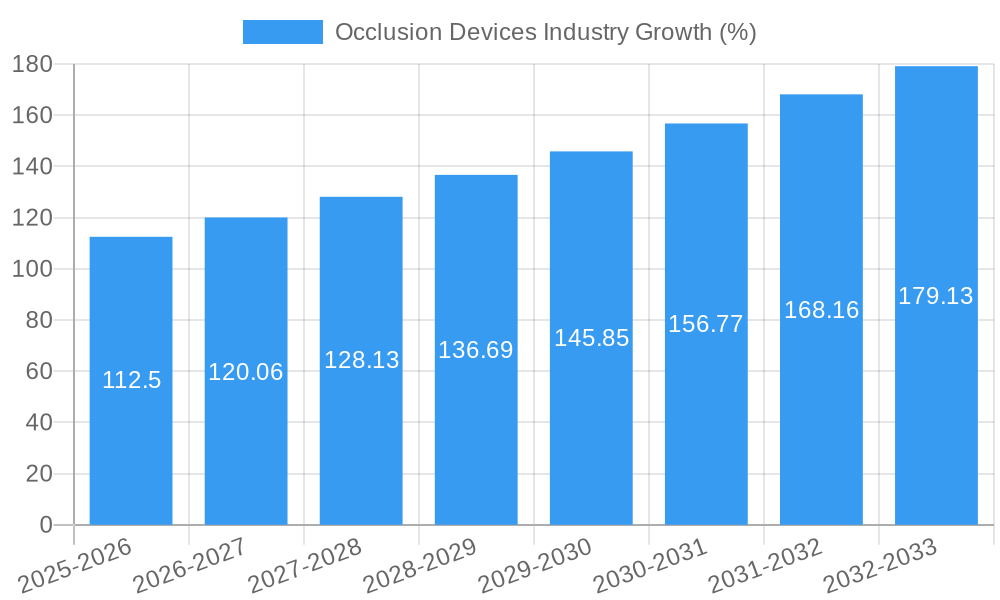
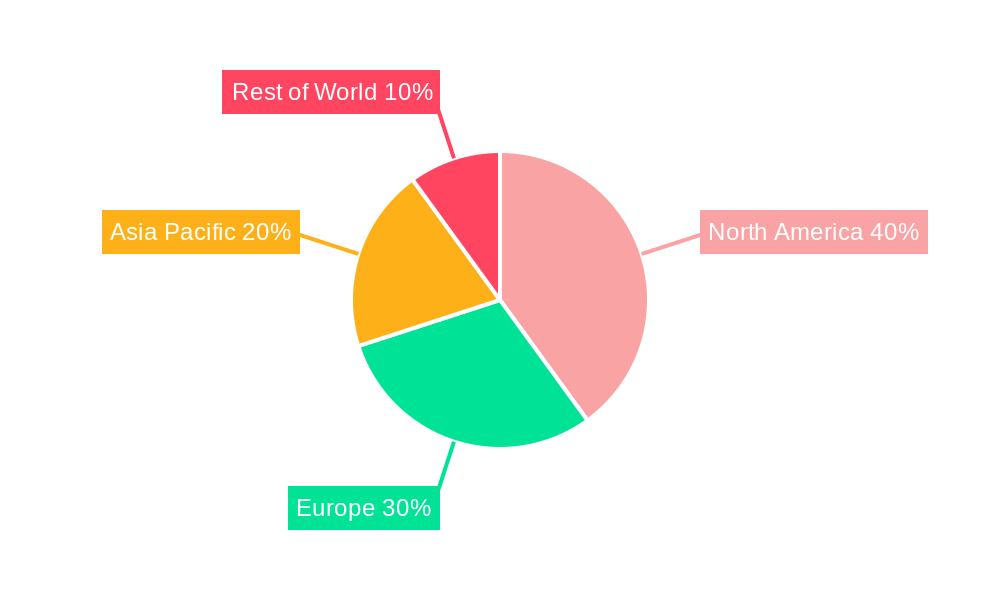
The global occlusion removal devices market is experiencing robust growth, driven by the rising prevalence of cardiovascular diseases, neurological disorders, and cancer, leading to increased demand for effective treatment solutions. The market's Compound Annual Growth Rate (CAGR) of 7.50% from 2019-2033 indicates a significant expansion, projected to reach a substantial market value by 2033. This growth is fueled by advancements in minimally invasive procedures, the development of sophisticated embolization and support devices, and the increasing adoption of occlusion removal devices across various applications, including peripheral vascular disease, neurology, oncology, and urology. Key players like Merit Medical Systems, Edwards Lifesciences, and Medtronic are driving innovation and market expansion through continuous research and development, strategic partnerships, and geographical expansion. The market segmentation reveals a significant contribution from peripheral vascular disease applications, followed by neurology and oncology, reflecting the high incidence of these conditions globally. Hospitals and ambulatory surgical centers constitute the major end-users, contributing to the majority of market revenue due to their higher procedure volumes and advanced infrastructure. While geographical variations exist, North America and Europe currently hold substantial market shares due to the advanced healthcare infrastructure and higher adoption rates. However, Asia-Pacific is expected to witness significant growth in the coming years, driven by increasing healthcare spending and rising awareness of advanced medical interventions.
The market, however, faces certain restraints. High costs associated with these devices and procedures can limit accessibility, particularly in developing economies. Stringent regulatory approvals and the potential for complications associated with these procedures also pose challenges to market growth. Nevertheless, continuous advancements in technology, coupled with the development of more cost-effective solutions and improved reimbursement policies, are expected to mitigate these challenges and further propel market expansion. The focus on improving patient outcomes, reducing procedural risks, and enhancing the overall efficacy of occlusion removal treatments will remain central to future market growth. The competitive landscape, characterized by a mix of established players and emerging companies, will continue to drive innovation and diversification within the market.
Occlusion Devices Industry: Market Analysis and Forecast (2019-2033)
This comprehensive report provides a detailed analysis of the global Occlusion Devices market, offering invaluable insights for stakeholders, investors, and industry professionals. The study period covers 2019-2033, with 2025 as the base and estimated year, and a forecast period of 2025-2033. The historical period analyzed is 2019-2024. The market is segmented by product (Occlusion Removal Devices, Embolization Devices, Support Devices), application (Peripheral Vascular Disease, Neurology, Oncology, Urology, Other Applications), and end-user (Hospitals, Ambulatory Surgical Centers, Other End Users). Key players like Merit Medical Systems, Edwards Lifesciences Corporation, and Medtronic PLC are analyzed for their market share, strategies, and competitive landscape. The report projects a market value exceeding xx Million by 2033, presenting significant growth opportunities.
Occlusion Devices Industry Market Structure & Competitive Dynamics
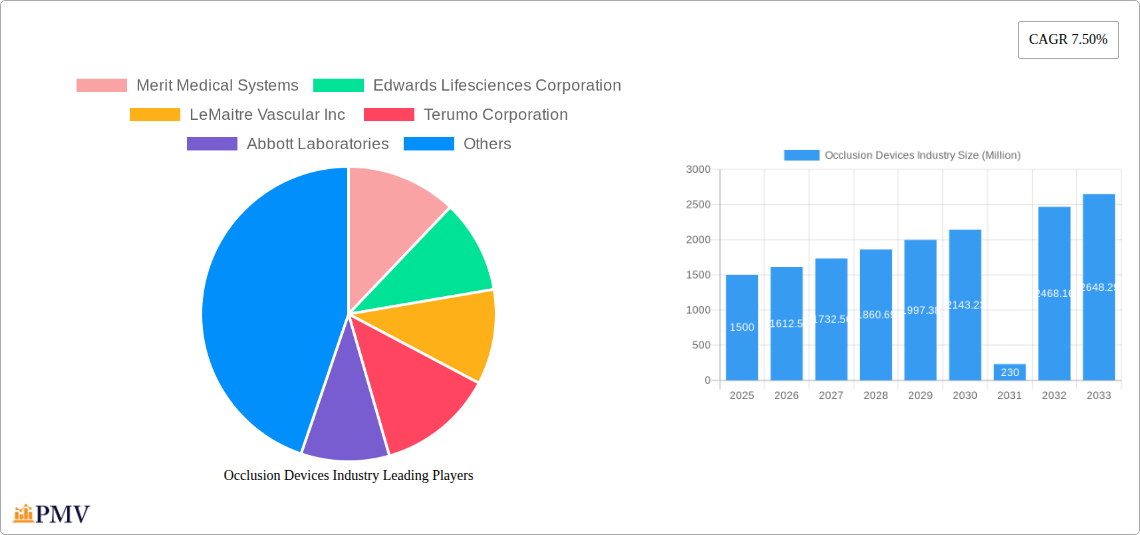
The Occlusion Devices market exhibits a moderately concentrated structure, with a few major players holding significant market share. Merit Medical Systems, Edwards Lifesciences Corporation, and Medtronic PLC are among the leading companies, commanding a combined xx% market share in 2024. The industry is characterized by intense competition driven by innovation, product differentiation, and strategic acquisitions. Regulatory frameworks, particularly FDA approvals in key markets, significantly influence market entry and product lifecycle. Substitutes, such as alternative treatment methods, present a challenge, though the efficacy and minimally invasive nature of occlusion devices maintain strong market demand.
- Market Concentration: High, with top 5 players controlling approximately xx% of the market.
- Innovation Ecosystem: Active, with ongoing R&D in minimally invasive devices and improved biocompatibility.
- Regulatory Frameworks: Stringent, necessitating extensive clinical trials and approvals for new product launches.
- M&A Activity: Moderate, with strategic acquisitions aimed at expanding product portfolios and market reach. Total M&A deal value in the last five years is estimated at xx Million.
- End-User Trends: Increasing preference for minimally invasive procedures and shorter hospital stays is driving demand.
Occlusion Devices Industry Industry Trends & Insights
The global Occlusion Devices market is experiencing robust growth, driven by factors such as the rising prevalence of cardiovascular diseases, increasing geriatric population, and technological advancements leading to the development of sophisticated occlusion removal devices. The market is projected to register a CAGR of xx% during the forecast period (2025-2033), reaching a market value of xx Million by 2033. This growth is significantly influenced by the rising adoption of minimally invasive procedures and increasing healthcare expenditure globally. Technological disruptions, such as the development of advanced imaging techniques and improved device designs, are further boosting market expansion. Consumer preferences are shifting towards less invasive, more effective, and safer treatments which align perfectly with the advancements in Occlusion Devices. Competitive dynamics remain intense, with leading companies investing heavily in R&D and strategic partnerships to maintain their market position. Market penetration of minimally invasive procedures compared to traditional open surgeries is expected to reach xx% by 2033.
Dominant Markets & Segments in Occlusion Devices Industry
The Peripheral Vascular Disease application segment dominates the Occlusion Devices market, accounting for the largest market share due to the high prevalence of peripheral artery disease. North America is the leading regional market, driven by advanced healthcare infrastructure, high adoption rates, and favorable reimbursement policies. Hospitals remain the dominant end-user segment due to their established infrastructure and ability to manage complex procedures.
- Leading Region: North America. Key Drivers: Advanced healthcare infrastructure, high disposable incomes, and favorable reimbursement policies.
- Leading Application: Peripheral Vascular Disease. Key Drivers: High prevalence of PAD, increasing geriatric population, and demand for minimally invasive treatments.
- Leading Product: Occlusion Removal Devices. Key Drivers: Efficacy in treating various occlusions, technological advancements leading to improved device designs, and increasing adoption rates of minimally invasive procedures.
- Leading End-User: Hospitals. Key Drivers: Availability of advanced equipment and expertise to perform complex procedures.
Occlusion Devices Industry Product Innovations
Recent years have witnessed significant advancements in Occlusion Devices, with a focus on improved device design, enhanced biocompatibility, and minimally invasive delivery systems. The introduction of newer embolization devices with advanced features like targeted drug delivery and improved trackability has significantly impacted the market. Technological trends are geared toward smart devices with better imaging capabilities and enhanced precision for improved treatment outcomes and patient safety. This aligns perfectly with the market need for effective and less traumatic procedures.
Report Segmentation & Scope
The report segments the Occlusion Devices market by product type, encompassing Occlusion Removal Devices (market size xx Million in 2024, projected to reach xx Million in 2033), Embolization Devices (xx Million in 2024, projected to reach xx Million in 2033), and Support Devices (xx Million in 2024, projected to reach xx Million in 2033). Application segments include Peripheral Vascular Disease, Neurology, Oncology, Urology, and Other Applications. End-users are categorized as Hospitals, Ambulatory Surgical Centers, and Other End Users. Each segment's growth projections, market size, and competitive dynamics are detailed within the report.
Key Drivers of Occlusion Devices Industry Growth
Technological advancements, including the development of minimally invasive devices and improved imaging techniques, are key drivers. The rising prevalence of chronic diseases like cardiovascular disease and stroke fuels demand. Favorable regulatory environments, such as FDA approvals, accelerate market adoption. Increased healthcare spending and government initiatives promoting minimally invasive procedures contribute to market growth.
Challenges in the Occlusion Devices Industry Sector
Stringent regulatory approvals pose significant hurdles to market entry. Supply chain disruptions can impact device availability and pricing. Intense competition among established players and emerging companies creates pricing pressure. High treatment costs can limit accessibility for some patients. The market is also impacted by the development of alternative therapies potentially lowering the need for occlusion devices.
Leading Players in the Occlusion Devices Industry Market
- Merit Medical Systems
- Edwards Lifesciences Corporation
- LeMaitre Vascular Inc
- Terumo Corporation
- Abbott Laboratories
- BTG International Ltd
- Medtronic PLC
- Lepu Medical Technology
- Johnson & Johnson
- Stryker Corporation
- Boston Scientific Corporation
- Penumbra Inc
Key Developments in Occlusion Devices Industry Sector
- June 2022: Launch of Pipeline™ Vantage with Shield Technology by Medtronic PLC, a fourth-generation flow diverter for brain aneurysm treatment. This improved design significantly enhanced the delivery system and implant features, potentially capturing a larger market share.
- March 2022: US FDA approval of Artio Medical Inc.'s Solus Gold Embolization Device for peripheral vascular occlusion, signifying a breakthrough in next-generation treatment options and potentially driving strong market growth.
Strategic Occlusion Devices Industry Market Outlook
The Occlusion Devices market presents significant growth opportunities driven by technological advancements, rising prevalence of target diseases, and increasing healthcare spending. Strategic partnerships, investments in R&D, and expansion into emerging markets offer significant potential for market players. Focus on developing innovative products with enhanced features, improved safety profiles, and minimized invasiveness will drive future market growth. Companies need to adopt a strategic approach for successful penetration of the market and long-term profitability.
Occlusion Devices Industry Segmentation
-
1. Product
-
1.1. Occlusion Removal Devices
- 1.1.1. Coil Retrievers
- 1.1.2. Stent Retrievers
- 1.1.3. Other Occlusion Removal Devices
- 1.2. Embolization Devices
- 1.3. Support Devices
-
1.1. Occlusion Removal Devices
-
2. Application
- 2.1. Peripheral Vascular Disease
- 2.2. Neurology
- 2.3. Oncology
- 2.4. Urology
- 2.5. Other Applications
-
3. End User
- 3.1. Hospitals
- 3.2. Ambulatory Surgical Centers
- 3.3. Other End Users
Occlusion Devices Industry Segmentation By Geography
-
1. North America
- 1.1. United States
- 1.2. Canada
- 1.3. Mexico
-
2. Europe
- 2.1. Germany
- 2.2. United Kingdom
- 2.3. France
- 2.4. Italy
- 2.5. Spain
- 2.6. Rest of Europe
-
3. Asia Pacific
- 3.1. China
- 3.2. Japan
- 3.3. India
- 3.4. Australia
- 3.5. South Korea
- 3.6. Rest of Asia Pacific
-
4. Middle East and Africa
- 4.1. GCC
- 4.2. South Africa
- 4.3. Rest of Middle East and Africa
-
5. South America
- 5.1. Brazil
- 5.2. Argentina
- 5.3. Rest of South America
Occlusion Devices Industry REPORT HIGHLIGHTS
| Aspects | Details |
|---|---|
| Study Period | 2019-2033 |
| Base Year | 2024 |
| Estimated Year | 2025 |
| Forecast Period | 2025-2033 |
| Historical Period | 2019-2024 |
| Growth Rate | CAGR of 7.50% from 2019-2033 |
| Segmentation |
|
Table of Contents
- 1. Introduction
- 1.1. Research Scope
- 1.2. Market Segmentation
- 1.3. Research Methodology
- 1.4. Definitions and Assumptions
- 2. Executive Summary
- 2.1. Introduction
- 3. Market Dynamics
- 3.1. Introduction
- 3.2. Market Drivers
- 3.2.1. Rising Adoption of Minimally Invasive Surgeries; Increasing Geriatric Population and Rising Burden of Chronic Diseases; Technological Advancements
- 3.3. Market Restrains
- 3.3.1. High Cost of the Products; Requirement of Skilled Professionals
- 3.4. Market Trends
- 3.4.1. Neurology Segment is Expected to Witness a Lucrative Growth
- 4. Market Factor Analysis
- 4.1. Porters Five Forces
- 4.2. Supply/Value Chain
- 4.3. PESTEL analysis
- 4.4. Market Entropy
- 4.5. Patent/Trademark Analysis
- 5. Global Occlusion Devices Industry Analysis, Insights and Forecast, 2019-2031
- 5.1. Market Analysis, Insights and Forecast - by Product
- 5.1.1. Occlusion Removal Devices
- 5.1.1.1. Coil Retrievers
- 5.1.1.2. Stent Retrievers
- 5.1.1.3. Other Occlusion Removal Devices
- 5.1.2. Embolization Devices
- 5.1.3. Support Devices
- 5.1.1. Occlusion Removal Devices
- 5.2. Market Analysis, Insights and Forecast - by Application
- 5.2.1. Peripheral Vascular Disease
- 5.2.2. Neurology
- 5.2.3. Oncology
- 5.2.4. Urology
- 5.2.5. Other Applications
- 5.3. Market Analysis, Insights and Forecast - by End User
- 5.3.1. Hospitals
- 5.3.2. Ambulatory Surgical Centers
- 5.3.3. Other End Users
- 5.4. Market Analysis, Insights and Forecast - by Region
- 5.4.1. North America
- 5.4.2. Europe
- 5.4.3. Asia Pacific
- 5.4.4. Middle East and Africa
- 5.4.5. South America
- 5.1. Market Analysis, Insights and Forecast - by Product
- 6. North America Occlusion Devices Industry Analysis, Insights and Forecast, 2019-2031
- 6.1. Market Analysis, Insights and Forecast - by Product
- 6.1.1. Occlusion Removal Devices
- 6.1.1.1. Coil Retrievers
- 6.1.1.2. Stent Retrievers
- 6.1.1.3. Other Occlusion Removal Devices
- 6.1.2. Embolization Devices
- 6.1.3. Support Devices
- 6.1.1. Occlusion Removal Devices
- 6.2. Market Analysis, Insights and Forecast - by Application
- 6.2.1. Peripheral Vascular Disease
- 6.2.2. Neurology
- 6.2.3. Oncology
- 6.2.4. Urology
- 6.2.5. Other Applications
- 6.3. Market Analysis, Insights and Forecast - by End User
- 6.3.1. Hospitals
- 6.3.2. Ambulatory Surgical Centers
- 6.3.3. Other End Users
- 6.1. Market Analysis, Insights and Forecast - by Product
- 7. Europe Occlusion Devices Industry Analysis, Insights and Forecast, 2019-2031
- 7.1. Market Analysis, Insights and Forecast - by Product
- 7.1.1. Occlusion Removal Devices
- 7.1.1.1. Coil Retrievers
- 7.1.1.2. Stent Retrievers
- 7.1.1.3. Other Occlusion Removal Devices
- 7.1.2. Embolization Devices
- 7.1.3. Support Devices
- 7.1.1. Occlusion Removal Devices
- 7.2. Market Analysis, Insights and Forecast - by Application
- 7.2.1. Peripheral Vascular Disease
- 7.2.2. Neurology
- 7.2.3. Oncology
- 7.2.4. Urology
- 7.2.5. Other Applications
- 7.3. Market Analysis, Insights and Forecast - by End User
- 7.3.1. Hospitals
- 7.3.2. Ambulatory Surgical Centers
- 7.3.3. Other End Users
- 7.1. Market Analysis, Insights and Forecast - by Product
- 8. Asia Pacific Occlusion Devices Industry Analysis, Insights and Forecast, 2019-2031
- 8.1. Market Analysis, Insights and Forecast - by Product
- 8.1.1. Occlusion Removal Devices
- 8.1.1.1. Coil Retrievers
- 8.1.1.2. Stent Retrievers
- 8.1.1.3. Other Occlusion Removal Devices
- 8.1.2. Embolization Devices
- 8.1.3. Support Devices
- 8.1.1. Occlusion Removal Devices
- 8.2. Market Analysis, Insights and Forecast - by Application
- 8.2.1. Peripheral Vascular Disease
- 8.2.2. Neurology
- 8.2.3. Oncology
- 8.2.4. Urology
- 8.2.5. Other Applications
- 8.3. Market Analysis, Insights and Forecast - by End User
- 8.3.1. Hospitals
- 8.3.2. Ambulatory Surgical Centers
- 8.3.3. Other End Users
- 8.1. Market Analysis, Insights and Forecast - by Product
- 9. Middle East and Africa Occlusion Devices Industry Analysis, Insights and Forecast, 2019-2031
- 9.1. Market Analysis, Insights and Forecast - by Product
- 9.1.1. Occlusion Removal Devices
- 9.1.1.1. Coil Retrievers
- 9.1.1.2. Stent Retrievers
- 9.1.1.3. Other Occlusion Removal Devices
- 9.1.2. Embolization Devices
- 9.1.3. Support Devices
- 9.1.1. Occlusion Removal Devices
- 9.2. Market Analysis, Insights and Forecast - by Application
- 9.2.1. Peripheral Vascular Disease
- 9.2.2. Neurology
- 9.2.3. Oncology
- 9.2.4. Urology
- 9.2.5. Other Applications
- 9.3. Market Analysis, Insights and Forecast - by End User
- 9.3.1. Hospitals
- 9.3.2. Ambulatory Surgical Centers
- 9.3.3. Other End Users
- 9.1. Market Analysis, Insights and Forecast - by Product
- 10. South America Occlusion Devices Industry Analysis, Insights and Forecast, 2019-2031
- 10.1. Market Analysis, Insights and Forecast - by Product
- 10.1.1. Occlusion Removal Devices
- 10.1.1.1. Coil Retrievers
- 10.1.1.2. Stent Retrievers
- 10.1.1.3. Other Occlusion Removal Devices
- 10.1.2. Embolization Devices
- 10.1.3. Support Devices
- 10.1.1. Occlusion Removal Devices
- 10.2. Market Analysis, Insights and Forecast - by Application
- 10.2.1. Peripheral Vascular Disease
- 10.2.2. Neurology
- 10.2.3. Oncology
- 10.2.4. Urology
- 10.2.5. Other Applications
- 10.3. Market Analysis, Insights and Forecast - by End User
- 10.3.1. Hospitals
- 10.3.2. Ambulatory Surgical Centers
- 10.3.3. Other End Users
- 10.1. Market Analysis, Insights and Forecast - by Product
- 11. North Americ Occlusion Devices Industry Analysis, Insights and Forecast, 2019-2031
- 11.1. Market Analysis, Insights and Forecast - By Country/Sub-region
- 11.1.1 United States
- 11.1.2 Canada
- 11.1.3 Mexico
- 12. South America Occlusion Devices Industry Analysis, Insights and Forecast, 2019-2031
- 12.1. Market Analysis, Insights and Forecast - By Country/Sub-region
- 12.1.1 Brazil
- 12.1.2 Mexico
- 12.1.3 Rest of South America
- 13. Europe Occlusion Devices Industry Analysis, Insights and Forecast, 2019-2031
- 13.1. Market Analysis, Insights and Forecast - By Country/Sub-region
- 13.1.1 Germany
- 13.1.2 United Kingdom
- 13.1.3 France
- 13.1.4 Italy
- 13.1.5 Spain
- 13.1.6 Rest of Europe
- 14. Asia Pacific Occlusion Devices Industry Analysis, Insights and Forecast, 2019-2031
- 14.1. Market Analysis, Insights and Forecast - By Country/Sub-region
- 14.1.1 China
- 14.1.2 Japan
- 14.1.3 India
- 14.1.4 South Korea
- 14.1.5 Taiwan
- 14.1.6 Australia
- 14.1.7 Rest of Asia-Pacific
- 15. MEA Occlusion Devices Industry Analysis, Insights and Forecast, 2019-2031
- 15.1. Market Analysis, Insights and Forecast - By Country/Sub-region
- 15.1.1 Middle East
- 15.1.2 Africa
- 16. Competitive Analysis
- 16.1. Global Market Share Analysis 2024
- 16.2. Company Profiles
- 16.2.1 Merit Medical Systems
- 16.2.1.1. Overview
- 16.2.1.2. Products
- 16.2.1.3. SWOT Analysis
- 16.2.1.4. Recent Developments
- 16.2.1.5. Financials (Based on Availability)
- 16.2.2 Edwards Lifesciences Corporation
- 16.2.2.1. Overview
- 16.2.2.2. Products
- 16.2.2.3. SWOT Analysis
- 16.2.2.4. Recent Developments
- 16.2.2.5. Financials (Based on Availability)
- 16.2.3 LeMaitre Vascular Inc
- 16.2.3.1. Overview
- 16.2.3.2. Products
- 16.2.3.3. SWOT Analysis
- 16.2.3.4. Recent Developments
- 16.2.3.5. Financials (Based on Availability)
- 16.2.4 Terumo Corporation
- 16.2.4.1. Overview
- 16.2.4.2. Products
- 16.2.4.3. SWOT Analysis
- 16.2.4.4. Recent Developments
- 16.2.4.5. Financials (Based on Availability)
- 16.2.5 Abbott Laboratories
- 16.2.5.1. Overview
- 16.2.5.2. Products
- 16.2.5.3. SWOT Analysis
- 16.2.5.4. Recent Developments
- 16.2.5.5. Financials (Based on Availability)
- 16.2.6 BTG International Ltd
- 16.2.6.1. Overview
- 16.2.6.2. Products
- 16.2.6.3. SWOT Analysis
- 16.2.6.4. Recent Developments
- 16.2.6.5. Financials (Based on Availability)
- 16.2.7 Medtronic PLC
- 16.2.7.1. Overview
- 16.2.7.2. Products
- 16.2.7.3. SWOT Analysis
- 16.2.7.4. Recent Developments
- 16.2.7.5. Financials (Based on Availability)
- 16.2.8 Lepu Medical Technology
- 16.2.8.1. Overview
- 16.2.8.2. Products
- 16.2.8.3. SWOT Analysis
- 16.2.8.4. Recent Developments
- 16.2.8.5. Financials (Based on Availability)
- 16.2.9 Johnson & Johnson
- 16.2.9.1. Overview
- 16.2.9.2. Products
- 16.2.9.3. SWOT Analysis
- 16.2.9.4. Recent Developments
- 16.2.9.5. Financials (Based on Availability)
- 16.2.10 Stryker Corporation
- 16.2.10.1. Overview
- 16.2.10.2. Products
- 16.2.10.3. SWOT Analysis
- 16.2.10.4. Recent Developments
- 16.2.10.5. Financials (Based on Availability)
- 16.2.11 Boston Scientific Corporation
- 16.2.11.1. Overview
- 16.2.11.2. Products
- 16.2.11.3. SWOT Analysis
- 16.2.11.4. Recent Developments
- 16.2.11.5. Financials (Based on Availability)
- 16.2.12 Penumbra Inc
- 16.2.12.1. Overview
- 16.2.12.2. Products
- 16.2.12.3. SWOT Analysis
- 16.2.12.4. Recent Developments
- 16.2.12.5. Financials (Based on Availability)
- 16.2.1 Merit Medical Systems
List of Figures
- Figure 1: Global Occlusion Devices Industry Revenue Breakdown (Million, %) by Region 2024 & 2032
- Figure 2: Global Occlusion Devices Industry Volume Breakdown (K Unit, %) by Region 2024 & 2032
- Figure 3: North Americ Occlusion Devices Industry Revenue (Million), by Country 2024 & 2032
- Figure 4: North Americ Occlusion Devices Industry Volume (K Unit), by Country 2024 & 2032
- Figure 5: North Americ Occlusion Devices Industry Revenue Share (%), by Country 2024 & 2032
- Figure 6: North Americ Occlusion Devices Industry Volume Share (%), by Country 2024 & 2032
- Figure 7: South America Occlusion Devices Industry Revenue (Million), by Country 2024 & 2032
- Figure 8: South America Occlusion Devices Industry Volume (K Unit), by Country 2024 & 2032
- Figure 9: South America Occlusion Devices Industry Revenue Share (%), by Country 2024 & 2032
- Figure 10: South America Occlusion Devices Industry Volume Share (%), by Country 2024 & 2032
- Figure 11: Europe Occlusion Devices Industry Revenue (Million), by Country 2024 & 2032
- Figure 12: Europe Occlusion Devices Industry Volume (K Unit), by Country 2024 & 2032
- Figure 13: Europe Occlusion Devices Industry Revenue Share (%), by Country 2024 & 2032
- Figure 14: Europe Occlusion Devices Industry Volume Share (%), by Country 2024 & 2032
- Figure 15: Asia Pacific Occlusion Devices Industry Revenue (Million), by Country 2024 & 2032
- Figure 16: Asia Pacific Occlusion Devices Industry Volume (K Unit), by Country 2024 & 2032
- Figure 17: Asia Pacific Occlusion Devices Industry Revenue Share (%), by Country 2024 & 2032
- Figure 18: Asia Pacific Occlusion Devices Industry Volume Share (%), by Country 2024 & 2032
- Figure 19: MEA Occlusion Devices Industry Revenue (Million), by Country 2024 & 2032
- Figure 20: MEA Occlusion Devices Industry Volume (K Unit), by Country 2024 & 2032
- Figure 21: MEA Occlusion Devices Industry Revenue Share (%), by Country 2024 & 2032
- Figure 22: MEA Occlusion Devices Industry Volume Share (%), by Country 2024 & 2032
- Figure 23: North America Occlusion Devices Industry Revenue (Million), by Product 2024 & 2032
- Figure 24: North America Occlusion Devices Industry Volume (K Unit), by Product 2024 & 2032
- Figure 25: North America Occlusion Devices Industry Revenue Share (%), by Product 2024 & 2032
- Figure 26: North America Occlusion Devices Industry Volume Share (%), by Product 2024 & 2032
- Figure 27: North America Occlusion Devices Industry Revenue (Million), by Application 2024 & 2032
- Figure 28: North America Occlusion Devices Industry Volume (K Unit), by Application 2024 & 2032
- Figure 29: North America Occlusion Devices Industry Revenue Share (%), by Application 2024 & 2032
- Figure 30: North America Occlusion Devices Industry Volume Share (%), by Application 2024 & 2032
- Figure 31: North America Occlusion Devices Industry Revenue (Million), by End User 2024 & 2032
- Figure 32: North America Occlusion Devices Industry Volume (K Unit), by End User 2024 & 2032
- Figure 33: North America Occlusion Devices Industry Revenue Share (%), by End User 2024 & 2032
- Figure 34: North America Occlusion Devices Industry Volume Share (%), by End User 2024 & 2032
- Figure 35: North America Occlusion Devices Industry Revenue (Million), by Country 2024 & 2032
- Figure 36: North America Occlusion Devices Industry Volume (K Unit), by Country 2024 & 2032
- Figure 37: North America Occlusion Devices Industry Revenue Share (%), by Country 2024 & 2032
- Figure 38: North America Occlusion Devices Industry Volume Share (%), by Country 2024 & 2032
- Figure 39: Europe Occlusion Devices Industry Revenue (Million), by Product 2024 & 2032
- Figure 40: Europe Occlusion Devices Industry Volume (K Unit), by Product 2024 & 2032
- Figure 41: Europe Occlusion Devices Industry Revenue Share (%), by Product 2024 & 2032
- Figure 42: Europe Occlusion Devices Industry Volume Share (%), by Product 2024 & 2032
- Figure 43: Europe Occlusion Devices Industry Revenue (Million), by Application 2024 & 2032
- Figure 44: Europe Occlusion Devices Industry Volume (K Unit), by Application 2024 & 2032
- Figure 45: Europe Occlusion Devices Industry Revenue Share (%), by Application 2024 & 2032
- Figure 46: Europe Occlusion Devices Industry Volume Share (%), by Application 2024 & 2032
- Figure 47: Europe Occlusion Devices Industry Revenue (Million), by End User 2024 & 2032
- Figure 48: Europe Occlusion Devices Industry Volume (K Unit), by End User 2024 & 2032
- Figure 49: Europe Occlusion Devices Industry Revenue Share (%), by End User 2024 & 2032
- Figure 50: Europe Occlusion Devices Industry Volume Share (%), by End User 2024 & 2032
- Figure 51: Europe Occlusion Devices Industry Revenue (Million), by Country 2024 & 2032
- Figure 52: Europe Occlusion Devices Industry Volume (K Unit), by Country 2024 & 2032
- Figure 53: Europe Occlusion Devices Industry Revenue Share (%), by Country 2024 & 2032
- Figure 54: Europe Occlusion Devices Industry Volume Share (%), by Country 2024 & 2032
- Figure 55: Asia Pacific Occlusion Devices Industry Revenue (Million), by Product 2024 & 2032
- Figure 56: Asia Pacific Occlusion Devices Industry Volume (K Unit), by Product 2024 & 2032
- Figure 57: Asia Pacific Occlusion Devices Industry Revenue Share (%), by Product 2024 & 2032
- Figure 58: Asia Pacific Occlusion Devices Industry Volume Share (%), by Product 2024 & 2032
- Figure 59: Asia Pacific Occlusion Devices Industry Revenue (Million), by Application 2024 & 2032
- Figure 60: Asia Pacific Occlusion Devices Industry Volume (K Unit), by Application 2024 & 2032
- Figure 61: Asia Pacific Occlusion Devices Industry Revenue Share (%), by Application 2024 & 2032
- Figure 62: Asia Pacific Occlusion Devices Industry Volume Share (%), by Application 2024 & 2032
- Figure 63: Asia Pacific Occlusion Devices Industry Revenue (Million), by End User 2024 & 2032
- Figure 64: Asia Pacific Occlusion Devices Industry Volume (K Unit), by End User 2024 & 2032
- Figure 65: Asia Pacific Occlusion Devices Industry Revenue Share (%), by End User 2024 & 2032
- Figure 66: Asia Pacific Occlusion Devices Industry Volume Share (%), by End User 2024 & 2032
- Figure 67: Asia Pacific Occlusion Devices Industry Revenue (Million), by Country 2024 & 2032
- Figure 68: Asia Pacific Occlusion Devices Industry Volume (K Unit), by Country 2024 & 2032
- Figure 69: Asia Pacific Occlusion Devices Industry Revenue Share (%), by Country 2024 & 2032
- Figure 70: Asia Pacific Occlusion Devices Industry Volume Share (%), by Country 2024 & 2032
- Figure 71: Middle East and Africa Occlusion Devices Industry Revenue (Million), by Product 2024 & 2032
- Figure 72: Middle East and Africa Occlusion Devices Industry Volume (K Unit), by Product 2024 & 2032
- Figure 73: Middle East and Africa Occlusion Devices Industry Revenue Share (%), by Product 2024 & 2032
- Figure 74: Middle East and Africa Occlusion Devices Industry Volume Share (%), by Product 2024 & 2032
- Figure 75: Middle East and Africa Occlusion Devices Industry Revenue (Million), by Application 2024 & 2032
- Figure 76: Middle East and Africa Occlusion Devices Industry Volume (K Unit), by Application 2024 & 2032
- Figure 77: Middle East and Africa Occlusion Devices Industry Revenue Share (%), by Application 2024 & 2032
- Figure 78: Middle East and Africa Occlusion Devices Industry Volume Share (%), by Application 2024 & 2032
- Figure 79: Middle East and Africa Occlusion Devices Industry Revenue (Million), by End User 2024 & 2032
- Figure 80: Middle East and Africa Occlusion Devices Industry Volume (K Unit), by End User 2024 & 2032
- Figure 81: Middle East and Africa Occlusion Devices Industry Revenue Share (%), by End User 2024 & 2032
- Figure 82: Middle East and Africa Occlusion Devices Industry Volume Share (%), by End User 2024 & 2032
- Figure 83: Middle East and Africa Occlusion Devices Industry Revenue (Million), by Country 2024 & 2032
- Figure 84: Middle East and Africa Occlusion Devices Industry Volume (K Unit), by Country 2024 & 2032
- Figure 85: Middle East and Africa Occlusion Devices Industry Revenue Share (%), by Country 2024 & 2032
- Figure 86: Middle East and Africa Occlusion Devices Industry Volume Share (%), by Country 2024 & 2032
- Figure 87: South America Occlusion Devices Industry Revenue (Million), by Product 2024 & 2032
- Figure 88: South America Occlusion Devices Industry Volume (K Unit), by Product 2024 & 2032
- Figure 89: South America Occlusion Devices Industry Revenue Share (%), by Product 2024 & 2032
- Figure 90: South America Occlusion Devices Industry Volume Share (%), by Product 2024 & 2032
- Figure 91: South America Occlusion Devices Industry Revenue (Million), by Application 2024 & 2032
- Figure 92: South America Occlusion Devices Industry Volume (K Unit), by Application 2024 & 2032
- Figure 93: South America Occlusion Devices Industry Revenue Share (%), by Application 2024 & 2032
- Figure 94: South America Occlusion Devices Industry Volume Share (%), by Application 2024 & 2032
- Figure 95: South America Occlusion Devices Industry Revenue (Million), by End User 2024 & 2032
- Figure 96: South America Occlusion Devices Industry Volume (K Unit), by End User 2024 & 2032
- Figure 97: South America Occlusion Devices Industry Revenue Share (%), by End User 2024 & 2032
- Figure 98: South America Occlusion Devices Industry Volume Share (%), by End User 2024 & 2032
- Figure 99: South America Occlusion Devices Industry Revenue (Million), by Country 2024 & 2032
- Figure 100: South America Occlusion Devices Industry Volume (K Unit), by Country 2024 & 2032
- Figure 101: South America Occlusion Devices Industry Revenue Share (%), by Country 2024 & 2032
- Figure 102: South America Occlusion Devices Industry Volume Share (%), by Country 2024 & 2032
List of Tables
- Table 1: Global Occlusion Devices Industry Revenue Million Forecast, by Region 2019 & 2032
- Table 2: Global Occlusion Devices Industry Volume K Unit Forecast, by Region 2019 & 2032
- Table 3: Global Occlusion Devices Industry Revenue Million Forecast, by Product 2019 & 2032
- Table 4: Global Occlusion Devices Industry Volume K Unit Forecast, by Product 2019 & 2032
- Table 5: Global Occlusion Devices Industry Revenue Million Forecast, by Application 2019 & 2032
- Table 6: Global Occlusion Devices Industry Volume K Unit Forecast, by Application 2019 & 2032
- Table 7: Global Occlusion Devices Industry Revenue Million Forecast, by End User 2019 & 2032
- Table 8: Global Occlusion Devices Industry Volume K Unit Forecast, by End User 2019 & 2032
- Table 9: Global Occlusion Devices Industry Revenue Million Forecast, by Region 2019 & 2032
- Table 10: Global Occlusion Devices Industry Volume K Unit Forecast, by Region 2019 & 2032
- Table 11: Global Occlusion Devices Industry Revenue Million Forecast, by Country 2019 & 2032
- Table 12: Global Occlusion Devices Industry Volume K Unit Forecast, by Country 2019 & 2032
- Table 13: United States Occlusion Devices Industry Revenue (Million) Forecast, by Application 2019 & 2032
- Table 14: United States Occlusion Devices Industry Volume (K Unit) Forecast, by Application 2019 & 2032
- Table 15: Canada Occlusion Devices Industry Revenue (Million) Forecast, by Application 2019 & 2032
- Table 16: Canada Occlusion Devices Industry Volume (K Unit) Forecast, by Application 2019 & 2032
- Table 17: Mexico Occlusion Devices Industry Revenue (Million) Forecast, by Application 2019 & 2032
- Table 18: Mexico Occlusion Devices Industry Volume (K Unit) Forecast, by Application 2019 & 2032
- Table 19: Global Occlusion Devices Industry Revenue Million Forecast, by Country 2019 & 2032
- Table 20: Global Occlusion Devices Industry Volume K Unit Forecast, by Country 2019 & 2032
- Table 21: Brazil Occlusion Devices Industry Revenue (Million) Forecast, by Application 2019 & 2032
- Table 22: Brazil Occlusion Devices Industry Volume (K Unit) Forecast, by Application 2019 & 2032
- Table 23: Mexico Occlusion Devices Industry Revenue (Million) Forecast, by Application 2019 & 2032
- Table 24: Mexico Occlusion Devices Industry Volume (K Unit) Forecast, by Application 2019 & 2032
- Table 25: Rest of South America Occlusion Devices Industry Revenue (Million) Forecast, by Application 2019 & 2032
- Table 26: Rest of South America Occlusion Devices Industry Volume (K Unit) Forecast, by Application 2019 & 2032
- Table 27: Global Occlusion Devices Industry Revenue Million Forecast, by Country 2019 & 2032
- Table 28: Global Occlusion Devices Industry Volume K Unit Forecast, by Country 2019 & 2032
- Table 29: Germany Occlusion Devices Industry Revenue (Million) Forecast, by Application 2019 & 2032
- Table 30: Germany Occlusion Devices Industry Volume (K Unit) Forecast, by Application 2019 & 2032
- Table 31: United Kingdom Occlusion Devices Industry Revenue (Million) Forecast, by Application 2019 & 2032
- Table 32: United Kingdom Occlusion Devices Industry Volume (K Unit) Forecast, by Application 2019 & 2032
- Table 33: France Occlusion Devices Industry Revenue (Million) Forecast, by Application 2019 & 2032
- Table 34: France Occlusion Devices Industry Volume (K Unit) Forecast, by Application 2019 & 2032
- Table 35: Italy Occlusion Devices Industry Revenue (Million) Forecast, by Application 2019 & 2032
- Table 36: Italy Occlusion Devices Industry Volume (K Unit) Forecast, by Application 2019 & 2032
- Table 37: Spain Occlusion Devices Industry Revenue (Million) Forecast, by Application 2019 & 2032
- Table 38: Spain Occlusion Devices Industry Volume (K Unit) Forecast, by Application 2019 & 2032
- Table 39: Rest of Europe Occlusion Devices Industry Revenue (Million) Forecast, by Application 2019 & 2032
- Table 40: Rest of Europe Occlusion Devices Industry Volume (K Unit) Forecast, by Application 2019 & 2032
- Table 41: Global Occlusion Devices Industry Revenue Million Forecast, by Country 2019 & 2032
- Table 42: Global Occlusion Devices Industry Volume K Unit Forecast, by Country 2019 & 2032
- Table 43: China Occlusion Devices Industry Revenue (Million) Forecast, by Application 2019 & 2032
- Table 44: China Occlusion Devices Industry Volume (K Unit) Forecast, by Application 2019 & 2032
- Table 45: Japan Occlusion Devices Industry Revenue (Million) Forecast, by Application 2019 & 2032
- Table 46: Japan Occlusion Devices Industry Volume (K Unit) Forecast, by Application 2019 & 2032
- Table 47: India Occlusion Devices Industry Revenue (Million) Forecast, by Application 2019 & 2032
- Table 48: India Occlusion Devices Industry Volume (K Unit) Forecast, by Application 2019 & 2032
- Table 49: South Korea Occlusion Devices Industry Revenue (Million) Forecast, by Application 2019 & 2032
- Table 50: South Korea Occlusion Devices Industry Volume (K Unit) Forecast, by Application 2019 & 2032
- Table 51: Taiwan Occlusion Devices Industry Revenue (Million) Forecast, by Application 2019 & 2032
- Table 52: Taiwan Occlusion Devices Industry Volume (K Unit) Forecast, by Application 2019 & 2032
- Table 53: Australia Occlusion Devices Industry Revenue (Million) Forecast, by Application 2019 & 2032
- Table 54: Australia Occlusion Devices Industry Volume (K Unit) Forecast, by Application 2019 & 2032
- Table 55: Rest of Asia-Pacific Occlusion Devices Industry Revenue (Million) Forecast, by Application 2019 & 2032
- Table 56: Rest of Asia-Pacific Occlusion Devices Industry Volume (K Unit) Forecast, by Application 2019 & 2032
- Table 57: Global Occlusion Devices Industry Revenue Million Forecast, by Country 2019 & 2032
- Table 58: Global Occlusion Devices Industry Volume K Unit Forecast, by Country 2019 & 2032
- Table 59: Middle East Occlusion Devices Industry Revenue (Million) Forecast, by Application 2019 & 2032
- Table 60: Middle East Occlusion Devices Industry Volume (K Unit) Forecast, by Application 2019 & 2032
- Table 61: Africa Occlusion Devices Industry Revenue (Million) Forecast, by Application 2019 & 2032
- Table 62: Africa Occlusion Devices Industry Volume (K Unit) Forecast, by Application 2019 & 2032
- Table 63: Global Occlusion Devices Industry Revenue Million Forecast, by Product 2019 & 2032
- Table 64: Global Occlusion Devices Industry Volume K Unit Forecast, by Product 2019 & 2032
- Table 65: Global Occlusion Devices Industry Revenue Million Forecast, by Application 2019 & 2032
- Table 66: Global Occlusion Devices Industry Volume K Unit Forecast, by Application 2019 & 2032
- Table 67: Global Occlusion Devices Industry Revenue Million Forecast, by End User 2019 & 2032
- Table 68: Global Occlusion Devices Industry Volume K Unit Forecast, by End User 2019 & 2032
- Table 69: Global Occlusion Devices Industry Revenue Million Forecast, by Country 2019 & 2032
- Table 70: Global Occlusion Devices Industry Volume K Unit Forecast, by Country 2019 & 2032
- Table 71: United States Occlusion Devices Industry Revenue (Million) Forecast, by Application 2019 & 2032
- Table 72: United States Occlusion Devices Industry Volume (K Unit) Forecast, by Application 2019 & 2032
- Table 73: Canada Occlusion Devices Industry Revenue (Million) Forecast, by Application 2019 & 2032
- Table 74: Canada Occlusion Devices Industry Volume (K Unit) Forecast, by Application 2019 & 2032
- Table 75: Mexico Occlusion Devices Industry Revenue (Million) Forecast, by Application 2019 & 2032
- Table 76: Mexico Occlusion Devices Industry Volume (K Unit) Forecast, by Application 2019 & 2032
- Table 77: Global Occlusion Devices Industry Revenue Million Forecast, by Product 2019 & 2032
- Table 78: Global Occlusion Devices Industry Volume K Unit Forecast, by Product 2019 & 2032
- Table 79: Global Occlusion Devices Industry Revenue Million Forecast, by Application 2019 & 2032
- Table 80: Global Occlusion Devices Industry Volume K Unit Forecast, by Application 2019 & 2032
- Table 81: Global Occlusion Devices Industry Revenue Million Forecast, by End User 2019 & 2032
- Table 82: Global Occlusion Devices Industry Volume K Unit Forecast, by End User 2019 & 2032
- Table 83: Global Occlusion Devices Industry Revenue Million Forecast, by Country 2019 & 2032
- Table 84: Global Occlusion Devices Industry Volume K Unit Forecast, by Country 2019 & 2032
- Table 85: Germany Occlusion Devices Industry Revenue (Million) Forecast, by Application 2019 & 2032
- Table 86: Germany Occlusion Devices Industry Volume (K Unit) Forecast, by Application 2019 & 2032
- Table 87: United Kingdom Occlusion Devices Industry Revenue (Million) Forecast, by Application 2019 & 2032
- Table 88: United Kingdom Occlusion Devices Industry Volume (K Unit) Forecast, by Application 2019 & 2032
- Table 89: France Occlusion Devices Industry Revenue (Million) Forecast, by Application 2019 & 2032
- Table 90: France Occlusion Devices Industry Volume (K Unit) Forecast, by Application 2019 & 2032
- Table 91: Italy Occlusion Devices Industry Revenue (Million) Forecast, by Application 2019 & 2032
- Table 92: Italy Occlusion Devices Industry Volume (K Unit) Forecast, by Application 2019 & 2032
- Table 93: Spain Occlusion Devices Industry Revenue (Million) Forecast, by Application 2019 & 2032
- Table 94: Spain Occlusion Devices Industry Volume (K Unit) Forecast, by Application 2019 & 2032
- Table 95: Rest of Europe Occlusion Devices Industry Revenue (Million) Forecast, by Application 2019 & 2032
- Table 96: Rest of Europe Occlusion Devices Industry Volume (K Unit) Forecast, by Application 2019 & 2032
- Table 97: Global Occlusion Devices Industry Revenue Million Forecast, by Product 2019 & 2032
- Table 98: Global Occlusion Devices Industry Volume K Unit Forecast, by Product 2019 & 2032
- Table 99: Global Occlusion Devices Industry Revenue Million Forecast, by Application 2019 & 2032
- Table 100: Global Occlusion Devices Industry Volume K Unit Forecast, by Application 2019 & 2032
- Table 101: Global Occlusion Devices Industry Revenue Million Forecast, by End User 2019 & 2032
- Table 102: Global Occlusion Devices Industry Volume K Unit Forecast, by End User 2019 & 2032
- Table 103: Global Occlusion Devices Industry Revenue Million Forecast, by Country 2019 & 2032
- Table 104: Global Occlusion Devices Industry Volume K Unit Forecast, by Country 2019 & 2032
- Table 105: China Occlusion Devices Industry Revenue (Million) Forecast, by Application 2019 & 2032
- Table 106: China Occlusion Devices Industry Volume (K Unit) Forecast, by Application 2019 & 2032
- Table 107: Japan Occlusion Devices Industry Revenue (Million) Forecast, by Application 2019 & 2032
- Table 108: Japan Occlusion Devices Industry Volume (K Unit) Forecast, by Application 2019 & 2032
- Table 109: India Occlusion Devices Industry Revenue (Million) Forecast, by Application 2019 & 2032
- Table 110: India Occlusion Devices Industry Volume (K Unit) Forecast, by Application 2019 & 2032
- Table 111: Australia Occlusion Devices Industry Revenue (Million) Forecast, by Application 2019 & 2032
- Table 112: Australia Occlusion Devices Industry Volume (K Unit) Forecast, by Application 2019 & 2032
- Table 113: South Korea Occlusion Devices Industry Revenue (Million) Forecast, by Application 2019 & 2032
- Table 114: South Korea Occlusion Devices Industry Volume (K Unit) Forecast, by Application 2019 & 2032
- Table 115: Rest of Asia Pacific Occlusion Devices Industry Revenue (Million) Forecast, by Application 2019 & 2032
- Table 116: Rest of Asia Pacific Occlusion Devices Industry Volume (K Unit) Forecast, by Application 2019 & 2032
- Table 117: Global Occlusion Devices Industry Revenue Million Forecast, by Product 2019 & 2032
- Table 118: Global Occlusion Devices Industry Volume K Unit Forecast, by Product 2019 & 2032
- Table 119: Global Occlusion Devices Industry Revenue Million Forecast, by Application 2019 & 2032
- Table 120: Global Occlusion Devices Industry Volume K Unit Forecast, by Application 2019 & 2032
- Table 121: Global Occlusion Devices Industry Revenue Million Forecast, by End User 2019 & 2032
- Table 122: Global Occlusion Devices Industry Volume K Unit Forecast, by End User 2019 & 2032
- Table 123: Global Occlusion Devices Industry Revenue Million Forecast, by Country 2019 & 2032
- Table 124: Global Occlusion Devices Industry Volume K Unit Forecast, by Country 2019 & 2032
- Table 125: GCC Occlusion Devices Industry Revenue (Million) Forecast, by Application 2019 & 2032
- Table 126: GCC Occlusion Devices Industry Volume (K Unit) Forecast, by Application 2019 & 2032
- Table 127: South Africa Occlusion Devices Industry Revenue (Million) Forecast, by Application 2019 & 2032
- Table 128: South Africa Occlusion Devices Industry Volume (K Unit) Forecast, by Application 2019 & 2032
- Table 129: Rest of Middle East and Africa Occlusion Devices Industry Revenue (Million) Forecast, by Application 2019 & 2032
- Table 130: Rest of Middle East and Africa Occlusion Devices Industry Volume (K Unit) Forecast, by Application 2019 & 2032
- Table 131: Global Occlusion Devices Industry Revenue Million Forecast, by Product 2019 & 2032
- Table 132: Global Occlusion Devices Industry Volume K Unit Forecast, by Product 2019 & 2032
- Table 133: Global Occlusion Devices Industry Revenue Million Forecast, by Application 2019 & 2032
- Table 134: Global Occlusion Devices Industry Volume K Unit Forecast, by Application 2019 & 2032
- Table 135: Global Occlusion Devices Industry Revenue Million Forecast, by End User 2019 & 2032
- Table 136: Global Occlusion Devices Industry Volume K Unit Forecast, by End User 2019 & 2032
- Table 137: Global Occlusion Devices Industry Revenue Million Forecast, by Country 2019 & 2032
- Table 138: Global Occlusion Devices Industry Volume K Unit Forecast, by Country 2019 & 2032
- Table 139: Brazil Occlusion Devices Industry Revenue (Million) Forecast, by Application 2019 & 2032
- Table 140: Brazil Occlusion Devices Industry Volume (K Unit) Forecast, by Application 2019 & 2032
- Table 141: Argentina Occlusion Devices Industry Revenue (Million) Forecast, by Application 2019 & 2032
- Table 142: Argentina Occlusion Devices Industry Volume (K Unit) Forecast, by Application 2019 & 2032
- Table 143: Rest of South America Occlusion Devices Industry Revenue (Million) Forecast, by Application 2019 & 2032
- Table 144: Rest of South America Occlusion Devices Industry Volume (K Unit) Forecast, by Application 2019 & 2032
Frequently Asked Questions
1. What is the projected Compound Annual Growth Rate (CAGR) of the Occlusion Devices Industry?
The projected CAGR is approximately 7.50%.
2. Which companies are prominent players in the Occlusion Devices Industry?
Key companies in the market include Merit Medical Systems, Edwards Lifesciences Corporation, LeMaitre Vascular Inc , Terumo Corporation, Abbott Laboratories, BTG International Ltd, Medtronic PLC, Lepu Medical Technology, Johnson & Johnson, Stryker Corporation, Boston Scientific Corporation, Penumbra Inc.
3. What are the main segments of the Occlusion Devices Industry?
The market segments include Product, Application, End User.
4. Can you provide details about the market size?
The market size is estimated to be USD XX Million as of 2022.
5. What are some drivers contributing to market growth?
Rising Adoption of Minimally Invasive Surgeries; Increasing Geriatric Population and Rising Burden of Chronic Diseases; Technological Advancements.
6. What are the notable trends driving market growth?
Neurology Segment is Expected to Witness a Lucrative Growth.
7. Are there any restraints impacting market growth?
High Cost of the Products; Requirement of Skilled Professionals.
8. Can you provide examples of recent developments in the market?
June 2022: A fourth-generation flow diverter with Shield Technology, PipelineTM Vantage, was launched by India Medtronic Private Limited, a fully owned subsidiary of Medtronic PLC, for the endovascular treatment of brain aneurysms. The novel flow diverter called Pipeline Vantage with Shield Technology has improved design features for both the delivery system and the implant.
9. What pricing options are available for accessing the report?
Pricing options include single-user, multi-user, and enterprise licenses priced at USD 4750, USD 5250, and USD 8750 respectively.
10. Is the market size provided in terms of value or volume?
The market size is provided in terms of value, measured in Million and volume, measured in K Unit.
11. Are there any specific market keywords associated with the report?
Yes, the market keyword associated with the report is "Occlusion Devices Industry," which aids in identifying and referencing the specific market segment covered.
12. How do I determine which pricing option suits my needs best?
The pricing options vary based on user requirements and access needs. Individual users may opt for single-user licenses, while businesses requiring broader access may choose multi-user or enterprise licenses for cost-effective access to the report.
13. Are there any additional resources or data provided in the Occlusion Devices Industry report?
While the report offers comprehensive insights, it's advisable to review the specific contents or supplementary materials provided to ascertain if additional resources or data are available.
14. How can I stay updated on further developments or reports in the Occlusion Devices Industry?
To stay informed about further developments, trends, and reports in the Occlusion Devices Industry, consider subscribing to industry newsletters, following relevant companies and organizations, or regularly checking reputable industry news sources and publications.
Methodology
Step 1 - Identification of Relevant Samples Size from Population Database


Step 2 - Approaches for Defining Global Market Size (Value, Volume* & Price*)

Note*: In applicable scenarios
Step 3 - Data Sources
Primary Research
- Web Analytics
- Survey Reports
- Research Institute
- Latest Research Reports
- Opinion Leaders
Secondary Research
- Annual Reports
- White Paper
- Latest Press Release
- Industry Association
- Paid Database
- Investor Presentations

Step 4 - Data Triangulation
Involves using different sources of information in order to increase the validity of a study
These sources are likely to be stakeholders in a program - participants, other researchers, program staff, other community members, and so on.
Then we put all data in single framework & apply various statistical tools to find out the dynamic on the market.
During the analysis stage, feedback from the stakeholder groups would be compared to determine areas of agreement as well as areas of divergence


