
Key Insights
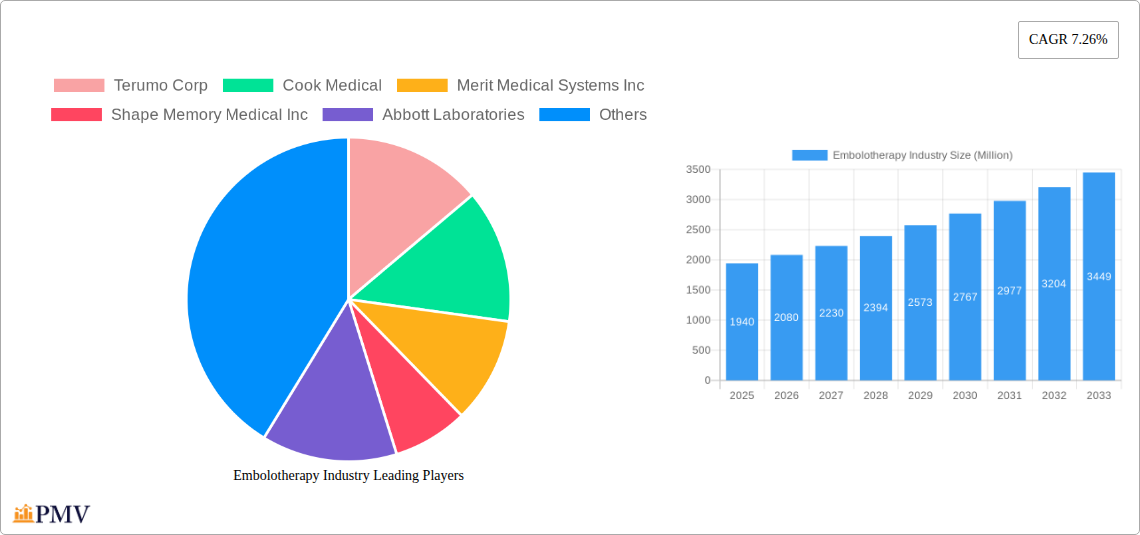
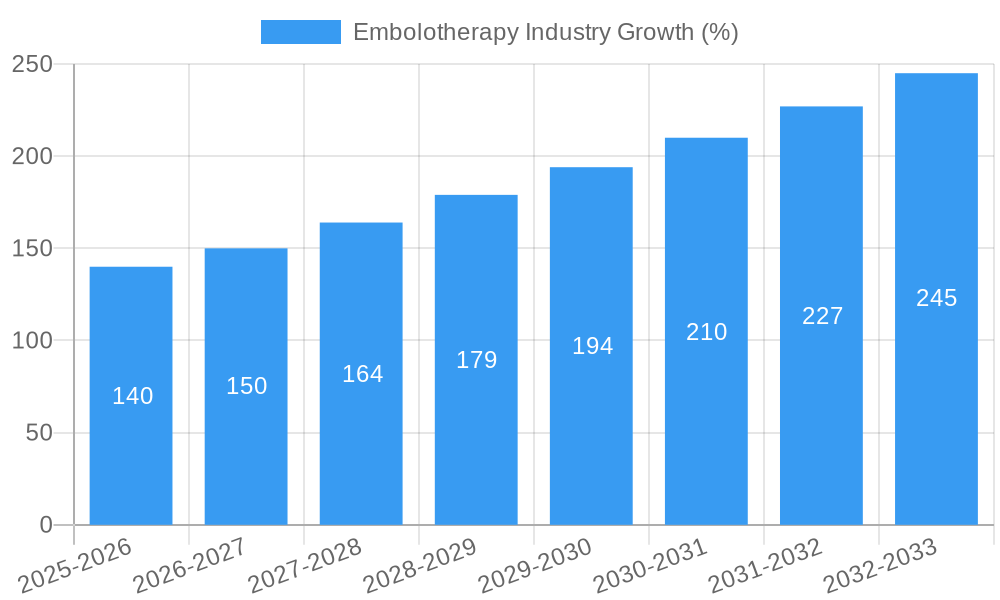
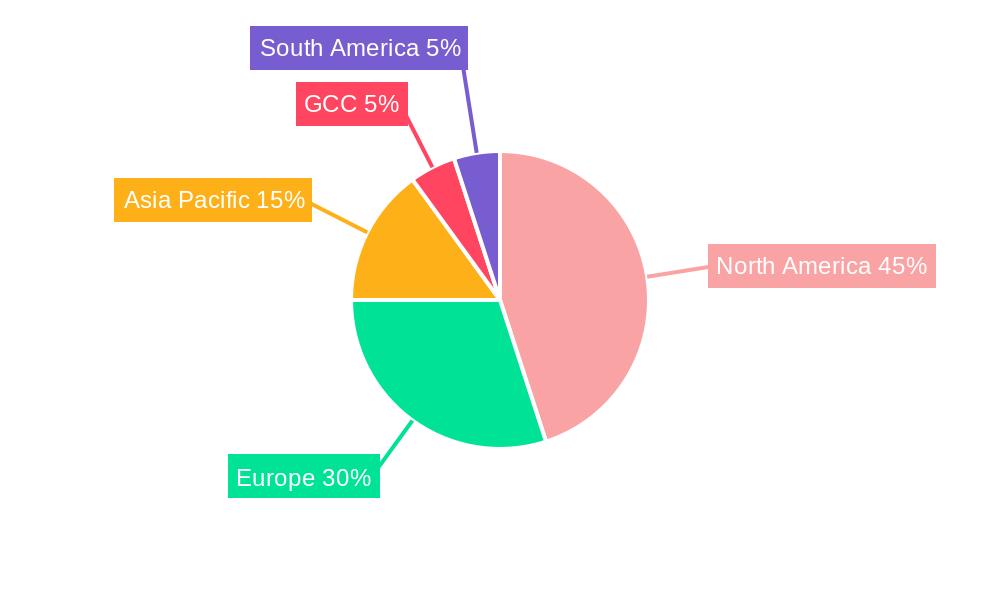
The global embolization therapy market, valued at $1.94 billion in 2025, is projected to experience robust growth, driven by a rising prevalence of cardiovascular diseases, increasing cancer incidence, and advancements in minimally invasive procedures. The 7.26% CAGR from 2019 to 2025 indicates a consistent upward trajectory, and this growth is expected to continue throughout the forecast period (2025-2033). Key drivers include the expanding geriatric population susceptible to vascular diseases, technological innovations leading to improved device efficacy and safety, and a growing preference for less-invasive treatment options. The market is segmented by embolization technique (coiling devices and non-coiling devices) and application (peripheral vascular disease, oncology, neurology, urology, and other applications). Peripheral vascular disease is currently the largest application segment, but oncology and neurology are experiencing rapid growth due to increasing procedural success rates and better patient outcomes. Competitive landscape analysis reveals key players like Terumo, Cook Medical, Merit Medical, and Medtronic, among others, constantly striving for innovation and market share through strategic partnerships, acquisitions, and product launches. Geographical distribution shows North America currently dominating the market, owing to advanced healthcare infrastructure and higher adoption rates of embolization therapies. However, Asia-Pacific is expected to show significant growth due to increasing awareness, improving healthcare infrastructure, and rising disposable incomes.
The continued growth of the embolization therapy market is contingent upon several factors. Regulatory approvals for innovative devices, expanding reimbursement policies, and ongoing research and development efforts will all play a crucial role. Furthermore, the increasing focus on personalized medicine and the development of targeted embolization therapies will create new opportunities. However, potential restraints include the relatively high cost of procedures, potential complications associated with the procedures, and the availability of alternative treatment options. Nevertheless, the market's overall trajectory is positive, fueled by a growing need for effective and minimally invasive treatments for a broad range of vascular and oncological conditions. The forecast period suggests sustained growth driven by technological advancements and increasing global demand.
Embolotherapy Industry Market Report: 2019-2033
This comprehensive report provides an in-depth analysis of the global Embolotherapy industry, offering valuable insights for stakeholders, investors, and industry professionals. The report covers the period from 2019 to 2033, with a focus on the forecast period of 2025-2033, using 2025 as the base year. The total market size is projected to reach xx Million by 2033, showcasing significant growth potential. This report is indispensable for understanding the market dynamics, competitive landscape, and future trends within this rapidly evolving sector.
Embolotherapy Industry Market Structure & Competitive Dynamics
The global embolotherapy market is characterized by a moderately concentrated structure with several key players holding significant market share. The top 10 companies—Terumo Corp, Cook Medical, Merit Medical Systems Inc, Shape Memory Medical Inc, Abbott Laboratories, Medtronic PLC, Johnson & Johnson (CERENOVUS), B. Braun Melsungen AG, Stryker Corporation, and Boston Scientific Corporation—account for an estimated 65% of the market share in 2025. These companies engage in intense competition, focusing on product innovation, strategic partnerships, and acquisitions to enhance their market position.
The industry's innovation ecosystem is vibrant, with ongoing research and development leading to the introduction of advanced embolization devices and techniques. Regulatory frameworks, primarily driven by agencies like the FDA, play a crucial role in ensuring product safety and efficacy. The existence of substitute therapies, such as surgical interventions, influences market dynamics. End-user trends, particularly the increasing prevalence of target conditions like peripheral vascular disease, fuel market growth.
Mergers and acquisitions (M&A) activity within the embolotherapy sector is relatively frequent. While precise M&A deal values are confidential, deals are largely driven by the acquisition of innovative technologies and expansion into new markets. For example, a significant M&A deal in 2024 involving xx involved a transaction valued at approximately xx Million, demonstrating the appetite for consolidation within the industry. These acquisitions often lead to increased market share and portfolio diversification for acquirers.
Embolotherapy Industry Industry Trends & Insights
The global embolotherapy market is experiencing robust growth, driven by several key factors. The increasing prevalence of cardiovascular diseases, particularly peripheral arterial disease (PAD) and stroke, is a major growth catalyst. Technological advancements, such as the development of minimally invasive embolization techniques and improved device designs, have significantly enhanced treatment outcomes, boosting market adoption. A rising geriatric population, particularly susceptible to vascular diseases, further fuels market expansion. The changing consumer preferences toward less invasive procedures are also positively influencing the growth of the market.
The market exhibits a Compound Annual Growth Rate (CAGR) of approximately 8% during the forecast period (2025-2033). Market penetration of embolotherapy procedures continues to rise in both developed and emerging economies, particularly in regions with improved healthcare infrastructure and increasing awareness regarding minimally invasive therapies. However, high treatment costs and the need for skilled professionals remain as challenges. The competitive landscape is characterized by continuous innovation and strategic partnerships among key players to maintain their market share and expand their product portfolios.
Dominant Markets & Segments in Embolotherapy Industry
The North American market holds the leading position in the global embolotherapy industry, driven by factors such as higher healthcare expenditure, advanced medical infrastructure, and the early adoption of new technologies. Europe follows as the second-largest market. The Asia-Pacific region, while presently smaller, demonstrates significant growth potential due to rising healthcare investments and increasing prevalence of target diseases.
Dominant Segments:
Embolization Technique: Coiling devices currently dominate the market, owing to their widespread use and established efficacy. However, the non-coiling devices segment is experiencing faster growth due to technological advancements and the introduction of novel devices that offer improved performance characteristics.
Application: Peripheral vascular disease (PVD) remains the largest application segment, accounting for xx% of the market, driven by the high prevalence of PAD. Oncology applications are also showing significant growth, fueled by the increasing use of embolization techniques for cancer treatment. Neurology, particularly for the treatment of brain aneurysms, is a rapidly expanding segment. Urology and other applications, while smaller, contribute to the overall market size.
Key Drivers for Dominance:
- North America: High healthcare spending, advanced infrastructure, technological adoption.
- Peripheral Vascular Disease: High prevalence of PAD, increasing awareness, and minimal invasiveness.
- Coiling Devices: Established efficacy, widespread use, and availability.
Embolotherapy Industry Product Innovations
Recent advancements in embolotherapy have focused on developing more precise, less invasive, and safer devices. This includes the introduction of biodegradable embolic agents, which eliminate the need for subsequent removal procedures and reduce the risk of complications. The development of embolic coils with improved design and material properties has enhanced their efficacy and reduced the likelihood of migration. Furthermore, the integration of imaging technologies into embolization procedures is enhancing precision and minimizing invasiveness. These innovations are driving market expansion by improving clinical outcomes and patient satisfaction.
Report Segmentation & Scope
This report segments the embolotherapy market based on embolization technique (coiling devices and non-coiling devices) and application (peripheral vascular disease, oncology, neurology, urology, and other applications). Each segment is analyzed in detail, providing market size, growth projections, and competitive dynamics.
Embolization Technique: The coiling devices segment currently holds a larger market share due to established clinical practice and extensive product availability. However, non-coiling devices are expected to experience higher growth rates due to advancements in materials and improved designs.
Application: The peripheral vascular disease segment is expected to continue dominating due to its high prevalence. Oncology and neurology applications are expected to witness significant growth, driven by increasing adoption of embolization techniques in cancer treatment and neurovascular interventions.
Key Drivers of Embolotherapy Industry Growth
Several factors drive the embolotherapy market's growth. These include:
- Rising Prevalence of Target Diseases: The increasing incidence of cardiovascular diseases and cancer fuels demand for embolization therapies.
- Technological Advancements: Innovations in device design and minimally invasive techniques enhance treatment outcomes.
- Favorable Regulatory Environment: Regulatory approvals of new devices and reimbursement policies support market expansion.
- Growing Healthcare Expenditure: Increased investment in healthcare infrastructure globally, especially in emerging markets, boosts market adoption.
Challenges in the Embolotherapy Industry Sector
Despite its significant growth, the embolotherapy industry faces challenges such as:
- High Treatment Costs: The expense of procedures and devices can limit accessibility for some patients.
- Skilled Professionals: The need for highly trained specialists may create regional disparities in service availability.
- Competition: The presence of established players and emerging competitors creates an intensely competitive environment.
- Regulatory Hurdles: Strict regulatory pathways can delay product launches and limit market access. Supply chain disruptions can also impact product availability and increase costs.
Leading Players in the Embolotherapy Industry Market
- Terumo Corp
- Cook Medical
- Merit Medical Systems Inc
- Shape Memory Medical Inc
- Abbott Laboratories
- Medtronic PLC
- Johnson & Johnson (CERENOVUS)
- B. Braun Melsungen AG
- Stryker Corporation
- Boston Scientific Corporation
- W. L. Gore & Associates Inc
- Penumbra Inc
Key Developments in Embolotherapy Industry Sector
- July 2021: Terumo Medical Corporation (TMC) introduces the AZUR Vascular Plug, compatible with microcatheters to occlude arteries up to 8mm.
- April 2021: The FDA approves Medtronic PLC's Pipeline Flex Embolization Device with Shield Technology for brain aneurysms.
Strategic Embolotherapy Industry Market Outlook
The embolotherapy market is poised for continued expansion, driven by technological innovation, increasing prevalence of target diseases, and growing healthcare spending. Strategic opportunities exist for companies focused on developing innovative devices, expanding into emerging markets, and establishing strategic partnerships. Companies that can effectively address the challenges of high treatment costs and the need for skilled professionals will be well-positioned to capture significant market share in the coming years. The focus will be on improved device designs, personalized medicine, and enhanced delivery systems to cater to a broader patient population and improve treatment efficacy.
Embolotherapy Industry Segmentation
-
1. Embolization Technique
- 1.1. Coiling Devices
- 1.2. Non-coiling Devices
-
2. Application
- 2.1. Peripheral Vascular Disease
- 2.2. Oncology
- 2.3. Neurology
- 2.4. Urology
- 2.5. Other Applications
Embolotherapy Industry Segmentation By Geography
-
1. North America
- 1.1. United States
- 1.2. Canada
- 1.3. Mexico
-
2. Europe
- 2.1. Germany
- 2.2. United Kingdom
- 2.3. France
- 2.4. Italy
- 2.5. Spain
- 2.6. Rest of Europe
-
3. Asia Pacific
- 3.1. China
- 3.2. Japan
- 3.3. India
- 3.4. Australia
- 3.5. South Korea
- 3.6. Rest of Asia Pacific
- 4. Middle East
-
5. GCC
- 5.1. South Africa
- 5.2. Rest of Middle East
-
6. South America
- 6.1. Brazil
- 6.2. Argentina
- 6.3. Rest of South America
Embolotherapy Industry REPORT HIGHLIGHTS
| Aspects | Details |
|---|---|
| Study Period | 2019-2033 |
| Base Year | 2024 |
| Estimated Year | 2025 |
| Forecast Period | 2025-2033 |
| Historical Period | 2019-2024 |
| Growth Rate | CAGR of 7.26% from 2019-2033 |
| Segmentation |
|
Table of Contents
- 1. Introduction
- 1.1. Research Scope
- 1.2. Market Segmentation
- 1.3. Research Methodology
- 1.4. Definitions and Assumptions
- 2. Executive Summary
- 2.1. Introduction
- 3. Market Dynamics
- 3.1. Introduction
- 3.2. Market Drivers
- 3.2.1. Increasing Prevalence of Vascular Diseases; Technological Advancements in Embolization Products and Procedures; Increasing Research and Development Activities
- 3.3. Market Restrains
- 3.3.1. High Costs Associated with Embolization Procedures; Stringent Regulatory Norms; Complications Associated with Embolization Procedures
- 3.4. Market Trends
- 3.4.1. The Non-coiling Devices Segment is Expected to Hold a Major Market Share in the Vascular Embolization Market over the Forecast Period
- 4. Market Factor Analysis
- 4.1. Porters Five Forces
- 4.2. Supply/Value Chain
- 4.3. PESTEL analysis
- 4.4. Market Entropy
- 4.5. Patent/Trademark Analysis
- 5. Global Embolotherapy Industry Analysis, Insights and Forecast, 2019-2031
- 5.1. Market Analysis, Insights and Forecast - by Embolization Technique
- 5.1.1. Coiling Devices
- 5.1.2. Non-coiling Devices
- 5.2. Market Analysis, Insights and Forecast - by Application
- 5.2.1. Peripheral Vascular Disease
- 5.2.2. Oncology
- 5.2.3. Neurology
- 5.2.4. Urology
- 5.2.5. Other Applications
- 5.3. Market Analysis, Insights and Forecast - by Region
- 5.3.1. North America
- 5.3.2. Europe
- 5.3.3. Asia Pacific
- 5.3.4. Middle East
- 5.3.5. GCC
- 5.3.6. South America
- 5.1. Market Analysis, Insights and Forecast - by Embolization Technique
- 6. North America Embolotherapy Industry Analysis, Insights and Forecast, 2019-2031
- 6.1. Market Analysis, Insights and Forecast - by Embolization Technique
- 6.1.1. Coiling Devices
- 6.1.2. Non-coiling Devices
- 6.2. Market Analysis, Insights and Forecast - by Application
- 6.2.1. Peripheral Vascular Disease
- 6.2.2. Oncology
- 6.2.3. Neurology
- 6.2.4. Urology
- 6.2.5. Other Applications
- 6.1. Market Analysis, Insights and Forecast - by Embolization Technique
- 7. Europe Embolotherapy Industry Analysis, Insights and Forecast, 2019-2031
- 7.1. Market Analysis, Insights and Forecast - by Embolization Technique
- 7.1.1. Coiling Devices
- 7.1.2. Non-coiling Devices
- 7.2. Market Analysis, Insights and Forecast - by Application
- 7.2.1. Peripheral Vascular Disease
- 7.2.2. Oncology
- 7.2.3. Neurology
- 7.2.4. Urology
- 7.2.5. Other Applications
- 7.1. Market Analysis, Insights and Forecast - by Embolization Technique
- 8. Asia Pacific Embolotherapy Industry Analysis, Insights and Forecast, 2019-2031
- 8.1. Market Analysis, Insights and Forecast - by Embolization Technique
- 8.1.1. Coiling Devices
- 8.1.2. Non-coiling Devices
- 8.2. Market Analysis, Insights and Forecast - by Application
- 8.2.1. Peripheral Vascular Disease
- 8.2.2. Oncology
- 8.2.3. Neurology
- 8.2.4. Urology
- 8.2.5. Other Applications
- 8.1. Market Analysis, Insights and Forecast - by Embolization Technique
- 9. Middle East Embolotherapy Industry Analysis, Insights and Forecast, 2019-2031
- 9.1. Market Analysis, Insights and Forecast - by Embolization Technique
- 9.1.1. Coiling Devices
- 9.1.2. Non-coiling Devices
- 9.2. Market Analysis, Insights and Forecast - by Application
- 9.2.1. Peripheral Vascular Disease
- 9.2.2. Oncology
- 9.2.3. Neurology
- 9.2.4. Urology
- 9.2.5. Other Applications
- 9.1. Market Analysis, Insights and Forecast - by Embolization Technique
- 10. GCC Embolotherapy Industry Analysis, Insights and Forecast, 2019-2031
- 10.1. Market Analysis, Insights and Forecast - by Embolization Technique
- 10.1.1. Coiling Devices
- 10.1.2. Non-coiling Devices
- 10.2. Market Analysis, Insights and Forecast - by Application
- 10.2.1. Peripheral Vascular Disease
- 10.2.2. Oncology
- 10.2.3. Neurology
- 10.2.4. Urology
- 10.2.5. Other Applications
- 10.1. Market Analysis, Insights and Forecast - by Embolization Technique
- 11. South America Embolotherapy Industry Analysis, Insights and Forecast, 2019-2031
- 11.1. Market Analysis, Insights and Forecast - by Embolization Technique
- 11.1.1. Coiling Devices
- 11.1.2. Non-coiling Devices
- 11.2. Market Analysis, Insights and Forecast - by Application
- 11.2.1. Peripheral Vascular Disease
- 11.2.2. Oncology
- 11.2.3. Neurology
- 11.2.4. Urology
- 11.2.5. Other Applications
- 11.1. Market Analysis, Insights and Forecast - by Embolization Technique
- 12. North America Embolotherapy Industry Analysis, Insights and Forecast, 2019-2031
- 12.1. Market Analysis, Insights and Forecast - By Country/Sub-region
- 12.1.1. undefined
- 13. Europe Embolotherapy Industry Analysis, Insights and Forecast, 2019-2031
- 13.1. Market Analysis, Insights and Forecast - By Country/Sub-region
- 13.1.1. undefined
- 14. Asia Pacific Embolotherapy Industry Analysis, Insights and Forecast, 2019-2031
- 14.1. Market Analysis, Insights and Forecast - By Country/Sub-region
- 14.1.1. undefined
- 15. GCC Embolotherapy Industry Analysis, Insights and Forecast, 2019-2031
- 15.1. Market Analysis, Insights and Forecast - By Country/Sub-region
- 15.1.1. undefined
- 16. South America Embolotherapy Industry Analysis, Insights and Forecast, 2019-2031
- 16.1. Market Analysis, Insights and Forecast - By Country/Sub-region
- 16.1.1. undefined
- 17. Competitive Analysis
- 17.1. Global Market Share Analysis 2024
- 17.2. Company Profiles
- 17.2.1 Terumo Corp
- 17.2.1.1. Overview
- 17.2.1.2. Products
- 17.2.1.3. SWOT Analysis
- 17.2.1.4. Recent Developments
- 17.2.1.5. Financials (Based on Availability)
- 17.2.2 Cook Medical
- 17.2.2.1. Overview
- 17.2.2.2. Products
- 17.2.2.3. SWOT Analysis
- 17.2.2.4. Recent Developments
- 17.2.2.5. Financials (Based on Availability)
- 17.2.3 Merit Medical Systems Inc
- 17.2.3.1. Overview
- 17.2.3.2. Products
- 17.2.3.3. SWOT Analysis
- 17.2.3.4. Recent Developments
- 17.2.3.5. Financials (Based on Availability)
- 17.2.4 Shape Memory Medical Inc
- 17.2.4.1. Overview
- 17.2.4.2. Products
- 17.2.4.3. SWOT Analysis
- 17.2.4.4. Recent Developments
- 17.2.4.5. Financials (Based on Availability)
- 17.2.5 Abbott Laboratories
- 17.2.5.1. Overview
- 17.2.5.2. Products
- 17.2.5.3. SWOT Analysis
- 17.2.5.4. Recent Developments
- 17.2.5.5. Financials (Based on Availability)
- 17.2.6 Medtronic PLC
- 17.2.6.1. Overview
- 17.2.6.2. Products
- 17.2.6.3. SWOT Analysis
- 17.2.6.4. Recent Developments
- 17.2.6.5. Financials (Based on Availability)
- 17.2.7 Johnson and Johnson (CERENOVUS)
- 17.2.7.1. Overview
- 17.2.7.2. Products
- 17.2.7.3. SWOT Analysis
- 17.2.7.4. Recent Developments
- 17.2.7.5. Financials (Based on Availability)
- 17.2.8 B Braun Melsungen AG
- 17.2.8.1. Overview
- 17.2.8.2. Products
- 17.2.8.3. SWOT Analysis
- 17.2.8.4. Recent Developments
- 17.2.8.5. Financials (Based on Availability)
- 17.2.9 Stryker Corporation
- 17.2.9.1. Overview
- 17.2.9.2. Products
- 17.2.9.3. SWOT Analysis
- 17.2.9.4. Recent Developments
- 17.2.9.5. Financials (Based on Availability)
- 17.2.10 Boston Scientific Corporation
- 17.2.10.1. Overview
- 17.2.10.2. Products
- 17.2.10.3. SWOT Analysis
- 17.2.10.4. Recent Developments
- 17.2.10.5. Financials (Based on Availability)
- 17.2.11 W L Gore & Associates Inc
- 17.2.11.1. Overview
- 17.2.11.2. Products
- 17.2.11.3. SWOT Analysis
- 17.2.11.4. Recent Developments
- 17.2.11.5. Financials (Based on Availability)
- 17.2.12 Penumbra Inc
- 17.2.12.1. Overview
- 17.2.12.2. Products
- 17.2.12.3. SWOT Analysis
- 17.2.12.4. Recent Developments
- 17.2.12.5. Financials (Based on Availability)
- 17.2.1 Terumo Corp
List of Figures
- Figure 1: Global Embolotherapy Industry Revenue Breakdown (Million, %) by Region 2024 & 2032
- Figure 2: Global Embolotherapy Industry Volume Breakdown (K Unit, %) by Region 2024 & 2032
- Figure 3: North America Embolotherapy Industry Revenue (Million), by Country 2024 & 2032
- Figure 4: North America Embolotherapy Industry Volume (K Unit), by Country 2024 & 2032
- Figure 5: North America Embolotherapy Industry Revenue Share (%), by Country 2024 & 2032
- Figure 6: North America Embolotherapy Industry Volume Share (%), by Country 2024 & 2032
- Figure 7: Europe Embolotherapy Industry Revenue (Million), by Country 2024 & 2032
- Figure 8: Europe Embolotherapy Industry Volume (K Unit), by Country 2024 & 2032
- Figure 9: Europe Embolotherapy Industry Revenue Share (%), by Country 2024 & 2032
- Figure 10: Europe Embolotherapy Industry Volume Share (%), by Country 2024 & 2032
- Figure 11: Asia Pacific Embolotherapy Industry Revenue (Million), by Country 2024 & 2032
- Figure 12: Asia Pacific Embolotherapy Industry Volume (K Unit), by Country 2024 & 2032
- Figure 13: Asia Pacific Embolotherapy Industry Revenue Share (%), by Country 2024 & 2032
- Figure 14: Asia Pacific Embolotherapy Industry Volume Share (%), by Country 2024 & 2032
- Figure 15: GCC Embolotherapy Industry Revenue (Million), by Country 2024 & 2032
- Figure 16: GCC Embolotherapy Industry Volume (K Unit), by Country 2024 & 2032
- Figure 17: GCC Embolotherapy Industry Revenue Share (%), by Country 2024 & 2032
- Figure 18: GCC Embolotherapy Industry Volume Share (%), by Country 2024 & 2032
- Figure 19: South America Embolotherapy Industry Revenue (Million), by Country 2024 & 2032
- Figure 20: South America Embolotherapy Industry Volume (K Unit), by Country 2024 & 2032
- Figure 21: South America Embolotherapy Industry Revenue Share (%), by Country 2024 & 2032
- Figure 22: South America Embolotherapy Industry Volume Share (%), by Country 2024 & 2032
- Figure 23: North America Embolotherapy Industry Revenue (Million), by Embolization Technique 2024 & 2032
- Figure 24: North America Embolotherapy Industry Volume (K Unit), by Embolization Technique 2024 & 2032
- Figure 25: North America Embolotherapy Industry Revenue Share (%), by Embolization Technique 2024 & 2032
- Figure 26: North America Embolotherapy Industry Volume Share (%), by Embolization Technique 2024 & 2032
- Figure 27: North America Embolotherapy Industry Revenue (Million), by Application 2024 & 2032
- Figure 28: North America Embolotherapy Industry Volume (K Unit), by Application 2024 & 2032
- Figure 29: North America Embolotherapy Industry Revenue Share (%), by Application 2024 & 2032
- Figure 30: North America Embolotherapy Industry Volume Share (%), by Application 2024 & 2032
- Figure 31: North America Embolotherapy Industry Revenue (Million), by Country 2024 & 2032
- Figure 32: North America Embolotherapy Industry Volume (K Unit), by Country 2024 & 2032
- Figure 33: North America Embolotherapy Industry Revenue Share (%), by Country 2024 & 2032
- Figure 34: North America Embolotherapy Industry Volume Share (%), by Country 2024 & 2032
- Figure 35: Europe Embolotherapy Industry Revenue (Million), by Embolization Technique 2024 & 2032
- Figure 36: Europe Embolotherapy Industry Volume (K Unit), by Embolization Technique 2024 & 2032
- Figure 37: Europe Embolotherapy Industry Revenue Share (%), by Embolization Technique 2024 & 2032
- Figure 38: Europe Embolotherapy Industry Volume Share (%), by Embolization Technique 2024 & 2032
- Figure 39: Europe Embolotherapy Industry Revenue (Million), by Application 2024 & 2032
- Figure 40: Europe Embolotherapy Industry Volume (K Unit), by Application 2024 & 2032
- Figure 41: Europe Embolotherapy Industry Revenue Share (%), by Application 2024 & 2032
- Figure 42: Europe Embolotherapy Industry Volume Share (%), by Application 2024 & 2032
- Figure 43: Europe Embolotherapy Industry Revenue (Million), by Country 2024 & 2032
- Figure 44: Europe Embolotherapy Industry Volume (K Unit), by Country 2024 & 2032
- Figure 45: Europe Embolotherapy Industry Revenue Share (%), by Country 2024 & 2032
- Figure 46: Europe Embolotherapy Industry Volume Share (%), by Country 2024 & 2032
- Figure 47: Asia Pacific Embolotherapy Industry Revenue (Million), by Embolization Technique 2024 & 2032
- Figure 48: Asia Pacific Embolotherapy Industry Volume (K Unit), by Embolization Technique 2024 & 2032
- Figure 49: Asia Pacific Embolotherapy Industry Revenue Share (%), by Embolization Technique 2024 & 2032
- Figure 50: Asia Pacific Embolotherapy Industry Volume Share (%), by Embolization Technique 2024 & 2032
- Figure 51: Asia Pacific Embolotherapy Industry Revenue (Million), by Application 2024 & 2032
- Figure 52: Asia Pacific Embolotherapy Industry Volume (K Unit), by Application 2024 & 2032
- Figure 53: Asia Pacific Embolotherapy Industry Revenue Share (%), by Application 2024 & 2032
- Figure 54: Asia Pacific Embolotherapy Industry Volume Share (%), by Application 2024 & 2032
- Figure 55: Asia Pacific Embolotherapy Industry Revenue (Million), by Country 2024 & 2032
- Figure 56: Asia Pacific Embolotherapy Industry Volume (K Unit), by Country 2024 & 2032
- Figure 57: Asia Pacific Embolotherapy Industry Revenue Share (%), by Country 2024 & 2032
- Figure 58: Asia Pacific Embolotherapy Industry Volume Share (%), by Country 2024 & 2032
- Figure 59: Middle East Embolotherapy Industry Revenue (Million), by Embolization Technique 2024 & 2032
- Figure 60: Middle East Embolotherapy Industry Volume (K Unit), by Embolization Technique 2024 & 2032
- Figure 61: Middle East Embolotherapy Industry Revenue Share (%), by Embolization Technique 2024 & 2032
- Figure 62: Middle East Embolotherapy Industry Volume Share (%), by Embolization Technique 2024 & 2032
- Figure 63: Middle East Embolotherapy Industry Revenue (Million), by Application 2024 & 2032
- Figure 64: Middle East Embolotherapy Industry Volume (K Unit), by Application 2024 & 2032
- Figure 65: Middle East Embolotherapy Industry Revenue Share (%), by Application 2024 & 2032
- Figure 66: Middle East Embolotherapy Industry Volume Share (%), by Application 2024 & 2032
- Figure 67: Middle East Embolotherapy Industry Revenue (Million), by Country 2024 & 2032
- Figure 68: Middle East Embolotherapy Industry Volume (K Unit), by Country 2024 & 2032
- Figure 69: Middle East Embolotherapy Industry Revenue Share (%), by Country 2024 & 2032
- Figure 70: Middle East Embolotherapy Industry Volume Share (%), by Country 2024 & 2032
- Figure 71: GCC Embolotherapy Industry Revenue (Million), by Embolization Technique 2024 & 2032
- Figure 72: GCC Embolotherapy Industry Volume (K Unit), by Embolization Technique 2024 & 2032
- Figure 73: GCC Embolotherapy Industry Revenue Share (%), by Embolization Technique 2024 & 2032
- Figure 74: GCC Embolotherapy Industry Volume Share (%), by Embolization Technique 2024 & 2032
- Figure 75: GCC Embolotherapy Industry Revenue (Million), by Application 2024 & 2032
- Figure 76: GCC Embolotherapy Industry Volume (K Unit), by Application 2024 & 2032
- Figure 77: GCC Embolotherapy Industry Revenue Share (%), by Application 2024 & 2032
- Figure 78: GCC Embolotherapy Industry Volume Share (%), by Application 2024 & 2032
- Figure 79: GCC Embolotherapy Industry Revenue (Million), by Country 2024 & 2032
- Figure 80: GCC Embolotherapy Industry Volume (K Unit), by Country 2024 & 2032
- Figure 81: GCC Embolotherapy Industry Revenue Share (%), by Country 2024 & 2032
- Figure 82: GCC Embolotherapy Industry Volume Share (%), by Country 2024 & 2032
- Figure 83: South America Embolotherapy Industry Revenue (Million), by Embolization Technique 2024 & 2032
- Figure 84: South America Embolotherapy Industry Volume (K Unit), by Embolization Technique 2024 & 2032
- Figure 85: South America Embolotherapy Industry Revenue Share (%), by Embolization Technique 2024 & 2032
- Figure 86: South America Embolotherapy Industry Volume Share (%), by Embolization Technique 2024 & 2032
- Figure 87: South America Embolotherapy Industry Revenue (Million), by Application 2024 & 2032
- Figure 88: South America Embolotherapy Industry Volume (K Unit), by Application 2024 & 2032
- Figure 89: South America Embolotherapy Industry Revenue Share (%), by Application 2024 & 2032
- Figure 90: South America Embolotherapy Industry Volume Share (%), by Application 2024 & 2032
- Figure 91: South America Embolotherapy Industry Revenue (Million), by Country 2024 & 2032
- Figure 92: South America Embolotherapy Industry Volume (K Unit), by Country 2024 & 2032
- Figure 93: South America Embolotherapy Industry Revenue Share (%), by Country 2024 & 2032
- Figure 94: South America Embolotherapy Industry Volume Share (%), by Country 2024 & 2032
List of Tables
- Table 1: Global Embolotherapy Industry Revenue Million Forecast, by Region 2019 & 2032
- Table 2: Global Embolotherapy Industry Volume K Unit Forecast, by Region 2019 & 2032
- Table 3: Global Embolotherapy Industry Revenue Million Forecast, by Embolization Technique 2019 & 2032
- Table 4: Global Embolotherapy Industry Volume K Unit Forecast, by Embolization Technique 2019 & 2032
- Table 5: Global Embolotherapy Industry Revenue Million Forecast, by Application 2019 & 2032
- Table 6: Global Embolotherapy Industry Volume K Unit Forecast, by Application 2019 & 2032
- Table 7: Global Embolotherapy Industry Revenue Million Forecast, by Region 2019 & 2032
- Table 8: Global Embolotherapy Industry Volume K Unit Forecast, by Region 2019 & 2032
- Table 9: Global Embolotherapy Industry Revenue Million Forecast, by Country 2019 & 2032
- Table 10: Global Embolotherapy Industry Volume K Unit Forecast, by Country 2019 & 2032
- Table 11: Global Embolotherapy Industry Revenue Million Forecast, by Country 2019 & 2032
- Table 12: Global Embolotherapy Industry Volume K Unit Forecast, by Country 2019 & 2032
- Table 13: Global Embolotherapy Industry Revenue Million Forecast, by Country 2019 & 2032
- Table 14: Global Embolotherapy Industry Volume K Unit Forecast, by Country 2019 & 2032
- Table 15: Global Embolotherapy Industry Revenue Million Forecast, by Country 2019 & 2032
- Table 16: Global Embolotherapy Industry Volume K Unit Forecast, by Country 2019 & 2032
- Table 17: Global Embolotherapy Industry Revenue Million Forecast, by Country 2019 & 2032
- Table 18: Global Embolotherapy Industry Volume K Unit Forecast, by Country 2019 & 2032
- Table 19: Global Embolotherapy Industry Revenue Million Forecast, by Embolization Technique 2019 & 2032
- Table 20: Global Embolotherapy Industry Volume K Unit Forecast, by Embolization Technique 2019 & 2032
- Table 21: Global Embolotherapy Industry Revenue Million Forecast, by Application 2019 & 2032
- Table 22: Global Embolotherapy Industry Volume K Unit Forecast, by Application 2019 & 2032
- Table 23: Global Embolotherapy Industry Revenue Million Forecast, by Country 2019 & 2032
- Table 24: Global Embolotherapy Industry Volume K Unit Forecast, by Country 2019 & 2032
- Table 25: United States Embolotherapy Industry Revenue (Million) Forecast, by Application 2019 & 2032
- Table 26: United States Embolotherapy Industry Volume (K Unit) Forecast, by Application 2019 & 2032
- Table 27: Canada Embolotherapy Industry Revenue (Million) Forecast, by Application 2019 & 2032
- Table 28: Canada Embolotherapy Industry Volume (K Unit) Forecast, by Application 2019 & 2032
- Table 29: Mexico Embolotherapy Industry Revenue (Million) Forecast, by Application 2019 & 2032
- Table 30: Mexico Embolotherapy Industry Volume (K Unit) Forecast, by Application 2019 & 2032
- Table 31: Global Embolotherapy Industry Revenue Million Forecast, by Embolization Technique 2019 & 2032
- Table 32: Global Embolotherapy Industry Volume K Unit Forecast, by Embolization Technique 2019 & 2032
- Table 33: Global Embolotherapy Industry Revenue Million Forecast, by Application 2019 & 2032
- Table 34: Global Embolotherapy Industry Volume K Unit Forecast, by Application 2019 & 2032
- Table 35: Global Embolotherapy Industry Revenue Million Forecast, by Country 2019 & 2032
- Table 36: Global Embolotherapy Industry Volume K Unit Forecast, by Country 2019 & 2032
- Table 37: Germany Embolotherapy Industry Revenue (Million) Forecast, by Application 2019 & 2032
- Table 38: Germany Embolotherapy Industry Volume (K Unit) Forecast, by Application 2019 & 2032
- Table 39: United Kingdom Embolotherapy Industry Revenue (Million) Forecast, by Application 2019 & 2032
- Table 40: United Kingdom Embolotherapy Industry Volume (K Unit) Forecast, by Application 2019 & 2032
- Table 41: France Embolotherapy Industry Revenue (Million) Forecast, by Application 2019 & 2032
- Table 42: France Embolotherapy Industry Volume (K Unit) Forecast, by Application 2019 & 2032
- Table 43: Italy Embolotherapy Industry Revenue (Million) Forecast, by Application 2019 & 2032
- Table 44: Italy Embolotherapy Industry Volume (K Unit) Forecast, by Application 2019 & 2032
- Table 45: Spain Embolotherapy Industry Revenue (Million) Forecast, by Application 2019 & 2032
- Table 46: Spain Embolotherapy Industry Volume (K Unit) Forecast, by Application 2019 & 2032
- Table 47: Rest of Europe Embolotherapy Industry Revenue (Million) Forecast, by Application 2019 & 2032
- Table 48: Rest of Europe Embolotherapy Industry Volume (K Unit) Forecast, by Application 2019 & 2032
- Table 49: Global Embolotherapy Industry Revenue Million Forecast, by Embolization Technique 2019 & 2032
- Table 50: Global Embolotherapy Industry Volume K Unit Forecast, by Embolization Technique 2019 & 2032
- Table 51: Global Embolotherapy Industry Revenue Million Forecast, by Application 2019 & 2032
- Table 52: Global Embolotherapy Industry Volume K Unit Forecast, by Application 2019 & 2032
- Table 53: Global Embolotherapy Industry Revenue Million Forecast, by Country 2019 & 2032
- Table 54: Global Embolotherapy Industry Volume K Unit Forecast, by Country 2019 & 2032
- Table 55: China Embolotherapy Industry Revenue (Million) Forecast, by Application 2019 & 2032
- Table 56: China Embolotherapy Industry Volume (K Unit) Forecast, by Application 2019 & 2032
- Table 57: Japan Embolotherapy Industry Revenue (Million) Forecast, by Application 2019 & 2032
- Table 58: Japan Embolotherapy Industry Volume (K Unit) Forecast, by Application 2019 & 2032
- Table 59: India Embolotherapy Industry Revenue (Million) Forecast, by Application 2019 & 2032
- Table 60: India Embolotherapy Industry Volume (K Unit) Forecast, by Application 2019 & 2032
- Table 61: Australia Embolotherapy Industry Revenue (Million) Forecast, by Application 2019 & 2032
- Table 62: Australia Embolotherapy Industry Volume (K Unit) Forecast, by Application 2019 & 2032
- Table 63: South Korea Embolotherapy Industry Revenue (Million) Forecast, by Application 2019 & 2032
- Table 64: South Korea Embolotherapy Industry Volume (K Unit) Forecast, by Application 2019 & 2032
- Table 65: Rest of Asia Pacific Embolotherapy Industry Revenue (Million) Forecast, by Application 2019 & 2032
- Table 66: Rest of Asia Pacific Embolotherapy Industry Volume (K Unit) Forecast, by Application 2019 & 2032
- Table 67: Global Embolotherapy Industry Revenue Million Forecast, by Embolization Technique 2019 & 2032
- Table 68: Global Embolotherapy Industry Volume K Unit Forecast, by Embolization Technique 2019 & 2032
- Table 69: Global Embolotherapy Industry Revenue Million Forecast, by Application 2019 & 2032
- Table 70: Global Embolotherapy Industry Volume K Unit Forecast, by Application 2019 & 2032
- Table 71: Global Embolotherapy Industry Revenue Million Forecast, by Country 2019 & 2032
- Table 72: Global Embolotherapy Industry Volume K Unit Forecast, by Country 2019 & 2032
- Table 73: Global Embolotherapy Industry Revenue Million Forecast, by Embolization Technique 2019 & 2032
- Table 74: Global Embolotherapy Industry Volume K Unit Forecast, by Embolization Technique 2019 & 2032
- Table 75: Global Embolotherapy Industry Revenue Million Forecast, by Application 2019 & 2032
- Table 76: Global Embolotherapy Industry Volume K Unit Forecast, by Application 2019 & 2032
- Table 77: Global Embolotherapy Industry Revenue Million Forecast, by Country 2019 & 2032
- Table 78: Global Embolotherapy Industry Volume K Unit Forecast, by Country 2019 & 2032
- Table 79: South Africa Embolotherapy Industry Revenue (Million) Forecast, by Application 2019 & 2032
- Table 80: South Africa Embolotherapy Industry Volume (K Unit) Forecast, by Application 2019 & 2032
- Table 81: Rest of Middle East Embolotherapy Industry Revenue (Million) Forecast, by Application 2019 & 2032
- Table 82: Rest of Middle East Embolotherapy Industry Volume (K Unit) Forecast, by Application 2019 & 2032
- Table 83: Global Embolotherapy Industry Revenue Million Forecast, by Embolization Technique 2019 & 2032
- Table 84: Global Embolotherapy Industry Volume K Unit Forecast, by Embolization Technique 2019 & 2032
- Table 85: Global Embolotherapy Industry Revenue Million Forecast, by Application 2019 & 2032
- Table 86: Global Embolotherapy Industry Volume K Unit Forecast, by Application 2019 & 2032
- Table 87: Global Embolotherapy Industry Revenue Million Forecast, by Country 2019 & 2032
- Table 88: Global Embolotherapy Industry Volume K Unit Forecast, by Country 2019 & 2032
- Table 89: Brazil Embolotherapy Industry Revenue (Million) Forecast, by Application 2019 & 2032
- Table 90: Brazil Embolotherapy Industry Volume (K Unit) Forecast, by Application 2019 & 2032
- Table 91: Argentina Embolotherapy Industry Revenue (Million) Forecast, by Application 2019 & 2032
- Table 92: Argentina Embolotherapy Industry Volume (K Unit) Forecast, by Application 2019 & 2032
- Table 93: Rest of South America Embolotherapy Industry Revenue (Million) Forecast, by Application 2019 & 2032
- Table 94: Rest of South America Embolotherapy Industry Volume (K Unit) Forecast, by Application 2019 & 2032
Frequently Asked Questions
1. What is the projected Compound Annual Growth Rate (CAGR) of the Embolotherapy Industry?
The projected CAGR is approximately 7.26%.
2. Which companies are prominent players in the Embolotherapy Industry?
Key companies in the market include Terumo Corp, Cook Medical, Merit Medical Systems Inc, Shape Memory Medical Inc, Abbott Laboratories, Medtronic PLC, Johnson and Johnson (CERENOVUS), B Braun Melsungen AG, Stryker Corporation, Boston Scientific Corporation, W L Gore & Associates Inc , Penumbra Inc.
3. What are the main segments of the Embolotherapy Industry?
The market segments include Embolization Technique, Application.
4. Can you provide details about the market size?
The market size is estimated to be USD 1.94 Million as of 2022.
5. What are some drivers contributing to market growth?
Increasing Prevalence of Vascular Diseases; Technological Advancements in Embolization Products and Procedures; Increasing Research and Development Activities.
6. What are the notable trends driving market growth?
The Non-coiling Devices Segment is Expected to Hold a Major Market Share in the Vascular Embolization Market over the Forecast Period.
7. Are there any restraints impacting market growth?
High Costs Associated with Embolization Procedures; Stringent Regulatory Norms; Complications Associated with Embolization Procedures.
8. Can you provide examples of recent developments in the market?
In July 2021, Terumo Medical Corporation (TMC) has the introduction of its AZUR Vascular Plug, the first and only plug compatible with a microcatheter to occlude arteries up to 8mm in diameter. The newest addition to Terumo's robust embolization portfolio is indicated for use to reduce or block the rate of blood flow in arteries of the peripheral vasculature.
9. What pricing options are available for accessing the report?
Pricing options include single-user, multi-user, and enterprise licenses priced at USD 4750, USD 5250, and USD 8750 respectively.
10. Is the market size provided in terms of value or volume?
The market size is provided in terms of value, measured in Million and volume, measured in K Unit.
11. Are there any specific market keywords associated with the report?
Yes, the market keyword associated with the report is "Embolotherapy Industry," which aids in identifying and referencing the specific market segment covered.
12. How do I determine which pricing option suits my needs best?
The pricing options vary based on user requirements and access needs. Individual users may opt for single-user licenses, while businesses requiring broader access may choose multi-user or enterprise licenses for cost-effective access to the report.
13. Are there any additional resources or data provided in the Embolotherapy Industry report?
While the report offers comprehensive insights, it's advisable to review the specific contents or supplementary materials provided to ascertain if additional resources or data are available.
14. How can I stay updated on further developments or reports in the Embolotherapy Industry?
To stay informed about further developments, trends, and reports in the Embolotherapy Industry, consider subscribing to industry newsletters, following relevant companies and organizations, or regularly checking reputable industry news sources and publications.
Methodology
Step 1 - Identification of Relevant Samples Size from Population Database


Step 2 - Approaches for Defining Global Market Size (Value, Volume* & Price*)

Note*: In applicable scenarios
Step 3 - Data Sources
Primary Research
- Web Analytics
- Survey Reports
- Research Institute
- Latest Research Reports
- Opinion Leaders
Secondary Research
- Annual Reports
- White Paper
- Latest Press Release
- Industry Association
- Paid Database
- Investor Presentations

Step 4 - Data Triangulation
Involves using different sources of information in order to increase the validity of a study
These sources are likely to be stakeholders in a program - participants, other researchers, program staff, other community members, and so on.
Then we put all data in single framework & apply various statistical tools to find out the dynamic on the market.
During the analysis stage, feedback from the stakeholder groups would be compared to determine areas of agreement as well as areas of divergence


