
Key Insights
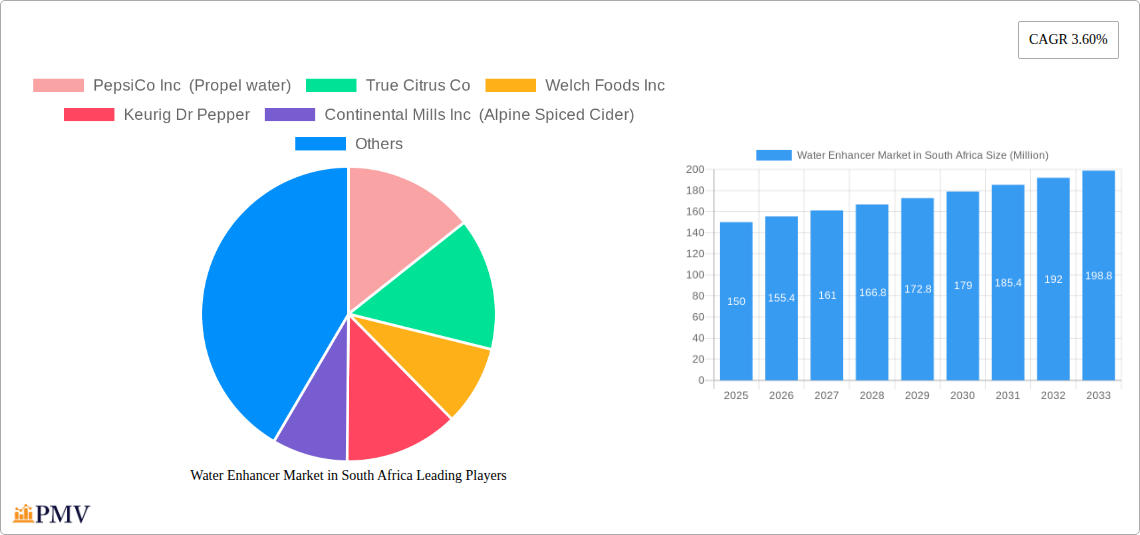
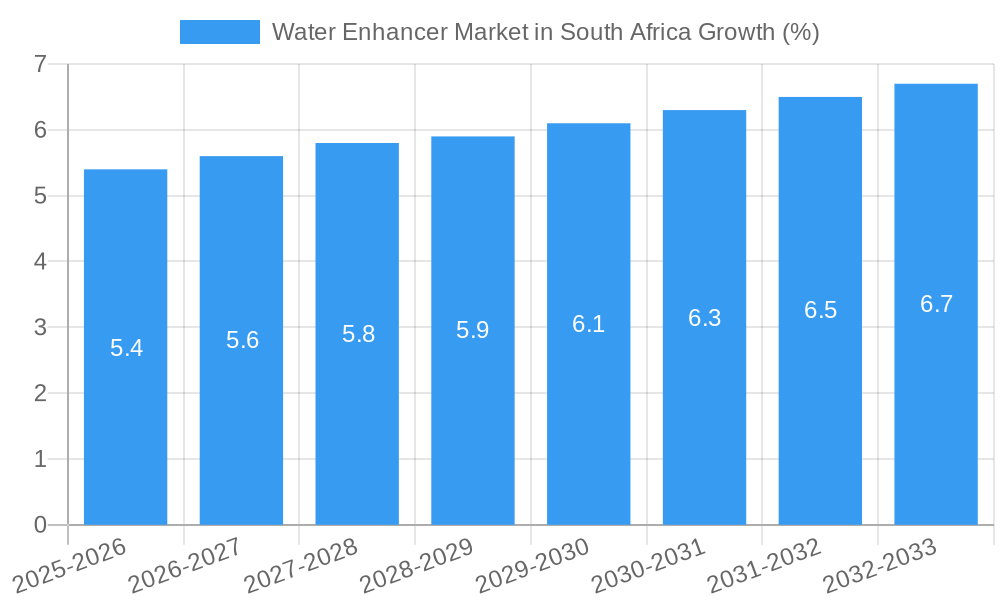
The South African water enhancer market, while exhibiting a smaller overall size compared to global markets, presents a compelling growth opportunity. With a projected CAGR of 3.60% from 2025 to 2033, the market is anticipated to experience steady expansion driven by increasing health consciousness among consumers, a rising preference for healthier beverage options, and the convenience offered by water enhancers in creating customized flavored drinks. The market is segmented by distribution channels, with hypermarkets/supermarkets currently holding the largest share, followed by convenience stores and a rapidly growing online segment. Key players like PepsiCo (Propel water), True Citrus Co, and Welch Foods Inc are actively competing in this space, introducing innovative flavors and formats to cater to evolving consumer tastes. The growth is further fueled by the increasing disposable income of the South African population and the rising popularity of fitness and wellness trends. However, factors like fluctuating raw material prices and potential economic instability could act as restraints on market growth. The increasing adoption of healthy lifestyle choices and increasing consumer awareness about added sugars in other beverages should provide significant impetus to further growth. Focusing on innovative flavors tailored to local preferences and expanding distribution networks, particularly within the growing online channels, will be crucial for market success in South Africa.
The relatively underdeveloped online segment provides significant potential for future expansion. Strategies focusing on e-commerce partnerships and targeted online marketing campaigns can effectively tap into this opportunity. Furthermore, collaborations with fitness centers and health-conscious communities can enhance brand visibility and drive consumer adoption. Given the diversity of the South African population, product diversification to cater to varied preferences is important. Offering both traditional and unique flavor profiles, as well as catering to specific dietary needs (e.g., low-sugar, organic options), will be essential to capture a wider market segment and maintain sustainable growth. Future growth will also depend on successful branding and marketing campaigns that highlight the health benefits and convenience of water enhancers compared to sugary drinks.
South Africa Water Enhancer Market Report: 2019-2033
This comprehensive report provides a detailed analysis of the South African water enhancer market, offering invaluable insights for businesses, investors, and stakeholders seeking to understand this dynamic sector. The study covers the period from 2019 to 2033, with a focus on the 2025-2033 forecast period. The report utilizes a robust methodology, incorporating both qualitative and quantitative data to provide a holistic view of the market. Key segments are analyzed, including distribution channels, and leading players such as PepsiCo Inc (Propel water), True Citrus Co, Welch Foods Inc, Keurig Dr Pepper, Continental Mills Inc (Alpine Spiced Cider), and Kraft Heinz Company are profiled. This report is essential for strategic decision-making and navigating the complexities of the South African water enhancer landscape.
Water Enhancer Market in South Africa Market Structure & Competitive Dynamics
The South African water enhancer market exhibits a moderately concentrated structure, with a few key players holding significant market share. The market is characterized by a dynamic innovation ecosystem, with ongoing product development focusing on novel flavors, functional benefits, and sustainable packaging. Regulatory frameworks concerning food and beverage safety and labeling significantly influence market operations. While direct substitutes like flavored syrups and fruit juices exist, the convenience and perceived health benefits of water enhancers contribute to market growth. Consumer preferences are shifting towards healthier, low-sugar options, driving innovation in product formulations. Mergers and acquisitions (M&A) activity within the industry has been relatively moderate in recent years, with deal values averaging xx Million in the 2019-2024 period. Key players are increasingly focusing on strategic partnerships to expand their distribution networks and market reach. Market share data for 2025 estimates PepsiCo Inc. at approximately 25%, followed by Keurig Dr Pepper at 18%, and Welch Foods Inc. at 15%. The remaining market share is distributed amongst other smaller players.
Water Enhancer Market in South Africa Industry Trends & Insights
The South African water enhancer market is experiencing robust growth, driven by several key factors. Increasing health consciousness among consumers is a primary driver, with demand for low-calorie and healthier beverage options surging. The convenience factor also plays a crucial role, as water enhancers offer a simple and quick way to add flavor to water. Technological advancements in flavoring technology and packaging are contributing to the market's expansion, with innovations in natural flavorings and sustainable packaging materials gaining traction. Consumer preferences are evolving, with a noticeable shift towards natural and organic ingredients. Competitive dynamics are intense, with established players constantly striving to innovate and launch new products to maintain their market share. The market's compound annual growth rate (CAGR) during the historical period (2019-2024) was estimated at 7%, and the projected CAGR for the forecast period (2025-2033) is 8%, indicating sustained market expansion. Market penetration remains relatively low, indicating significant untapped potential for future growth, estimated at 30% in 2025.
Dominant Markets & Segments in Water Enhancer Market in South Africa
Within the South African water enhancer market, the Hypermarkets/Supermarkets distribution channel dominates, capturing approximately 55% of the market share in 2025. This dominance is attributed to several key factors:
- Extensive reach: Hypermarkets and supermarkets provide widespread access to consumers across various regions.
- Established distribution networks: Well-established supply chains ensure efficient product distribution.
- Consumer behavior: Consumers frequently purchase water enhancers during their routine grocery shopping at these large retailers.
The convenience store segment is also significant, accounting for approximately 20% of the market share, primarily due to its accessibility and impulsive purchase nature. Online channels are exhibiting rapid growth but remain a smaller segment compared to the traditional channels. Other distribution channels (smaller retailers, direct sales) make up the remaining 25% of the market. Economic policies promoting healthy lifestyles and the development of retail infrastructure further contribute to the hypermarket/supermarket dominance. Urban areas, due to higher disposable incomes and greater access to retail outlets, exhibit the strongest market performance compared to rural regions.
Water Enhancer Market in South Africa Product Innovations
Recent product innovations in the South African water enhancer market focus on incorporating natural and organic ingredients, appealing to the growing health-conscious consumer base. Low-sugar and zero-sugar formulations are also gaining popularity, aligning with dietary preferences. Functional water enhancers, infused with vitamins or electrolytes, are emerging as a significant growth area. Companies are constantly exploring new flavor profiles, emphasizing both traditional and exotic taste combinations to cater to varied preferences. The adoption of eco-friendly packaging solutions is also gaining traction, improving the sustainability of the industry.
Report Segmentation & Scope
This report segments the South African water enhancer market primarily by distribution channel:
Hypermarkets/Supermarkets: This segment is projected to maintain its dominance, with a CAGR of 7% during the forecast period. Competitive intensity is high, with major players vying for shelf space and consumer attention.
Convenience Stores: This segment demonstrates consistent growth fueled by its convenience factor, with a projected CAGR of 6%. Smaller, localized brands are also thriving in this segment, capitalizing on regional preferences.
Online Channels: This segment exhibits substantial growth potential, with a projected CAGR of 12% owing to increasing e-commerce penetration. However, competition remains relatively moderate, offering opportunities for new entrants.
Other Distribution Channels: This segment encompasses diverse channels and is expected to experience modest growth (CAGR of 5%) due to its fragmented nature.
Key Drivers of Water Enhancer Market in South Africa Growth
Several factors drive the growth of the South African water enhancer market: The rising health-conscious population is seeking healthier beverage alternatives, a key driver. The convenience of easily enhancing water at home or on-the-go increases adoption rates. Innovative product development, with unique flavors and functional additions, caters to diverse consumer preferences. Government initiatives promoting healthy lifestyles indirectly contribute to market growth. Finally, the expansion of modern retail channels enhances market accessibility and penetration.
Challenges in the Water Enhancer Market in South Africa Sector
The South African water enhancer market faces certain challenges: Intense competition from established players and new entrants creates pressure on pricing and profit margins. Supply chain disruptions and fluctuating raw material costs can impact production and pricing. Maintaining consistent quality and flavor profiles is crucial for maintaining brand reputation and consumer trust. Furthermore, stringent regulatory requirements concerning food safety and labeling can increase compliance costs for businesses.
Leading Players in the Water Enhancer Market in South Africa Market
- PepsiCo Inc (Propel water)
- True Citrus Co
- Welch Foods Inc
- Keurig Dr Pepper
- Continental Mills Inc (Alpine Spiced Cider)
- Kraft Heinz Company
Key Developments in Water Enhancer Market in South Africa Sector
- January 2023: PepsiCo launched a new range of Propel water enhancers with natural flavors.
- June 2022: Keurig Dr Pepper expanded its distribution network, enhancing market reach.
- October 2021: True Citrus Co introduced a new line of organic water enhancers.
Strategic Water Enhancer Market in South Africa Market Outlook
The South African water enhancer market presents significant growth opportunities in the coming years. Strategic investments in product innovation, particularly focusing on natural and functional ingredients, will be crucial for success. Expanding distribution networks, particularly online channels, is essential for reaching wider consumer segments. Collaborations and partnerships with retailers can enhance market penetration. Maintaining a strong focus on sustainability and eco-friendly packaging solutions will appeal to environmentally conscious consumers. The market's overall positive growth trajectory, driven by the increasing health consciousness of the consumer base, positions it favorably for sustained growth and expansion.
Water Enhancer Market in South Africa Segmentation
-
1. Distribution Channel
- 1.1. Hypermarkets/Supermarkets
- 1.2. Convenience Stores
- 1.3. Online Channels
- 1.4. Other Distribution Channels
Water Enhancer Market in South Africa Segmentation By Geography
-
1. North America
- 1.1. United States
- 1.2. Canada
- 1.3. Mexico
-
2. South America
- 2.1. Brazil
- 2.2. Argentina
- 2.3. Rest of South America
-
3. Europe
- 3.1. United Kingdom
- 3.2. Germany
- 3.3. France
- 3.4. Italy
- 3.5. Spain
- 3.6. Russia
- 3.7. Benelux
- 3.8. Nordics
- 3.9. Rest of Europe
-
4. Middle East & Africa
- 4.1. Turkey
- 4.2. Israel
- 4.3. GCC
- 4.4. North Africa
- 4.5. South Africa
- 4.6. Rest of Middle East & Africa
-
5. Asia Pacific
- 5.1. China
- 5.2. India
- 5.3. Japan
- 5.4. South Korea
- 5.5. ASEAN
- 5.6. Oceania
- 5.7. Rest of Asia Pacific
Water Enhancer Market in South Africa REPORT HIGHLIGHTS
| Aspects | Details |
|---|---|
| Study Period | 2019-2033 |
| Base Year | 2024 |
| Estimated Year | 2025 |
| Forecast Period | 2025-2033 |
| Historical Period | 2019-2024 |
| Growth Rate | CAGR of 3.60% from 2019-2033 |
| Segmentation |
|
Table of Contents
- 1. Introduction
- 1.1. Research Scope
- 1.2. Market Segmentation
- 1.3. Research Methodology
- 1.4. Definitions and Assumptions
- 2. Executive Summary
- 2.1. Introduction
- 3. Market Dynamics
- 3.1. Introduction
- 3.2. Market Drivers
- 3.2.1. Rise Of Coffee Culture; Product Differentiation And Market Initiatives
- 3.3. Market Restrains
- 3.3.1. Presence Of Substitutes
- 3.4. Market Trends
- 3.4.1 Implementation of Sugar Tax
- 3.4.2 Leading to Increasing Demand for Water Drink Mixers
- 4. Market Factor Analysis
- 4.1. Porters Five Forces
- 4.2. Supply/Value Chain
- 4.3. PESTEL analysis
- 4.4. Market Entropy
- 4.5. Patent/Trademark Analysis
- 5. Global Water Enhancer Market in South Africa Analysis, Insights and Forecast, 2019-2031
- 5.1. Market Analysis, Insights and Forecast - by Distribution Channel
- 5.1.1. Hypermarkets/Supermarkets
- 5.1.2. Convenience Stores
- 5.1.3. Online Channels
- 5.1.4. Other Distribution Channels
- 5.2. Market Analysis, Insights and Forecast - by Region
- 5.2.1. North America
- 5.2.2. South America
- 5.2.3. Europe
- 5.2.4. Middle East & Africa
- 5.2.5. Asia Pacific
- 5.1. Market Analysis, Insights and Forecast - by Distribution Channel
- 6. North America Water Enhancer Market in South Africa Analysis, Insights and Forecast, 2019-2031
- 6.1. Market Analysis, Insights and Forecast - by Distribution Channel
- 6.1.1. Hypermarkets/Supermarkets
- 6.1.2. Convenience Stores
- 6.1.3. Online Channels
- 6.1.4. Other Distribution Channels
- 6.1. Market Analysis, Insights and Forecast - by Distribution Channel
- 7. South America Water Enhancer Market in South Africa Analysis, Insights and Forecast, 2019-2031
- 7.1. Market Analysis, Insights and Forecast - by Distribution Channel
- 7.1.1. Hypermarkets/Supermarkets
- 7.1.2. Convenience Stores
- 7.1.3. Online Channels
- 7.1.4. Other Distribution Channels
- 7.1. Market Analysis, Insights and Forecast - by Distribution Channel
- 8. Europe Water Enhancer Market in South Africa Analysis, Insights and Forecast, 2019-2031
- 8.1. Market Analysis, Insights and Forecast - by Distribution Channel
- 8.1.1. Hypermarkets/Supermarkets
- 8.1.2. Convenience Stores
- 8.1.3. Online Channels
- 8.1.4. Other Distribution Channels
- 8.1. Market Analysis, Insights and Forecast - by Distribution Channel
- 9. Middle East & Africa Water Enhancer Market in South Africa Analysis, Insights and Forecast, 2019-2031
- 9.1. Market Analysis, Insights and Forecast - by Distribution Channel
- 9.1.1. Hypermarkets/Supermarkets
- 9.1.2. Convenience Stores
- 9.1.3. Online Channels
- 9.1.4. Other Distribution Channels
- 9.1. Market Analysis, Insights and Forecast - by Distribution Channel
- 10. Asia Pacific Water Enhancer Market in South Africa Analysis, Insights and Forecast, 2019-2031
- 10.1. Market Analysis, Insights and Forecast - by Distribution Channel
- 10.1.1. Hypermarkets/Supermarkets
- 10.1.2. Convenience Stores
- 10.1.3. Online Channels
- 10.1.4. Other Distribution Channels
- 10.1. Market Analysis, Insights and Forecast - by Distribution Channel
- 11. South Africa Water Enhancer Market in South Africa Analysis, Insights and Forecast, 2019-2031
- 12. Sudan Water Enhancer Market in South Africa Analysis, Insights and Forecast, 2019-2031
- 13. Uganda Water Enhancer Market in South Africa Analysis, Insights and Forecast, 2019-2031
- 14. Tanzania Water Enhancer Market in South Africa Analysis, Insights and Forecast, 2019-2031
- 15. Kenya Water Enhancer Market in South Africa Analysis, Insights and Forecast, 2019-2031
- 16. Rest of Africa Water Enhancer Market in South Africa Analysis, Insights and Forecast, 2019-2031
- 17. Competitive Analysis
- 17.1. Global Market Share Analysis 2024
- 17.2. Company Profiles
- 17.2.1 PepsiCo Inc (Propel water)
- 17.2.1.1. Overview
- 17.2.1.2. Products
- 17.2.1.3. SWOT Analysis
- 17.2.1.4. Recent Developments
- 17.2.1.5. Financials (Based on Availability)
- 17.2.2 True Citrus Co
- 17.2.2.1. Overview
- 17.2.2.2. Products
- 17.2.2.3. SWOT Analysis
- 17.2.2.4. Recent Developments
- 17.2.2.5. Financials (Based on Availability)
- 17.2.3 Welch Foods Inc
- 17.2.3.1. Overview
- 17.2.3.2. Products
- 17.2.3.3. SWOT Analysis
- 17.2.3.4. Recent Developments
- 17.2.3.5. Financials (Based on Availability)
- 17.2.4 Keurig Dr Pepper
- 17.2.4.1. Overview
- 17.2.4.2. Products
- 17.2.4.3. SWOT Analysis
- 17.2.4.4. Recent Developments
- 17.2.4.5. Financials (Based on Availability)
- 17.2.5 Continental Mills Inc (Alpine Spiced Cider)
- 17.2.5.1. Overview
- 17.2.5.2. Products
- 17.2.5.3. SWOT Analysis
- 17.2.5.4. Recent Developments
- 17.2.5.5. Financials (Based on Availability)
- 17.2.6 Kraft Heinz Company
- 17.2.6.1. Overview
- 17.2.6.2. Products
- 17.2.6.3. SWOT Analysis
- 17.2.6.4. Recent Developments
- 17.2.6.5. Financials (Based on Availability)
- 17.2.1 PepsiCo Inc (Propel water)
List of Figures
- Figure 1: Global Water Enhancer Market in South Africa Revenue Breakdown (Million, %) by Region 2024 & 2032
- Figure 2: Global Water Enhancer Market in South Africa Volume Breakdown (K Tons, %) by Region 2024 & 2032
- Figure 3: Africa Water Enhancer Market in South Africa Revenue (Million), by Country 2024 & 2032
- Figure 4: Africa Water Enhancer Market in South Africa Volume (K Tons), by Country 2024 & 2032
- Figure 5: Africa Water Enhancer Market in South Africa Revenue Share (%), by Country 2024 & 2032
- Figure 6: Africa Water Enhancer Market in South Africa Volume Share (%), by Country 2024 & 2032
- Figure 7: North America Water Enhancer Market in South Africa Revenue (Million), by Distribution Channel 2024 & 2032
- Figure 8: North America Water Enhancer Market in South Africa Volume (K Tons), by Distribution Channel 2024 & 2032
- Figure 9: North America Water Enhancer Market in South Africa Revenue Share (%), by Distribution Channel 2024 & 2032
- Figure 10: North America Water Enhancer Market in South Africa Volume Share (%), by Distribution Channel 2024 & 2032
- Figure 11: North America Water Enhancer Market in South Africa Revenue (Million), by Country 2024 & 2032
- Figure 12: North America Water Enhancer Market in South Africa Volume (K Tons), by Country 2024 & 2032
- Figure 13: North America Water Enhancer Market in South Africa Revenue Share (%), by Country 2024 & 2032
- Figure 14: North America Water Enhancer Market in South Africa Volume Share (%), by Country 2024 & 2032
- Figure 15: South America Water Enhancer Market in South Africa Revenue (Million), by Distribution Channel 2024 & 2032
- Figure 16: South America Water Enhancer Market in South Africa Volume (K Tons), by Distribution Channel 2024 & 2032
- Figure 17: South America Water Enhancer Market in South Africa Revenue Share (%), by Distribution Channel 2024 & 2032
- Figure 18: South America Water Enhancer Market in South Africa Volume Share (%), by Distribution Channel 2024 & 2032
- Figure 19: South America Water Enhancer Market in South Africa Revenue (Million), by Country 2024 & 2032
- Figure 20: South America Water Enhancer Market in South Africa Volume (K Tons), by Country 2024 & 2032
- Figure 21: South America Water Enhancer Market in South Africa Revenue Share (%), by Country 2024 & 2032
- Figure 22: South America Water Enhancer Market in South Africa Volume Share (%), by Country 2024 & 2032
- Figure 23: Europe Water Enhancer Market in South Africa Revenue (Million), by Distribution Channel 2024 & 2032
- Figure 24: Europe Water Enhancer Market in South Africa Volume (K Tons), by Distribution Channel 2024 & 2032
- Figure 25: Europe Water Enhancer Market in South Africa Revenue Share (%), by Distribution Channel 2024 & 2032
- Figure 26: Europe Water Enhancer Market in South Africa Volume Share (%), by Distribution Channel 2024 & 2032
- Figure 27: Europe Water Enhancer Market in South Africa Revenue (Million), by Country 2024 & 2032
- Figure 28: Europe Water Enhancer Market in South Africa Volume (K Tons), by Country 2024 & 2032
- Figure 29: Europe Water Enhancer Market in South Africa Revenue Share (%), by Country 2024 & 2032
- Figure 30: Europe Water Enhancer Market in South Africa Volume Share (%), by Country 2024 & 2032
- Figure 31: Middle East & Africa Water Enhancer Market in South Africa Revenue (Million), by Distribution Channel 2024 & 2032
- Figure 32: Middle East & Africa Water Enhancer Market in South Africa Volume (K Tons), by Distribution Channel 2024 & 2032
- Figure 33: Middle East & Africa Water Enhancer Market in South Africa Revenue Share (%), by Distribution Channel 2024 & 2032
- Figure 34: Middle East & Africa Water Enhancer Market in South Africa Volume Share (%), by Distribution Channel 2024 & 2032
- Figure 35: Middle East & Africa Water Enhancer Market in South Africa Revenue (Million), by Country 2024 & 2032
- Figure 36: Middle East & Africa Water Enhancer Market in South Africa Volume (K Tons), by Country 2024 & 2032
- Figure 37: Middle East & Africa Water Enhancer Market in South Africa Revenue Share (%), by Country 2024 & 2032
- Figure 38: Middle East & Africa Water Enhancer Market in South Africa Volume Share (%), by Country 2024 & 2032
- Figure 39: Asia Pacific Water Enhancer Market in South Africa Revenue (Million), by Distribution Channel 2024 & 2032
- Figure 40: Asia Pacific Water Enhancer Market in South Africa Volume (K Tons), by Distribution Channel 2024 & 2032
- Figure 41: Asia Pacific Water Enhancer Market in South Africa Revenue Share (%), by Distribution Channel 2024 & 2032
- Figure 42: Asia Pacific Water Enhancer Market in South Africa Volume Share (%), by Distribution Channel 2024 & 2032
- Figure 43: Asia Pacific Water Enhancer Market in South Africa Revenue (Million), by Country 2024 & 2032
- Figure 44: Asia Pacific Water Enhancer Market in South Africa Volume (K Tons), by Country 2024 & 2032
- Figure 45: Asia Pacific Water Enhancer Market in South Africa Revenue Share (%), by Country 2024 & 2032
- Figure 46: Asia Pacific Water Enhancer Market in South Africa Volume Share (%), by Country 2024 & 2032
List of Tables
- Table 1: Global Water Enhancer Market in South Africa Revenue Million Forecast, by Region 2019 & 2032
- Table 2: Global Water Enhancer Market in South Africa Volume K Tons Forecast, by Region 2019 & 2032
- Table 3: Global Water Enhancer Market in South Africa Revenue Million Forecast, by Distribution Channel 2019 & 2032
- Table 4: Global Water Enhancer Market in South Africa Volume K Tons Forecast, by Distribution Channel 2019 & 2032
- Table 5: Global Water Enhancer Market in South Africa Revenue Million Forecast, by Region 2019 & 2032
- Table 6: Global Water Enhancer Market in South Africa Volume K Tons Forecast, by Region 2019 & 2032
- Table 7: Global Water Enhancer Market in South Africa Revenue Million Forecast, by Country 2019 & 2032
- Table 8: Global Water Enhancer Market in South Africa Volume K Tons Forecast, by Country 2019 & 2032
- Table 9: South Africa Water Enhancer Market in South Africa Revenue (Million) Forecast, by Application 2019 & 2032
- Table 10: South Africa Water Enhancer Market in South Africa Volume (K Tons) Forecast, by Application 2019 & 2032
- Table 11: Sudan Water Enhancer Market in South Africa Revenue (Million) Forecast, by Application 2019 & 2032
- Table 12: Sudan Water Enhancer Market in South Africa Volume (K Tons) Forecast, by Application 2019 & 2032
- Table 13: Uganda Water Enhancer Market in South Africa Revenue (Million) Forecast, by Application 2019 & 2032
- Table 14: Uganda Water Enhancer Market in South Africa Volume (K Tons) Forecast, by Application 2019 & 2032
- Table 15: Tanzania Water Enhancer Market in South Africa Revenue (Million) Forecast, by Application 2019 & 2032
- Table 16: Tanzania Water Enhancer Market in South Africa Volume (K Tons) Forecast, by Application 2019 & 2032
- Table 17: Kenya Water Enhancer Market in South Africa Revenue (Million) Forecast, by Application 2019 & 2032
- Table 18: Kenya Water Enhancer Market in South Africa Volume (K Tons) Forecast, by Application 2019 & 2032
- Table 19: Rest of Africa Water Enhancer Market in South Africa Revenue (Million) Forecast, by Application 2019 & 2032
- Table 20: Rest of Africa Water Enhancer Market in South Africa Volume (K Tons) Forecast, by Application 2019 & 2032
- Table 21: Global Water Enhancer Market in South Africa Revenue Million Forecast, by Distribution Channel 2019 & 2032
- Table 22: Global Water Enhancer Market in South Africa Volume K Tons Forecast, by Distribution Channel 2019 & 2032
- Table 23: Global Water Enhancer Market in South Africa Revenue Million Forecast, by Country 2019 & 2032
- Table 24: Global Water Enhancer Market in South Africa Volume K Tons Forecast, by Country 2019 & 2032
- Table 25: United States Water Enhancer Market in South Africa Revenue (Million) Forecast, by Application 2019 & 2032
- Table 26: United States Water Enhancer Market in South Africa Volume (K Tons) Forecast, by Application 2019 & 2032
- Table 27: Canada Water Enhancer Market in South Africa Revenue (Million) Forecast, by Application 2019 & 2032
- Table 28: Canada Water Enhancer Market in South Africa Volume (K Tons) Forecast, by Application 2019 & 2032
- Table 29: Mexico Water Enhancer Market in South Africa Revenue (Million) Forecast, by Application 2019 & 2032
- Table 30: Mexico Water Enhancer Market in South Africa Volume (K Tons) Forecast, by Application 2019 & 2032
- Table 31: Global Water Enhancer Market in South Africa Revenue Million Forecast, by Distribution Channel 2019 & 2032
- Table 32: Global Water Enhancer Market in South Africa Volume K Tons Forecast, by Distribution Channel 2019 & 2032
- Table 33: Global Water Enhancer Market in South Africa Revenue Million Forecast, by Country 2019 & 2032
- Table 34: Global Water Enhancer Market in South Africa Volume K Tons Forecast, by Country 2019 & 2032
- Table 35: Brazil Water Enhancer Market in South Africa Revenue (Million) Forecast, by Application 2019 & 2032
- Table 36: Brazil Water Enhancer Market in South Africa Volume (K Tons) Forecast, by Application 2019 & 2032
- Table 37: Argentina Water Enhancer Market in South Africa Revenue (Million) Forecast, by Application 2019 & 2032
- Table 38: Argentina Water Enhancer Market in South Africa Volume (K Tons) Forecast, by Application 2019 & 2032
- Table 39: Rest of South America Water Enhancer Market in South Africa Revenue (Million) Forecast, by Application 2019 & 2032
- Table 40: Rest of South America Water Enhancer Market in South Africa Volume (K Tons) Forecast, by Application 2019 & 2032
- Table 41: Global Water Enhancer Market in South Africa Revenue Million Forecast, by Distribution Channel 2019 & 2032
- Table 42: Global Water Enhancer Market in South Africa Volume K Tons Forecast, by Distribution Channel 2019 & 2032
- Table 43: Global Water Enhancer Market in South Africa Revenue Million Forecast, by Country 2019 & 2032
- Table 44: Global Water Enhancer Market in South Africa Volume K Tons Forecast, by Country 2019 & 2032
- Table 45: United Kingdom Water Enhancer Market in South Africa Revenue (Million) Forecast, by Application 2019 & 2032
- Table 46: United Kingdom Water Enhancer Market in South Africa Volume (K Tons) Forecast, by Application 2019 & 2032
- Table 47: Germany Water Enhancer Market in South Africa Revenue (Million) Forecast, by Application 2019 & 2032
- Table 48: Germany Water Enhancer Market in South Africa Volume (K Tons) Forecast, by Application 2019 & 2032
- Table 49: France Water Enhancer Market in South Africa Revenue (Million) Forecast, by Application 2019 & 2032
- Table 50: France Water Enhancer Market in South Africa Volume (K Tons) Forecast, by Application 2019 & 2032
- Table 51: Italy Water Enhancer Market in South Africa Revenue (Million) Forecast, by Application 2019 & 2032
- Table 52: Italy Water Enhancer Market in South Africa Volume (K Tons) Forecast, by Application 2019 & 2032
- Table 53: Spain Water Enhancer Market in South Africa Revenue (Million) Forecast, by Application 2019 & 2032
- Table 54: Spain Water Enhancer Market in South Africa Volume (K Tons) Forecast, by Application 2019 & 2032
- Table 55: Russia Water Enhancer Market in South Africa Revenue (Million) Forecast, by Application 2019 & 2032
- Table 56: Russia Water Enhancer Market in South Africa Volume (K Tons) Forecast, by Application 2019 & 2032
- Table 57: Benelux Water Enhancer Market in South Africa Revenue (Million) Forecast, by Application 2019 & 2032
- Table 58: Benelux Water Enhancer Market in South Africa Volume (K Tons) Forecast, by Application 2019 & 2032
- Table 59: Nordics Water Enhancer Market in South Africa Revenue (Million) Forecast, by Application 2019 & 2032
- Table 60: Nordics Water Enhancer Market in South Africa Volume (K Tons) Forecast, by Application 2019 & 2032
- Table 61: Rest of Europe Water Enhancer Market in South Africa Revenue (Million) Forecast, by Application 2019 & 2032
- Table 62: Rest of Europe Water Enhancer Market in South Africa Volume (K Tons) Forecast, by Application 2019 & 2032
- Table 63: Global Water Enhancer Market in South Africa Revenue Million Forecast, by Distribution Channel 2019 & 2032
- Table 64: Global Water Enhancer Market in South Africa Volume K Tons Forecast, by Distribution Channel 2019 & 2032
- Table 65: Global Water Enhancer Market in South Africa Revenue Million Forecast, by Country 2019 & 2032
- Table 66: Global Water Enhancer Market in South Africa Volume K Tons Forecast, by Country 2019 & 2032
- Table 67: Turkey Water Enhancer Market in South Africa Revenue (Million) Forecast, by Application 2019 & 2032
- Table 68: Turkey Water Enhancer Market in South Africa Volume (K Tons) Forecast, by Application 2019 & 2032
- Table 69: Israel Water Enhancer Market in South Africa Revenue (Million) Forecast, by Application 2019 & 2032
- Table 70: Israel Water Enhancer Market in South Africa Volume (K Tons) Forecast, by Application 2019 & 2032
- Table 71: GCC Water Enhancer Market in South Africa Revenue (Million) Forecast, by Application 2019 & 2032
- Table 72: GCC Water Enhancer Market in South Africa Volume (K Tons) Forecast, by Application 2019 & 2032
- Table 73: North Africa Water Enhancer Market in South Africa Revenue (Million) Forecast, by Application 2019 & 2032
- Table 74: North Africa Water Enhancer Market in South Africa Volume (K Tons) Forecast, by Application 2019 & 2032
- Table 75: South Africa Water Enhancer Market in South Africa Revenue (Million) Forecast, by Application 2019 & 2032
- Table 76: South Africa Water Enhancer Market in South Africa Volume (K Tons) Forecast, by Application 2019 & 2032
- Table 77: Rest of Middle East & Africa Water Enhancer Market in South Africa Revenue (Million) Forecast, by Application 2019 & 2032
- Table 78: Rest of Middle East & Africa Water Enhancer Market in South Africa Volume (K Tons) Forecast, by Application 2019 & 2032
- Table 79: Global Water Enhancer Market in South Africa Revenue Million Forecast, by Distribution Channel 2019 & 2032
- Table 80: Global Water Enhancer Market in South Africa Volume K Tons Forecast, by Distribution Channel 2019 & 2032
- Table 81: Global Water Enhancer Market in South Africa Revenue Million Forecast, by Country 2019 & 2032
- Table 82: Global Water Enhancer Market in South Africa Volume K Tons Forecast, by Country 2019 & 2032
- Table 83: China Water Enhancer Market in South Africa Revenue (Million) Forecast, by Application 2019 & 2032
- Table 84: China Water Enhancer Market in South Africa Volume (K Tons) Forecast, by Application 2019 & 2032
- Table 85: India Water Enhancer Market in South Africa Revenue (Million) Forecast, by Application 2019 & 2032
- Table 86: India Water Enhancer Market in South Africa Volume (K Tons) Forecast, by Application 2019 & 2032
- Table 87: Japan Water Enhancer Market in South Africa Revenue (Million) Forecast, by Application 2019 & 2032
- Table 88: Japan Water Enhancer Market in South Africa Volume (K Tons) Forecast, by Application 2019 & 2032
- Table 89: South Korea Water Enhancer Market in South Africa Revenue (Million) Forecast, by Application 2019 & 2032
- Table 90: South Korea Water Enhancer Market in South Africa Volume (K Tons) Forecast, by Application 2019 & 2032
- Table 91: ASEAN Water Enhancer Market in South Africa Revenue (Million) Forecast, by Application 2019 & 2032
- Table 92: ASEAN Water Enhancer Market in South Africa Volume (K Tons) Forecast, by Application 2019 & 2032
- Table 93: Oceania Water Enhancer Market in South Africa Revenue (Million) Forecast, by Application 2019 & 2032
- Table 94: Oceania Water Enhancer Market in South Africa Volume (K Tons) Forecast, by Application 2019 & 2032
- Table 95: Rest of Asia Pacific Water Enhancer Market in South Africa Revenue (Million) Forecast, by Application 2019 & 2032
- Table 96: Rest of Asia Pacific Water Enhancer Market in South Africa Volume (K Tons) Forecast, by Application 2019 & 2032
Frequently Asked Questions
1. What is the projected Compound Annual Growth Rate (CAGR) of the Water Enhancer Market in South Africa?
The projected CAGR is approximately 3.60%.
2. Which companies are prominent players in the Water Enhancer Market in South Africa?
Key companies in the market include PepsiCo Inc (Propel water), True Citrus Co, Welch Foods Inc, Keurig Dr Pepper, Continental Mills Inc (Alpine Spiced Cider), Kraft Heinz Company.
3. What are the main segments of the Water Enhancer Market in South Africa?
The market segments include Distribution Channel.
4. Can you provide details about the market size?
The market size is estimated to be USD XX Million as of 2022.
5. What are some drivers contributing to market growth?
Rise Of Coffee Culture; Product Differentiation And Market Initiatives.
6. What are the notable trends driving market growth?
Implementation of Sugar Tax. Leading to Increasing Demand for Water Drink Mixers.
7. Are there any restraints impacting market growth?
Presence Of Substitutes.
8. Can you provide examples of recent developments in the market?
N/A
9. What pricing options are available for accessing the report?
Pricing options include single-user, multi-user, and enterprise licenses priced at USD 3800, USD 4500, and USD 5800 respectively.
10. Is the market size provided in terms of value or volume?
The market size is provided in terms of value, measured in Million and volume, measured in K Tons.
11. Are there any specific market keywords associated with the report?
Yes, the market keyword associated with the report is "Water Enhancer Market in South Africa," which aids in identifying and referencing the specific market segment covered.
12. How do I determine which pricing option suits my needs best?
The pricing options vary based on user requirements and access needs. Individual users may opt for single-user licenses, while businesses requiring broader access may choose multi-user or enterprise licenses for cost-effective access to the report.
13. Are there any additional resources or data provided in the Water Enhancer Market in South Africa report?
While the report offers comprehensive insights, it's advisable to review the specific contents or supplementary materials provided to ascertain if additional resources or data are available.
14. How can I stay updated on further developments or reports in the Water Enhancer Market in South Africa?
To stay informed about further developments, trends, and reports in the Water Enhancer Market in South Africa, consider subscribing to industry newsletters, following relevant companies and organizations, or regularly checking reputable industry news sources and publications.
Methodology
Step 1 - Identification of Relevant Samples Size from Population Database


Step 2 - Approaches for Defining Global Market Size (Value, Volume* & Price*)

Note*: In applicable scenarios
Step 3 - Data Sources
Primary Research
- Web Analytics
- Survey Reports
- Research Institute
- Latest Research Reports
- Opinion Leaders
Secondary Research
- Annual Reports
- White Paper
- Latest Press Release
- Industry Association
- Paid Database
- Investor Presentations

Step 4 - Data Triangulation
Involves using different sources of information in order to increase the validity of a study
These sources are likely to be stakeholders in a program - participants, other researchers, program staff, other community members, and so on.
Then we put all data in single framework & apply various statistical tools to find out the dynamic on the market.
During the analysis stage, feedback from the stakeholder groups would be compared to determine areas of agreement as well as areas of divergence


