
Key Insights
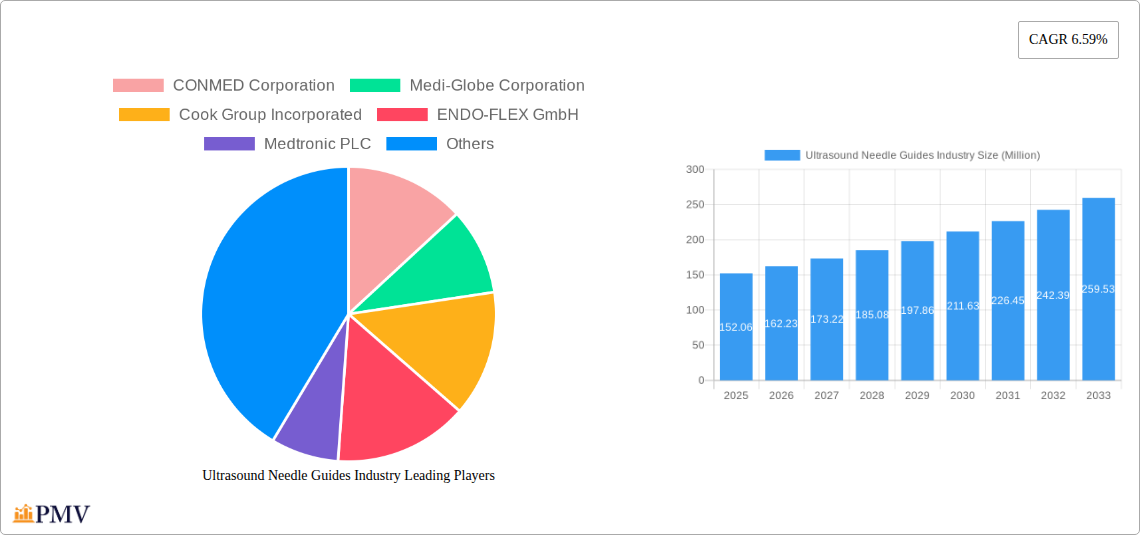
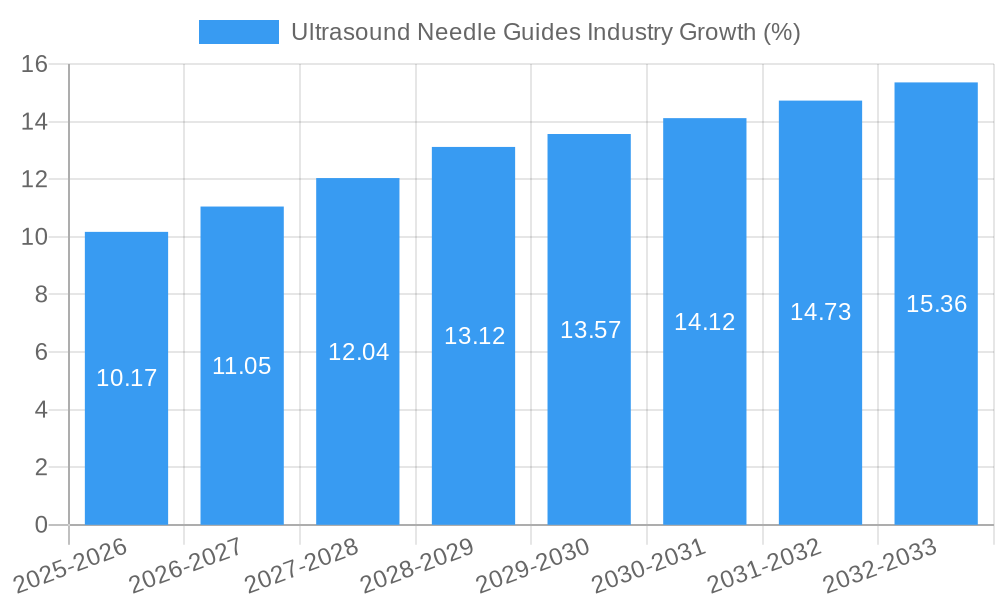
The Ultrasound Needle Guides market is experiencing robust growth, projected to reach \$152.06 million in 2025 and maintain a Compound Annual Growth Rate (CAGR) of 6.59% from 2025 to 2033. This expansion is driven by several key factors. The increasing prevalence of minimally invasive procedures, particularly in oncology and gastroenterology, fuels demand for precise and efficient needle guidance systems. Technological advancements, including the development of smaller, more versatile needles and improved imaging capabilities, further enhance the market's appeal. The rising adoption of EUS (Endoscopic Ultrasound) procedures for diagnosis and treatment of various conditions contributes significantly to market growth, particularly within the segments of Bronchial and Enteral EUS needles. The increasing number of hospitals and ambulatory surgical centers, coupled with a growing geriatric population requiring more complex procedures, are additional market drivers. While regulatory hurdles and high initial investment costs might pose some challenges, the overall market outlook remains optimistic, largely fueled by continuous innovation and the increasing preference for minimally invasive interventions.
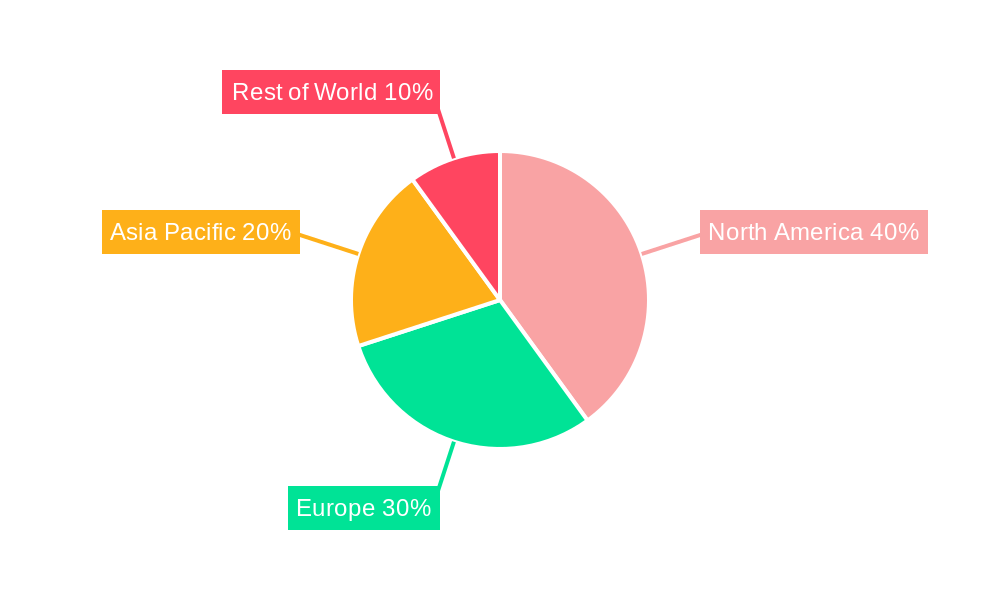
Growth across regions is expected to be relatively balanced. North America, with its advanced healthcare infrastructure and high adoption rate of advanced medical technologies, will likely remain a dominant market segment. However, Asia Pacific is anticipated to witness significant growth due to rising healthcare expenditure, expanding medical tourism, and increasing awareness of minimally invasive techniques. Europe and other regions will also contribute to the market's overall expansion, reflecting a global shift towards minimally invasive surgeries and the benefits they offer to patients and healthcare providers. The competitive landscape features established players like CONMED Corporation, Medtronic PLC, and Boston Scientific Corporation, alongside smaller, specialized companies. Competition is likely to intensify as manufacturers focus on developing innovative products and expanding their global presence. The market's long-term growth trajectory points to a continued increase in demand for ultrasound needle guides across various applications and geographical locations.
Ultrasound Needle Guides Industry Market Report: 2019-2033
This comprehensive report provides an in-depth analysis of the Ultrasound Needle Guides industry, offering valuable insights for stakeholders seeking to understand market dynamics, competitive landscapes, and future growth opportunities. The report covers the period 2019-2033, with a focus on the forecast period 2025-2033 and a base year of 2025. The market is segmented by product (Aspiration Needles, Biopsy Needles), application (Bronchial EUS Needles, Enteral EUS Needles), and end-user (Hospitals, Ambulatory Surgical Centers, Other End Users). Key players analyzed include CONMED Corporation, Medi-Globe Corporation, Cook Group Incorporated, ENDO-FLEX GmbH, Medtronic PLC, ACE Medical Devices Pvt Ltd, Boston Scientific Corporation, Micro-Tech Endoscopy, and Olympus Corporation. The report projects a market value of xx Million by 2033, exhibiting a CAGR of xx% during the forecast period.
Ultrasound Needle Guides Industry Market Structure & Competitive Dynamics
The Ultrasound Needle Guides market exhibits a moderately concentrated structure, with a few key players holding significant market share. The industry is characterized by intense competition, driven by innovation in needle design, technological advancements in ultrasound imaging, and the increasing demand for minimally invasive procedures. Market share data for 2024 reveals that Medtronic PLC holds an estimated xx% share, followed by Boston Scientific Corporation with xx%, and Cook Group Incorporated at xx%. The remaining market share is distributed among other players, including CONMED Corporation, Medi-Globe Corporation, and Olympus Corporation.
The regulatory landscape plays a crucial role, influencing product approvals and market access. Stringent regulatory requirements for medical devices necessitate significant investments in research and development, contributing to the high barriers to entry. The industry witnesses a considerable amount of M&A activity, with deal values reaching xx Million in 2024. These activities often involve strategic acquisitions to expand product portfolios, enhance technological capabilities, and increase market penetration. Innovation ecosystems thrive through collaborations between manufacturers, research institutions, and regulatory bodies, fueling the continuous development of advanced ultrasound needle guide systems. Substitutes for ultrasound needle guides are limited, primarily relying on older, less precise techniques, reinforcing the market's growth trajectory. End-user trends increasingly favor minimally invasive procedures, driving the demand for sophisticated ultrasound needle guides.
Ultrasound Needle Guides Industry Industry Trends & Insights
The Ultrasound Needle Guides market is experiencing robust growth, driven by several key factors. The rising prevalence of chronic diseases necessitating biopsies and aspirations fuels the demand for precise and efficient needle guidance systems. Technological advancements, such as the integration of advanced imaging capabilities and robotic assistance, are enhancing the accuracy and safety of procedures, further stimulating market expansion. The increasing adoption of minimally invasive procedures across various medical specialties, along with the growing preference for outpatient settings, contributes significantly to market growth. A notable shift in consumer preferences toward minimally invasive interventions also drives the demand for advanced needle guidance systems. Competitive dynamics, characterized by continuous product innovation and technological advancements, push the industry forward, leading to improved performance and market penetration. The market is projected to grow at a CAGR of xx% from 2025 to 2033, with market penetration expected to reach xx% by 2033.
Dominant Markets & Segments in Ultrasound Needle Guides Industry
The North American region currently dominates the global Ultrasound Needle Guides market, driven by high healthcare expenditure, technological advancements, and the presence of major market players. Within this region, the United States holds the largest market share due to its advanced healthcare infrastructure, high adoption of minimally invasive procedures, and a large patient pool requiring EUS-guided procedures.
Product Segments: Biopsy needles currently hold a larger market share compared to aspiration needles, owing to the wider range of applications in various medical specialties. The demand for biopsy needles is anticipated to witness robust growth due to the increasing prevalence of cancers and other diseases requiring tissue sampling.
Application Segments: Bronchial EUS needles currently lead the application segment due to the high prevalence of lung cancer and the increasing use of EUS-guided procedures for diagnosis and treatment. However, Enteral EUS needles are projected to experience significant growth due to the rising prevalence of gastrointestinal disorders.
End-User Segments: Hospitals constitute the largest end-user segment, followed by ambulatory surgical centers. The growth in ambulatory surgical centers is further contributing to the market's expansion.
Key drivers for regional dominance include robust healthcare infrastructure, favorable regulatory environments, high healthcare expenditure, and technological advancements. The increasing adoption of EUS-guided procedures in developing economies is expected to drive regional market growth over the coming years.
Ultrasound Needle Guides Industry Product Innovations
Recent innovations in ultrasound needle guides focus on enhancing precision, minimizing invasiveness, and improving procedural efficiency. Developments include automated needle guidance systems, improved needle designs for better tissue acquisition, and integration of advanced imaging technologies. These innovations are driven by the need for higher accuracy, reduced complication rates, and improved patient outcomes. The market is witnessing the introduction of smaller, more flexible needles, enabling access to challenging anatomical locations and reducing patient discomfort. These advancements cater to the growing market demand for minimally invasive techniques and superior diagnostic capabilities.
Report Segmentation & Scope
This report provides a detailed segmentation of the Ultrasound Needle Guides market across various parameters:
Product: Aspiration Needles (market size xx Million in 2024, projected to reach xx Million by 2033, CAGR xx%), Biopsy Needles (market size xx Million in 2024, projected to reach xx Million by 2033, CAGR xx%). Competition in both segments is intense, with established players focusing on innovation and differentiation.
Application: Bronchial EUS Needles (market size xx Million in 2024, projected to reach xx Million by 2033, CAGR xx%), Enteral EUS Needles (market size xx Million in 2024, projected to reach xx Million by 2033, CAGR xx%). Growth in both segments is fueled by technological advancements and increasing procedural demand.
End User: Hospitals (market size xx Million in 2024, projected to reach xx Million by 2033, CAGR xx%), Ambulatory Surgical Centers (market size xx Million in 2024, projected to reach xx Million by 2033, CAGR xx%), Other End Users (market size xx Million in 2024, projected to reach xx Million by 2033, CAGR xx%). The hospital segment dominates, while ASCs show faster growth.
Key Drivers of Ultrasound Needle Guides Industry Growth
Several factors propel the growth of the Ultrasound Needle Guides industry. Technological advancements leading to increased accuracy and reduced invasiveness are primary drivers. The rising prevalence of chronic diseases requiring biopsies and aspirations significantly boosts market demand. Furthermore, favorable regulatory frameworks supporting the adoption of minimally invasive procedures contribute to market expansion. Economic factors, such as increasing healthcare expenditure and investment in healthcare infrastructure, further fuel industry growth.
Challenges in the Ultrasound Needle Guides Industry Sector
The Ultrasound Needle Guides industry faces several challenges. Stringent regulatory requirements for medical devices increase the cost and time associated with product development and approval, posing a barrier to entry for new players. Supply chain disruptions and fluctuations in raw material prices can impact production costs and profitability. Intense competition among established players and the emergence of new entrants put pressure on pricing and margins. These challenges require manufacturers to strategize effectively to maintain their position within the market.
Leading Players in the Ultrasound Needle Guides Industry Market
- CONMED Corporation
- Medi-Globe Corporation
- Cook Group Incorporated
- ENDO-FLEX GmbH
- Medtronic PLC
- ACE Medical Devices Pvt Ltd
- Boston Scientific Corporation
- Micro-Tech Endoscopy
- Olympus Corporation
Key Developments in Ultrasound Needle Guides Industry Sector
October 2021: Micro-Tech Endoscopy launched enhanced endoscopic ultrasound needles: Areus FNA Needle and Trident FNB Needle. This enhanced product line broadened their offerings and improved market competitiveness.
November 2021: SonoScape Medical launched the linear echoendoscope EG-UC5T, collaborating with ESGE and EUS experts. This increased awareness and adoption of their technology.
May 2022: Limaca Medical received FDA breakthrough device designation for its Precision-GI endoscopic ultrasound biopsy needle. This significantly accelerated the product’s market entry and boosted investor confidence.
Strategic Ultrasound Needle Guides Industry Market Outlook
The future of the Ultrasound Needle Guides market looks promising, driven by continued technological innovation, growing demand for minimally invasive procedures, and the rising prevalence of chronic diseases. Strategic opportunities exist for companies to invest in research and development of advanced needle guidance systems, expand into emerging markets, and forge strategic partnerships to expand their reach and market share. The increasing focus on improving procedural efficiency and patient outcomes provides further growth potential for innovative players in the industry.
Ultrasound Needle Guides Industry Segmentation
-
1. Product
- 1.1. Aspiration Needles
- 1.2. Biopsy Needles
-
2. Application
- 2.1. Bronchial EUS Needles
- 2.2. Enteral EUS Needles
-
3. End User
- 3.1. Hospitals
- 3.2. Ambulatory Surgical Centers
- 3.3. Other End Users
Ultrasound Needle Guides Industry Segmentation By Geography
-
1. North America
- 1.1. United States
- 1.2. Canada
- 1.3. Mexico
-
2. Europe
- 2.1. United Kingdom
- 2.2. France
- 2.3. Germany
- 2.4. Italy
- 2.5. Spain
- 2.6. Rest of Europe
-
3. Asia Pacific
- 3.1. India
- 3.2. China
- 3.3. Japan
- 3.4. Australia
- 3.5. South Korea
- 3.6. Rest of Asia Pacific
-
4. Middle East and Africa
- 4.1. GCC
- 4.2. South Africa
- 4.3. Rest of Middle East and Africa
-
5. South America
- 5.1. Brazil
- 5.2. Argentina
- 5.3. Rest of South America
Ultrasound Needle Guides Industry REPORT HIGHLIGHTS
| Aspects | Details |
|---|---|
| Study Period | 2019-2033 |
| Base Year | 2024 |
| Estimated Year | 2025 |
| Forecast Period | 2025-2033 |
| Historical Period | 2019-2024 |
| Growth Rate | CAGR of 6.59% from 2019-2033 |
| Segmentation |
|
Table of Contents
- 1. Introduction
- 1.1. Research Scope
- 1.2. Market Segmentation
- 1.3. Research Methodology
- 1.4. Definitions and Assumptions
- 2. Executive Summary
- 2.1. Introduction
- 3. Market Dynamics
- 3.1. Introduction
- 3.2. Market Drivers
- 3.2.1. Rising Geriatric Population; High Prevalence of Gastrointestinal Tract-related Cancers; Increasing Demand for Minimally Invasive Procedures
- 3.3. Market Restrains
- 3.3.1. Lack of Expertise in Handling Endoscopic Ultrasound Needles
- 3.4. Market Trends
- 3.4.1. Biopsy Needles Expected to Hold a Significant Share in the Market Over the Forecast Period
- 4. Market Factor Analysis
- 4.1. Porters Five Forces
- 4.2. Supply/Value Chain
- 4.3. PESTEL analysis
- 4.4. Market Entropy
- 4.5. Patent/Trademark Analysis
- 5. Global Ultrasound Needle Guides Industry Analysis, Insights and Forecast, 2019-2031
- 5.1. Market Analysis, Insights and Forecast - by Product
- 5.1.1. Aspiration Needles
- 5.1.2. Biopsy Needles
- 5.2. Market Analysis, Insights and Forecast - by Application
- 5.2.1. Bronchial EUS Needles
- 5.2.2. Enteral EUS Needles
- 5.3. Market Analysis, Insights and Forecast - by End User
- 5.3.1. Hospitals
- 5.3.2. Ambulatory Surgical Centers
- 5.3.3. Other End Users
- 5.4. Market Analysis, Insights and Forecast - by Region
- 5.4.1. North America
- 5.4.2. Europe
- 5.4.3. Asia Pacific
- 5.4.4. Middle East and Africa
- 5.4.5. South America
- 5.1. Market Analysis, Insights and Forecast - by Product
- 6. North America Ultrasound Needle Guides Industry Analysis, Insights and Forecast, 2019-2031
- 6.1. Market Analysis, Insights and Forecast - by Product
- 6.1.1. Aspiration Needles
- 6.1.2. Biopsy Needles
- 6.2. Market Analysis, Insights and Forecast - by Application
- 6.2.1. Bronchial EUS Needles
- 6.2.2. Enteral EUS Needles
- 6.3. Market Analysis, Insights and Forecast - by End User
- 6.3.1. Hospitals
- 6.3.2. Ambulatory Surgical Centers
- 6.3.3. Other End Users
- 6.1. Market Analysis, Insights and Forecast - by Product
- 7. Europe Ultrasound Needle Guides Industry Analysis, Insights and Forecast, 2019-2031
- 7.1. Market Analysis, Insights and Forecast - by Product
- 7.1.1. Aspiration Needles
- 7.1.2. Biopsy Needles
- 7.2. Market Analysis, Insights and Forecast - by Application
- 7.2.1. Bronchial EUS Needles
- 7.2.2. Enteral EUS Needles
- 7.3. Market Analysis, Insights and Forecast - by End User
- 7.3.1. Hospitals
- 7.3.2. Ambulatory Surgical Centers
- 7.3.3. Other End Users
- 7.1. Market Analysis, Insights and Forecast - by Product
- 8. Asia Pacific Ultrasound Needle Guides Industry Analysis, Insights and Forecast, 2019-2031
- 8.1. Market Analysis, Insights and Forecast - by Product
- 8.1.1. Aspiration Needles
- 8.1.2. Biopsy Needles
- 8.2. Market Analysis, Insights and Forecast - by Application
- 8.2.1. Bronchial EUS Needles
- 8.2.2. Enteral EUS Needles
- 8.3. Market Analysis, Insights and Forecast - by End User
- 8.3.1. Hospitals
- 8.3.2. Ambulatory Surgical Centers
- 8.3.3. Other End Users
- 8.1. Market Analysis, Insights and Forecast - by Product
- 9. Middle East and Africa Ultrasound Needle Guides Industry Analysis, Insights and Forecast, 2019-2031
- 9.1. Market Analysis, Insights and Forecast - by Product
- 9.1.1. Aspiration Needles
- 9.1.2. Biopsy Needles
- 9.2. Market Analysis, Insights and Forecast - by Application
- 9.2.1. Bronchial EUS Needles
- 9.2.2. Enteral EUS Needles
- 9.3. Market Analysis, Insights and Forecast - by End User
- 9.3.1. Hospitals
- 9.3.2. Ambulatory Surgical Centers
- 9.3.3. Other End Users
- 9.1. Market Analysis, Insights and Forecast - by Product
- 10. South America Ultrasound Needle Guides Industry Analysis, Insights and Forecast, 2019-2031
- 10.1. Market Analysis, Insights and Forecast - by Product
- 10.1.1. Aspiration Needles
- 10.1.2. Biopsy Needles
- 10.2. Market Analysis, Insights and Forecast - by Application
- 10.2.1. Bronchial EUS Needles
- 10.2.2. Enteral EUS Needles
- 10.3. Market Analysis, Insights and Forecast - by End User
- 10.3.1. Hospitals
- 10.3.2. Ambulatory Surgical Centers
- 10.3.3. Other End Users
- 10.1. Market Analysis, Insights and Forecast - by Product
- 11. North America Ultrasound Needle Guides Industry Analysis, Insights and Forecast, 2019-2031
- 11.1. Market Analysis, Insights and Forecast - By Country/Sub-region
- 11.1.1 United States
- 11.1.2 Canada
- 11.1.3 Mexico
- 12. South America Ultrasound Needle Guides Industry Analysis, Insights and Forecast, 2019-2031
- 12.1. Market Analysis, Insights and Forecast - By Country/Sub-region
- 12.1.1 Brazil
- 12.1.2 Mexico
- 12.1.3 Rest of South America
- 13. Europe Ultrasound Needle Guides Industry Analysis, Insights and Forecast, 2019-2031
- 13.1. Market Analysis, Insights and Forecast - By Country/Sub-region
- 13.1.1 Germany
- 13.1.2 United Kingdom
- 13.1.3 France
- 13.1.4 Italy
- 13.1.5 Spain
- 13.1.6 Rest of Europe
- 14. Asia Pacific Ultrasound Needle Guides Industry Analysis, Insights and Forecast, 2019-2031
- 14.1. Market Analysis, Insights and Forecast - By Country/Sub-region
- 14.1.1 China
- 14.1.2 Japan
- 14.1.3 India
- 14.1.4 South Korea
- 14.1.5 Taiwan
- 14.1.6 Australia
- 14.1.7 Rest of Asia-Pacific
- 15. MEA Ultrasound Needle Guides Industry Analysis, Insights and Forecast, 2019-2031
- 15.1. Market Analysis, Insights and Forecast - By Country/Sub-region
- 15.1.1 Middle East
- 15.1.2 Africa
- 16. Competitive Analysis
- 16.1. Global Market Share Analysis 2024
- 16.2. Company Profiles
- 16.2.1 CONMED Corporation
- 16.2.1.1. Overview
- 16.2.1.2. Products
- 16.2.1.3. SWOT Analysis
- 16.2.1.4. Recent Developments
- 16.2.1.5. Financials (Based on Availability)
- 16.2.2 Medi-Globe Corporation
- 16.2.2.1. Overview
- 16.2.2.2. Products
- 16.2.2.3. SWOT Analysis
- 16.2.2.4. Recent Developments
- 16.2.2.5. Financials (Based on Availability)
- 16.2.3 Cook Group Incorporated
- 16.2.3.1. Overview
- 16.2.3.2. Products
- 16.2.3.3. SWOT Analysis
- 16.2.3.4. Recent Developments
- 16.2.3.5. Financials (Based on Availability)
- 16.2.4 ENDO-FLEX GmbH
- 16.2.4.1. Overview
- 16.2.4.2. Products
- 16.2.4.3. SWOT Analysis
- 16.2.4.4. Recent Developments
- 16.2.4.5. Financials (Based on Availability)
- 16.2.5 Medtronic PLC
- 16.2.5.1. Overview
- 16.2.5.2. Products
- 16.2.5.3. SWOT Analysis
- 16.2.5.4. Recent Developments
- 16.2.5.5. Financials (Based on Availability)
- 16.2.6 ACE Medical Devices Pvt Ltd
- 16.2.6.1. Overview
- 16.2.6.2. Products
- 16.2.6.3. SWOT Analysis
- 16.2.6.4. Recent Developments
- 16.2.6.5. Financials (Based on Availability)
- 16.2.7 Boston Scientific Corporation
- 16.2.7.1. Overview
- 16.2.7.2. Products
- 16.2.7.3. SWOT Analysis
- 16.2.7.4. Recent Developments
- 16.2.7.5. Financials (Based on Availability)
- 16.2.8 Micro-Tech Endoscopy
- 16.2.8.1. Overview
- 16.2.8.2. Products
- 16.2.8.3. SWOT Analysis
- 16.2.8.4. Recent Developments
- 16.2.8.5. Financials (Based on Availability)
- 16.2.9 Olympus Corporation
- 16.2.9.1. Overview
- 16.2.9.2. Products
- 16.2.9.3. SWOT Analysis
- 16.2.9.4. Recent Developments
- 16.2.9.5. Financials (Based on Availability)
- 16.2.1 CONMED Corporation
List of Figures
- Figure 1: Global Ultrasound Needle Guides Industry Revenue Breakdown (Million, %) by Region 2024 & 2032
- Figure 2: Global Ultrasound Needle Guides Industry Volume Breakdown (K Units, %) by Region 2024 & 2032
- Figure 3: North America Ultrasound Needle Guides Industry Revenue (Million), by Country 2024 & 2032
- Figure 4: North America Ultrasound Needle Guides Industry Volume (K Units), by Country 2024 & 2032
- Figure 5: North America Ultrasound Needle Guides Industry Revenue Share (%), by Country 2024 & 2032
- Figure 6: North America Ultrasound Needle Guides Industry Volume Share (%), by Country 2024 & 2032
- Figure 7: South America Ultrasound Needle Guides Industry Revenue (Million), by Country 2024 & 2032
- Figure 8: South America Ultrasound Needle Guides Industry Volume (K Units), by Country 2024 & 2032
- Figure 9: South America Ultrasound Needle Guides Industry Revenue Share (%), by Country 2024 & 2032
- Figure 10: South America Ultrasound Needle Guides Industry Volume Share (%), by Country 2024 & 2032
- Figure 11: Europe Ultrasound Needle Guides Industry Revenue (Million), by Country 2024 & 2032
- Figure 12: Europe Ultrasound Needle Guides Industry Volume (K Units), by Country 2024 & 2032
- Figure 13: Europe Ultrasound Needle Guides Industry Revenue Share (%), by Country 2024 & 2032
- Figure 14: Europe Ultrasound Needle Guides Industry Volume Share (%), by Country 2024 & 2032
- Figure 15: Asia Pacific Ultrasound Needle Guides Industry Revenue (Million), by Country 2024 & 2032
- Figure 16: Asia Pacific Ultrasound Needle Guides Industry Volume (K Units), by Country 2024 & 2032
- Figure 17: Asia Pacific Ultrasound Needle Guides Industry Revenue Share (%), by Country 2024 & 2032
- Figure 18: Asia Pacific Ultrasound Needle Guides Industry Volume Share (%), by Country 2024 & 2032
- Figure 19: MEA Ultrasound Needle Guides Industry Revenue (Million), by Country 2024 & 2032
- Figure 20: MEA Ultrasound Needle Guides Industry Volume (K Units), by Country 2024 & 2032
- Figure 21: MEA Ultrasound Needle Guides Industry Revenue Share (%), by Country 2024 & 2032
- Figure 22: MEA Ultrasound Needle Guides Industry Volume Share (%), by Country 2024 & 2032
- Figure 23: North America Ultrasound Needle Guides Industry Revenue (Million), by Product 2024 & 2032
- Figure 24: North America Ultrasound Needle Guides Industry Volume (K Units), by Product 2024 & 2032
- Figure 25: North America Ultrasound Needle Guides Industry Revenue Share (%), by Product 2024 & 2032
- Figure 26: North America Ultrasound Needle Guides Industry Volume Share (%), by Product 2024 & 2032
- Figure 27: North America Ultrasound Needle Guides Industry Revenue (Million), by Application 2024 & 2032
- Figure 28: North America Ultrasound Needle Guides Industry Volume (K Units), by Application 2024 & 2032
- Figure 29: North America Ultrasound Needle Guides Industry Revenue Share (%), by Application 2024 & 2032
- Figure 30: North America Ultrasound Needle Guides Industry Volume Share (%), by Application 2024 & 2032
- Figure 31: North America Ultrasound Needle Guides Industry Revenue (Million), by End User 2024 & 2032
- Figure 32: North America Ultrasound Needle Guides Industry Volume (K Units), by End User 2024 & 2032
- Figure 33: North America Ultrasound Needle Guides Industry Revenue Share (%), by End User 2024 & 2032
- Figure 34: North America Ultrasound Needle Guides Industry Volume Share (%), by End User 2024 & 2032
- Figure 35: North America Ultrasound Needle Guides Industry Revenue (Million), by Country 2024 & 2032
- Figure 36: North America Ultrasound Needle Guides Industry Volume (K Units), by Country 2024 & 2032
- Figure 37: North America Ultrasound Needle Guides Industry Revenue Share (%), by Country 2024 & 2032
- Figure 38: North America Ultrasound Needle Guides Industry Volume Share (%), by Country 2024 & 2032
- Figure 39: Europe Ultrasound Needle Guides Industry Revenue (Million), by Product 2024 & 2032
- Figure 40: Europe Ultrasound Needle Guides Industry Volume (K Units), by Product 2024 & 2032
- Figure 41: Europe Ultrasound Needle Guides Industry Revenue Share (%), by Product 2024 & 2032
- Figure 42: Europe Ultrasound Needle Guides Industry Volume Share (%), by Product 2024 & 2032
- Figure 43: Europe Ultrasound Needle Guides Industry Revenue (Million), by Application 2024 & 2032
- Figure 44: Europe Ultrasound Needle Guides Industry Volume (K Units), by Application 2024 & 2032
- Figure 45: Europe Ultrasound Needle Guides Industry Revenue Share (%), by Application 2024 & 2032
- Figure 46: Europe Ultrasound Needle Guides Industry Volume Share (%), by Application 2024 & 2032
- Figure 47: Europe Ultrasound Needle Guides Industry Revenue (Million), by End User 2024 & 2032
- Figure 48: Europe Ultrasound Needle Guides Industry Volume (K Units), by End User 2024 & 2032
- Figure 49: Europe Ultrasound Needle Guides Industry Revenue Share (%), by End User 2024 & 2032
- Figure 50: Europe Ultrasound Needle Guides Industry Volume Share (%), by End User 2024 & 2032
- Figure 51: Europe Ultrasound Needle Guides Industry Revenue (Million), by Country 2024 & 2032
- Figure 52: Europe Ultrasound Needle Guides Industry Volume (K Units), by Country 2024 & 2032
- Figure 53: Europe Ultrasound Needle Guides Industry Revenue Share (%), by Country 2024 & 2032
- Figure 54: Europe Ultrasound Needle Guides Industry Volume Share (%), by Country 2024 & 2032
- Figure 55: Asia Pacific Ultrasound Needle Guides Industry Revenue (Million), by Product 2024 & 2032
- Figure 56: Asia Pacific Ultrasound Needle Guides Industry Volume (K Units), by Product 2024 & 2032
- Figure 57: Asia Pacific Ultrasound Needle Guides Industry Revenue Share (%), by Product 2024 & 2032
- Figure 58: Asia Pacific Ultrasound Needle Guides Industry Volume Share (%), by Product 2024 & 2032
- Figure 59: Asia Pacific Ultrasound Needle Guides Industry Revenue (Million), by Application 2024 & 2032
- Figure 60: Asia Pacific Ultrasound Needle Guides Industry Volume (K Units), by Application 2024 & 2032
- Figure 61: Asia Pacific Ultrasound Needle Guides Industry Revenue Share (%), by Application 2024 & 2032
- Figure 62: Asia Pacific Ultrasound Needle Guides Industry Volume Share (%), by Application 2024 & 2032
- Figure 63: Asia Pacific Ultrasound Needle Guides Industry Revenue (Million), by End User 2024 & 2032
- Figure 64: Asia Pacific Ultrasound Needle Guides Industry Volume (K Units), by End User 2024 & 2032
- Figure 65: Asia Pacific Ultrasound Needle Guides Industry Revenue Share (%), by End User 2024 & 2032
- Figure 66: Asia Pacific Ultrasound Needle Guides Industry Volume Share (%), by End User 2024 & 2032
- Figure 67: Asia Pacific Ultrasound Needle Guides Industry Revenue (Million), by Country 2024 & 2032
- Figure 68: Asia Pacific Ultrasound Needle Guides Industry Volume (K Units), by Country 2024 & 2032
- Figure 69: Asia Pacific Ultrasound Needle Guides Industry Revenue Share (%), by Country 2024 & 2032
- Figure 70: Asia Pacific Ultrasound Needle Guides Industry Volume Share (%), by Country 2024 & 2032
- Figure 71: Middle East and Africa Ultrasound Needle Guides Industry Revenue (Million), by Product 2024 & 2032
- Figure 72: Middle East and Africa Ultrasound Needle Guides Industry Volume (K Units), by Product 2024 & 2032
- Figure 73: Middle East and Africa Ultrasound Needle Guides Industry Revenue Share (%), by Product 2024 & 2032
- Figure 74: Middle East and Africa Ultrasound Needle Guides Industry Volume Share (%), by Product 2024 & 2032
- Figure 75: Middle East and Africa Ultrasound Needle Guides Industry Revenue (Million), by Application 2024 & 2032
- Figure 76: Middle East and Africa Ultrasound Needle Guides Industry Volume (K Units), by Application 2024 & 2032
- Figure 77: Middle East and Africa Ultrasound Needle Guides Industry Revenue Share (%), by Application 2024 & 2032
- Figure 78: Middle East and Africa Ultrasound Needle Guides Industry Volume Share (%), by Application 2024 & 2032
- Figure 79: Middle East and Africa Ultrasound Needle Guides Industry Revenue (Million), by End User 2024 & 2032
- Figure 80: Middle East and Africa Ultrasound Needle Guides Industry Volume (K Units), by End User 2024 & 2032
- Figure 81: Middle East and Africa Ultrasound Needle Guides Industry Revenue Share (%), by End User 2024 & 2032
- Figure 82: Middle East and Africa Ultrasound Needle Guides Industry Volume Share (%), by End User 2024 & 2032
- Figure 83: Middle East and Africa Ultrasound Needle Guides Industry Revenue (Million), by Country 2024 & 2032
- Figure 84: Middle East and Africa Ultrasound Needle Guides Industry Volume (K Units), by Country 2024 & 2032
- Figure 85: Middle East and Africa Ultrasound Needle Guides Industry Revenue Share (%), by Country 2024 & 2032
- Figure 86: Middle East and Africa Ultrasound Needle Guides Industry Volume Share (%), by Country 2024 & 2032
- Figure 87: South America Ultrasound Needle Guides Industry Revenue (Million), by Product 2024 & 2032
- Figure 88: South America Ultrasound Needle Guides Industry Volume (K Units), by Product 2024 & 2032
- Figure 89: South America Ultrasound Needle Guides Industry Revenue Share (%), by Product 2024 & 2032
- Figure 90: South America Ultrasound Needle Guides Industry Volume Share (%), by Product 2024 & 2032
- Figure 91: South America Ultrasound Needle Guides Industry Revenue (Million), by Application 2024 & 2032
- Figure 92: South America Ultrasound Needle Guides Industry Volume (K Units), by Application 2024 & 2032
- Figure 93: South America Ultrasound Needle Guides Industry Revenue Share (%), by Application 2024 & 2032
- Figure 94: South America Ultrasound Needle Guides Industry Volume Share (%), by Application 2024 & 2032
- Figure 95: South America Ultrasound Needle Guides Industry Revenue (Million), by End User 2024 & 2032
- Figure 96: South America Ultrasound Needle Guides Industry Volume (K Units), by End User 2024 & 2032
- Figure 97: South America Ultrasound Needle Guides Industry Revenue Share (%), by End User 2024 & 2032
- Figure 98: South America Ultrasound Needle Guides Industry Volume Share (%), by End User 2024 & 2032
- Figure 99: South America Ultrasound Needle Guides Industry Revenue (Million), by Country 2024 & 2032
- Figure 100: South America Ultrasound Needle Guides Industry Volume (K Units), by Country 2024 & 2032
- Figure 101: South America Ultrasound Needle Guides Industry Revenue Share (%), by Country 2024 & 2032
- Figure 102: South America Ultrasound Needle Guides Industry Volume Share (%), by Country 2024 & 2032
List of Tables
- Table 1: Global Ultrasound Needle Guides Industry Revenue Million Forecast, by Region 2019 & 2032
- Table 2: Global Ultrasound Needle Guides Industry Volume K Units Forecast, by Region 2019 & 2032
- Table 3: Global Ultrasound Needle Guides Industry Revenue Million Forecast, by Product 2019 & 2032
- Table 4: Global Ultrasound Needle Guides Industry Volume K Units Forecast, by Product 2019 & 2032
- Table 5: Global Ultrasound Needle Guides Industry Revenue Million Forecast, by Application 2019 & 2032
- Table 6: Global Ultrasound Needle Guides Industry Volume K Units Forecast, by Application 2019 & 2032
- Table 7: Global Ultrasound Needle Guides Industry Revenue Million Forecast, by End User 2019 & 2032
- Table 8: Global Ultrasound Needle Guides Industry Volume K Units Forecast, by End User 2019 & 2032
- Table 9: Global Ultrasound Needle Guides Industry Revenue Million Forecast, by Region 2019 & 2032
- Table 10: Global Ultrasound Needle Guides Industry Volume K Units Forecast, by Region 2019 & 2032
- Table 11: Global Ultrasound Needle Guides Industry Revenue Million Forecast, by Country 2019 & 2032
- Table 12: Global Ultrasound Needle Guides Industry Volume K Units Forecast, by Country 2019 & 2032
- Table 13: United States Ultrasound Needle Guides Industry Revenue (Million) Forecast, by Application 2019 & 2032
- Table 14: United States Ultrasound Needle Guides Industry Volume (K Units) Forecast, by Application 2019 & 2032
- Table 15: Canada Ultrasound Needle Guides Industry Revenue (Million) Forecast, by Application 2019 & 2032
- Table 16: Canada Ultrasound Needle Guides Industry Volume (K Units) Forecast, by Application 2019 & 2032
- Table 17: Mexico Ultrasound Needle Guides Industry Revenue (Million) Forecast, by Application 2019 & 2032
- Table 18: Mexico Ultrasound Needle Guides Industry Volume (K Units) Forecast, by Application 2019 & 2032
- Table 19: Global Ultrasound Needle Guides Industry Revenue Million Forecast, by Country 2019 & 2032
- Table 20: Global Ultrasound Needle Guides Industry Volume K Units Forecast, by Country 2019 & 2032
- Table 21: Brazil Ultrasound Needle Guides Industry Revenue (Million) Forecast, by Application 2019 & 2032
- Table 22: Brazil Ultrasound Needle Guides Industry Volume (K Units) Forecast, by Application 2019 & 2032
- Table 23: Mexico Ultrasound Needle Guides Industry Revenue (Million) Forecast, by Application 2019 & 2032
- Table 24: Mexico Ultrasound Needle Guides Industry Volume (K Units) Forecast, by Application 2019 & 2032
- Table 25: Rest of South America Ultrasound Needle Guides Industry Revenue (Million) Forecast, by Application 2019 & 2032
- Table 26: Rest of South America Ultrasound Needle Guides Industry Volume (K Units) Forecast, by Application 2019 & 2032
- Table 27: Global Ultrasound Needle Guides Industry Revenue Million Forecast, by Country 2019 & 2032
- Table 28: Global Ultrasound Needle Guides Industry Volume K Units Forecast, by Country 2019 & 2032
- Table 29: Germany Ultrasound Needle Guides Industry Revenue (Million) Forecast, by Application 2019 & 2032
- Table 30: Germany Ultrasound Needle Guides Industry Volume (K Units) Forecast, by Application 2019 & 2032
- Table 31: United Kingdom Ultrasound Needle Guides Industry Revenue (Million) Forecast, by Application 2019 & 2032
- Table 32: United Kingdom Ultrasound Needle Guides Industry Volume (K Units) Forecast, by Application 2019 & 2032
- Table 33: France Ultrasound Needle Guides Industry Revenue (Million) Forecast, by Application 2019 & 2032
- Table 34: France Ultrasound Needle Guides Industry Volume (K Units) Forecast, by Application 2019 & 2032
- Table 35: Italy Ultrasound Needle Guides Industry Revenue (Million) Forecast, by Application 2019 & 2032
- Table 36: Italy Ultrasound Needle Guides Industry Volume (K Units) Forecast, by Application 2019 & 2032
- Table 37: Spain Ultrasound Needle Guides Industry Revenue (Million) Forecast, by Application 2019 & 2032
- Table 38: Spain Ultrasound Needle Guides Industry Volume (K Units) Forecast, by Application 2019 & 2032
- Table 39: Rest of Europe Ultrasound Needle Guides Industry Revenue (Million) Forecast, by Application 2019 & 2032
- Table 40: Rest of Europe Ultrasound Needle Guides Industry Volume (K Units) Forecast, by Application 2019 & 2032
- Table 41: Global Ultrasound Needle Guides Industry Revenue Million Forecast, by Country 2019 & 2032
- Table 42: Global Ultrasound Needle Guides Industry Volume K Units Forecast, by Country 2019 & 2032
- Table 43: China Ultrasound Needle Guides Industry Revenue (Million) Forecast, by Application 2019 & 2032
- Table 44: China Ultrasound Needle Guides Industry Volume (K Units) Forecast, by Application 2019 & 2032
- Table 45: Japan Ultrasound Needle Guides Industry Revenue (Million) Forecast, by Application 2019 & 2032
- Table 46: Japan Ultrasound Needle Guides Industry Volume (K Units) Forecast, by Application 2019 & 2032
- Table 47: India Ultrasound Needle Guides Industry Revenue (Million) Forecast, by Application 2019 & 2032
- Table 48: India Ultrasound Needle Guides Industry Volume (K Units) Forecast, by Application 2019 & 2032
- Table 49: South Korea Ultrasound Needle Guides Industry Revenue (Million) Forecast, by Application 2019 & 2032
- Table 50: South Korea Ultrasound Needle Guides Industry Volume (K Units) Forecast, by Application 2019 & 2032
- Table 51: Taiwan Ultrasound Needle Guides Industry Revenue (Million) Forecast, by Application 2019 & 2032
- Table 52: Taiwan Ultrasound Needle Guides Industry Volume (K Units) Forecast, by Application 2019 & 2032
- Table 53: Australia Ultrasound Needle Guides Industry Revenue (Million) Forecast, by Application 2019 & 2032
- Table 54: Australia Ultrasound Needle Guides Industry Volume (K Units) Forecast, by Application 2019 & 2032
- Table 55: Rest of Asia-Pacific Ultrasound Needle Guides Industry Revenue (Million) Forecast, by Application 2019 & 2032
- Table 56: Rest of Asia-Pacific Ultrasound Needle Guides Industry Volume (K Units) Forecast, by Application 2019 & 2032
- Table 57: Global Ultrasound Needle Guides Industry Revenue Million Forecast, by Country 2019 & 2032
- Table 58: Global Ultrasound Needle Guides Industry Volume K Units Forecast, by Country 2019 & 2032
- Table 59: Middle East Ultrasound Needle Guides Industry Revenue (Million) Forecast, by Application 2019 & 2032
- Table 60: Middle East Ultrasound Needle Guides Industry Volume (K Units) Forecast, by Application 2019 & 2032
- Table 61: Africa Ultrasound Needle Guides Industry Revenue (Million) Forecast, by Application 2019 & 2032
- Table 62: Africa Ultrasound Needle Guides Industry Volume (K Units) Forecast, by Application 2019 & 2032
- Table 63: Global Ultrasound Needle Guides Industry Revenue Million Forecast, by Product 2019 & 2032
- Table 64: Global Ultrasound Needle Guides Industry Volume K Units Forecast, by Product 2019 & 2032
- Table 65: Global Ultrasound Needle Guides Industry Revenue Million Forecast, by Application 2019 & 2032
- Table 66: Global Ultrasound Needle Guides Industry Volume K Units Forecast, by Application 2019 & 2032
- Table 67: Global Ultrasound Needle Guides Industry Revenue Million Forecast, by End User 2019 & 2032
- Table 68: Global Ultrasound Needle Guides Industry Volume K Units Forecast, by End User 2019 & 2032
- Table 69: Global Ultrasound Needle Guides Industry Revenue Million Forecast, by Country 2019 & 2032
- Table 70: Global Ultrasound Needle Guides Industry Volume K Units Forecast, by Country 2019 & 2032
- Table 71: United States Ultrasound Needle Guides Industry Revenue (Million) Forecast, by Application 2019 & 2032
- Table 72: United States Ultrasound Needle Guides Industry Volume (K Units) Forecast, by Application 2019 & 2032
- Table 73: Canada Ultrasound Needle Guides Industry Revenue (Million) Forecast, by Application 2019 & 2032
- Table 74: Canada Ultrasound Needle Guides Industry Volume (K Units) Forecast, by Application 2019 & 2032
- Table 75: Mexico Ultrasound Needle Guides Industry Revenue (Million) Forecast, by Application 2019 & 2032
- Table 76: Mexico Ultrasound Needle Guides Industry Volume (K Units) Forecast, by Application 2019 & 2032
- Table 77: Global Ultrasound Needle Guides Industry Revenue Million Forecast, by Product 2019 & 2032
- Table 78: Global Ultrasound Needle Guides Industry Volume K Units Forecast, by Product 2019 & 2032
- Table 79: Global Ultrasound Needle Guides Industry Revenue Million Forecast, by Application 2019 & 2032
- Table 80: Global Ultrasound Needle Guides Industry Volume K Units Forecast, by Application 2019 & 2032
- Table 81: Global Ultrasound Needle Guides Industry Revenue Million Forecast, by End User 2019 & 2032
- Table 82: Global Ultrasound Needle Guides Industry Volume K Units Forecast, by End User 2019 & 2032
- Table 83: Global Ultrasound Needle Guides Industry Revenue Million Forecast, by Country 2019 & 2032
- Table 84: Global Ultrasound Needle Guides Industry Volume K Units Forecast, by Country 2019 & 2032
- Table 85: United Kingdom Ultrasound Needle Guides Industry Revenue (Million) Forecast, by Application 2019 & 2032
- Table 86: United Kingdom Ultrasound Needle Guides Industry Volume (K Units) Forecast, by Application 2019 & 2032
- Table 87: France Ultrasound Needle Guides Industry Revenue (Million) Forecast, by Application 2019 & 2032
- Table 88: France Ultrasound Needle Guides Industry Volume (K Units) Forecast, by Application 2019 & 2032
- Table 89: Germany Ultrasound Needle Guides Industry Revenue (Million) Forecast, by Application 2019 & 2032
- Table 90: Germany Ultrasound Needle Guides Industry Volume (K Units) Forecast, by Application 2019 & 2032
- Table 91: Italy Ultrasound Needle Guides Industry Revenue (Million) Forecast, by Application 2019 & 2032
- Table 92: Italy Ultrasound Needle Guides Industry Volume (K Units) Forecast, by Application 2019 & 2032
- Table 93: Spain Ultrasound Needle Guides Industry Revenue (Million) Forecast, by Application 2019 & 2032
- Table 94: Spain Ultrasound Needle Guides Industry Volume (K Units) Forecast, by Application 2019 & 2032
- Table 95: Rest of Europe Ultrasound Needle Guides Industry Revenue (Million) Forecast, by Application 2019 & 2032
- Table 96: Rest of Europe Ultrasound Needle Guides Industry Volume (K Units) Forecast, by Application 2019 & 2032
- Table 97: Global Ultrasound Needle Guides Industry Revenue Million Forecast, by Product 2019 & 2032
- Table 98: Global Ultrasound Needle Guides Industry Volume K Units Forecast, by Product 2019 & 2032
- Table 99: Global Ultrasound Needle Guides Industry Revenue Million Forecast, by Application 2019 & 2032
- Table 100: Global Ultrasound Needle Guides Industry Volume K Units Forecast, by Application 2019 & 2032
- Table 101: Global Ultrasound Needle Guides Industry Revenue Million Forecast, by End User 2019 & 2032
- Table 102: Global Ultrasound Needle Guides Industry Volume K Units Forecast, by End User 2019 & 2032
- Table 103: Global Ultrasound Needle Guides Industry Revenue Million Forecast, by Country 2019 & 2032
- Table 104: Global Ultrasound Needle Guides Industry Volume K Units Forecast, by Country 2019 & 2032
- Table 105: India Ultrasound Needle Guides Industry Revenue (Million) Forecast, by Application 2019 & 2032
- Table 106: India Ultrasound Needle Guides Industry Volume (K Units) Forecast, by Application 2019 & 2032
- Table 107: China Ultrasound Needle Guides Industry Revenue (Million) Forecast, by Application 2019 & 2032
- Table 108: China Ultrasound Needle Guides Industry Volume (K Units) Forecast, by Application 2019 & 2032
- Table 109: Japan Ultrasound Needle Guides Industry Revenue (Million) Forecast, by Application 2019 & 2032
- Table 110: Japan Ultrasound Needle Guides Industry Volume (K Units) Forecast, by Application 2019 & 2032
- Table 111: Australia Ultrasound Needle Guides Industry Revenue (Million) Forecast, by Application 2019 & 2032
- Table 112: Australia Ultrasound Needle Guides Industry Volume (K Units) Forecast, by Application 2019 & 2032
- Table 113: South Korea Ultrasound Needle Guides Industry Revenue (Million) Forecast, by Application 2019 & 2032
- Table 114: South Korea Ultrasound Needle Guides Industry Volume (K Units) Forecast, by Application 2019 & 2032
- Table 115: Rest of Asia Pacific Ultrasound Needle Guides Industry Revenue (Million) Forecast, by Application 2019 & 2032
- Table 116: Rest of Asia Pacific Ultrasound Needle Guides Industry Volume (K Units) Forecast, by Application 2019 & 2032
- Table 117: Global Ultrasound Needle Guides Industry Revenue Million Forecast, by Product 2019 & 2032
- Table 118: Global Ultrasound Needle Guides Industry Volume K Units Forecast, by Product 2019 & 2032
- Table 119: Global Ultrasound Needle Guides Industry Revenue Million Forecast, by Application 2019 & 2032
- Table 120: Global Ultrasound Needle Guides Industry Volume K Units Forecast, by Application 2019 & 2032
- Table 121: Global Ultrasound Needle Guides Industry Revenue Million Forecast, by End User 2019 & 2032
- Table 122: Global Ultrasound Needle Guides Industry Volume K Units Forecast, by End User 2019 & 2032
- Table 123: Global Ultrasound Needle Guides Industry Revenue Million Forecast, by Country 2019 & 2032
- Table 124: Global Ultrasound Needle Guides Industry Volume K Units Forecast, by Country 2019 & 2032
- Table 125: GCC Ultrasound Needle Guides Industry Revenue (Million) Forecast, by Application 2019 & 2032
- Table 126: GCC Ultrasound Needle Guides Industry Volume (K Units) Forecast, by Application 2019 & 2032
- Table 127: South Africa Ultrasound Needle Guides Industry Revenue (Million) Forecast, by Application 2019 & 2032
- Table 128: South Africa Ultrasound Needle Guides Industry Volume (K Units) Forecast, by Application 2019 & 2032
- Table 129: Rest of Middle East and Africa Ultrasound Needle Guides Industry Revenue (Million) Forecast, by Application 2019 & 2032
- Table 130: Rest of Middle East and Africa Ultrasound Needle Guides Industry Volume (K Units) Forecast, by Application 2019 & 2032
- Table 131: Global Ultrasound Needle Guides Industry Revenue Million Forecast, by Product 2019 & 2032
- Table 132: Global Ultrasound Needle Guides Industry Volume K Units Forecast, by Product 2019 & 2032
- Table 133: Global Ultrasound Needle Guides Industry Revenue Million Forecast, by Application 2019 & 2032
- Table 134: Global Ultrasound Needle Guides Industry Volume K Units Forecast, by Application 2019 & 2032
- Table 135: Global Ultrasound Needle Guides Industry Revenue Million Forecast, by End User 2019 & 2032
- Table 136: Global Ultrasound Needle Guides Industry Volume K Units Forecast, by End User 2019 & 2032
- Table 137: Global Ultrasound Needle Guides Industry Revenue Million Forecast, by Country 2019 & 2032
- Table 138: Global Ultrasound Needle Guides Industry Volume K Units Forecast, by Country 2019 & 2032
- Table 139: Brazil Ultrasound Needle Guides Industry Revenue (Million) Forecast, by Application 2019 & 2032
- Table 140: Brazil Ultrasound Needle Guides Industry Volume (K Units) Forecast, by Application 2019 & 2032
- Table 141: Argentina Ultrasound Needle Guides Industry Revenue (Million) Forecast, by Application 2019 & 2032
- Table 142: Argentina Ultrasound Needle Guides Industry Volume (K Units) Forecast, by Application 2019 & 2032
- Table 143: Rest of South America Ultrasound Needle Guides Industry Revenue (Million) Forecast, by Application 2019 & 2032
- Table 144: Rest of South America Ultrasound Needle Guides Industry Volume (K Units) Forecast, by Application 2019 & 2032
Frequently Asked Questions
1. What is the projected Compound Annual Growth Rate (CAGR) of the Ultrasound Needle Guides Industry?
The projected CAGR is approximately 6.59%.
2. Which companies are prominent players in the Ultrasound Needle Guides Industry?
Key companies in the market include CONMED Corporation, Medi-Globe Corporation, Cook Group Incorporated, ENDO-FLEX GmbH, Medtronic PLC, ACE Medical Devices Pvt Ltd, Boston Scientific Corporation, Micro-Tech Endoscopy, Olympus Corporation.
3. What are the main segments of the Ultrasound Needle Guides Industry?
The market segments include Product, Application, End User.
4. Can you provide details about the market size?
The market size is estimated to be USD 152.06 Million as of 2022.
5. What are some drivers contributing to market growth?
Rising Geriatric Population; High Prevalence of Gastrointestinal Tract-related Cancers; Increasing Demand for Minimally Invasive Procedures.
6. What are the notable trends driving market growth?
Biopsy Needles Expected to Hold a Significant Share in the Market Over the Forecast Period.
7. Are there any restraints impacting market growth?
Lack of Expertise in Handling Endoscopic Ultrasound Needles.
8. Can you provide examples of recent developments in the market?
May 2022: Limaca Medical announced that they had received breakthrough device designation from the FDA for its Precision-GI endoscopic ultrasound biopsy needle. It is an automated, rotational cutting needle aiming to decrease sample tissue fragmentation, inadequate sample amount, and blood contamination.
9. What pricing options are available for accessing the report?
Pricing options include single-user, multi-user, and enterprise licenses priced at USD 4750, USD 5250, and USD 8750 respectively.
10. Is the market size provided in terms of value or volume?
The market size is provided in terms of value, measured in Million and volume, measured in K Units.
11. Are there any specific market keywords associated with the report?
Yes, the market keyword associated with the report is "Ultrasound Needle Guides Industry," which aids in identifying and referencing the specific market segment covered.
12. How do I determine which pricing option suits my needs best?
The pricing options vary based on user requirements and access needs. Individual users may opt for single-user licenses, while businesses requiring broader access may choose multi-user or enterprise licenses for cost-effective access to the report.
13. Are there any additional resources or data provided in the Ultrasound Needle Guides Industry report?
While the report offers comprehensive insights, it's advisable to review the specific contents or supplementary materials provided to ascertain if additional resources or data are available.
14. How can I stay updated on further developments or reports in the Ultrasound Needle Guides Industry?
To stay informed about further developments, trends, and reports in the Ultrasound Needle Guides Industry, consider subscribing to industry newsletters, following relevant companies and organizations, or regularly checking reputable industry news sources and publications.
Methodology
Step 1 - Identification of Relevant Samples Size from Population Database


Step 2 - Approaches for Defining Global Market Size (Value, Volume* & Price*)

Note*: In applicable scenarios
Step 3 - Data Sources
Primary Research
- Web Analytics
- Survey Reports
- Research Institute
- Latest Research Reports
- Opinion Leaders
Secondary Research
- Annual Reports
- White Paper
- Latest Press Release
- Industry Association
- Paid Database
- Investor Presentations

Step 4 - Data Triangulation
Involves using different sources of information in order to increase the validity of a study
These sources are likely to be stakeholders in a program - participants, other researchers, program staff, other community members, and so on.
Then we put all data in single framework & apply various statistical tools to find out the dynamic on the market.
During the analysis stage, feedback from the stakeholder groups would be compared to determine areas of agreement as well as areas of divergence


