
Key Insights
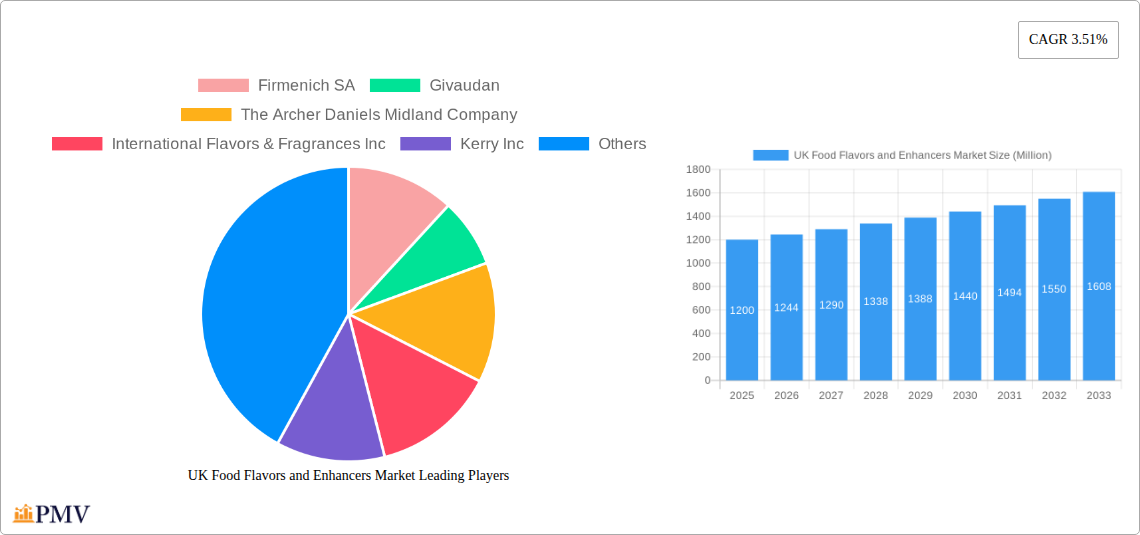
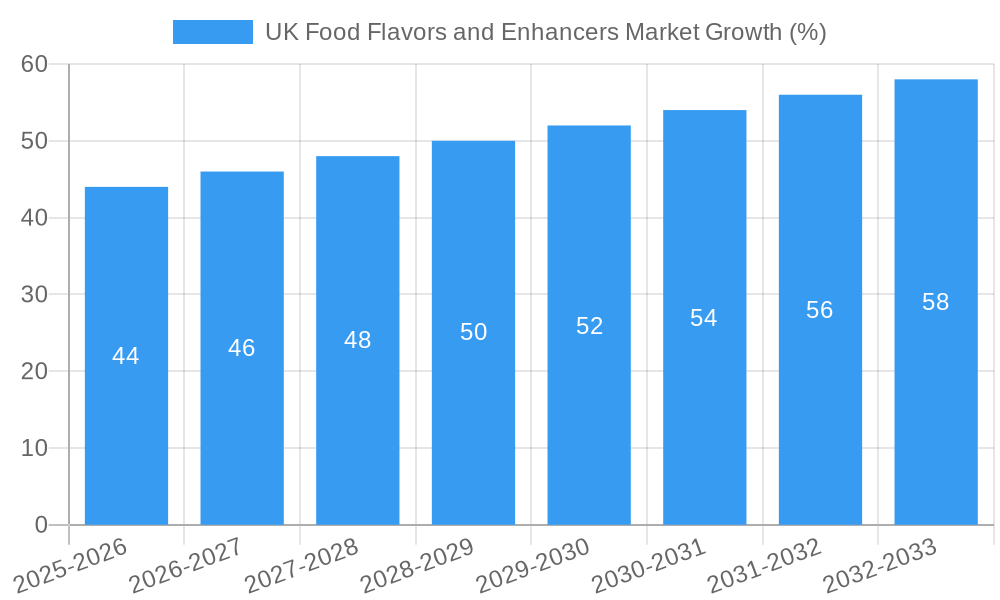
The UK food flavors and enhancers market, valued at approximately £1.2 billion in 2025, is projected to experience steady growth, exhibiting a Compound Annual Growth Rate (CAGR) of 3.51% from 2025 to 2033. This growth is fueled by several key drivers. The increasing demand for convenience foods and ready-to-eat meals necessitates the use of flavor enhancers to improve palatability and mask undesirable tastes. Furthermore, the rising popularity of diverse culinary experiences, influenced by globalization and increased consumer exposure to international cuisines, stimulates innovation in flavor profiles. Health-conscious consumers are also driving demand for natural and clean-label flavors, creating opportunities for nature-identical and organic options. The market is segmented by product type (natural flavors, nature-identical flavors, flavor enhancers) and application (bakery & confectionery, dairy, savory, soups, pastas & noodles, beverages, others). The bakery and confectionery segment currently holds a significant market share, driven by the enduring popularity of these product categories. However, the beverage and savory segments are expected to witness faster growth in the forecast period due to increased consumption of ready-to-drink beverages and ready meals.
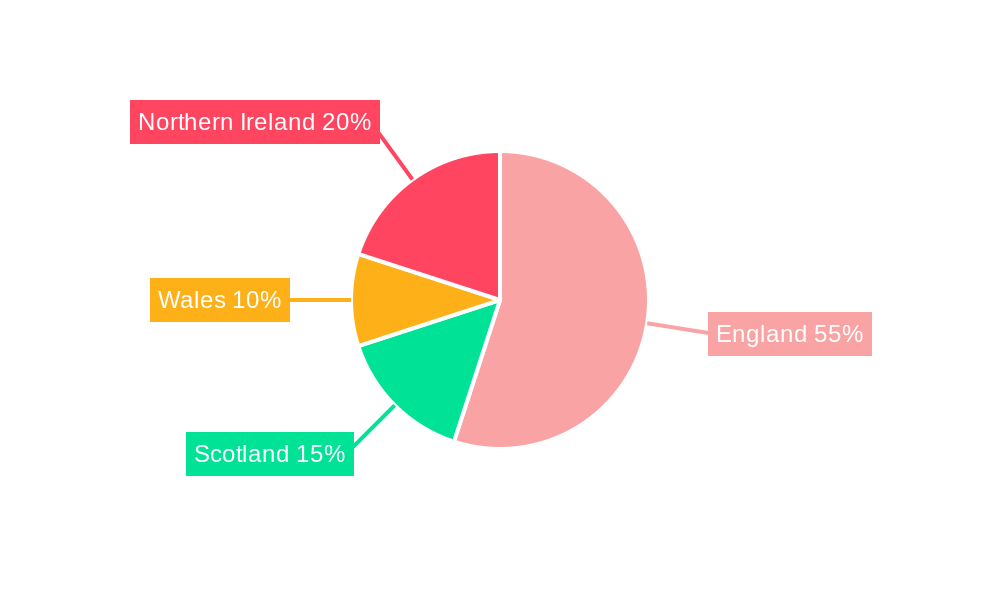
Competitive dynamics within the UK food flavors and enhancers market are characterized by the presence of several multinational giants including Firmenich SA, Givaudan, ADM, IFF, Kerry, Symrise, Sensient, and Sensate. These companies are focusing on both organic growth through new product development and strategic acquisitions to enhance their market positioning. The increasing regulatory scrutiny surrounding food additives and the growing consumer preference for transparency in ingredient labeling present both challenges and opportunities for market players. Companies are investing in research and development to create innovative, sustainable, and clean-label flavor solutions to meet evolving consumer preferences and maintain their market share. The market is expected to witness increased consolidation and strategic partnerships in the coming years, driven by the need for scale and access to new technologies. Regional variations within the UK market (England, Wales, Scotland, Northern Ireland) may exist but are expected to follow the overall national trend.
UK Food Flavors and Enhancers Market: A Comprehensive Report (2019-2033)
This in-depth report provides a comprehensive analysis of the UK food flavors and enhancers market, offering invaluable insights for businesses operating within this dynamic sector. Covering the period from 2019 to 2033, with a focus on 2025, this study meticulously examines market trends, competitive landscapes, and future growth prospects. The report utilizes rigorous data analysis and forecasting methodologies to deliver actionable intelligence for informed decision-making. The total market size in 2025 is estimated at £XX Million, with projected growth to £YY Million by 2033.
UK Food Flavors and Enhancers Market Market Structure & Competitive Dynamics
The UK food flavors and enhancers market exhibits a moderately concentrated structure, dominated by multinational players like Firmenich SA, Givaudan, The Archer Daniels Midland Company, International Flavors & Fragrances Inc, Kerry Inc, Symrise AG, Sensient Technologies Corporation, and Sensate Pty Ltd. However, smaller, specialized companies also contribute significantly, particularly in niche flavor profiles and regional markets. The market's competitive dynamics are shaped by factors including:
- Market Concentration: The top five players hold an estimated xx% market share collectively, indicating a consolidated yet competitive landscape.
- Innovation Ecosystems: Significant R&D investment drives innovation in natural and clean-label flavors, as well as customized solutions tailored to specific food applications.
- Regulatory Frameworks: Stringent regulations concerning food additives, labeling, and health claims influence product development and market access. Compliance costs and evolving regulations present both challenges and opportunities for market participants.
- Product Substitutes: The market faces competition from natural ingredients and alternative flavoring solutions, creating pressure to innovate and enhance product value propositions.
- End-User Trends: Growing consumer demand for natural, clean-label, and functional foods impacts the demand for specific flavor types, driving the need for tailored product offerings.
- M&A Activities: Consolidation through mergers and acquisitions is common, with deal values averaging £xx Million in recent years. This reflects the quest for market share expansion and technological advancements.
UK Food Flavors and Enhancers Market Industry Trends & Insights
The UK food flavors and enhancers market demonstrates robust growth, driven by several key factors. The projected Compound Annual Growth Rate (CAGR) from 2025 to 2033 is estimated at xx%. Market penetration rates vary across different applications, with the beverage and bakery segments exhibiting higher penetration compared to others. Key trends include:
- Health & Wellness Focus: Growing consumer awareness of health and wellness has fueled demand for clean-label, natural, and functional flavors, impacting ingredient sourcing and formulation strategies.
- Technological Disruptions: Advanced technologies such as artificial intelligence and machine learning are increasingly used in flavor development, enabling precise customization and efficient production processes.
- Consumer Preferences: Shifting consumer preferences toward diverse culinary experiences, ethnic foods, and personalized flavors are driving demand for a broader range of flavor profiles and applications.
- Competitive Dynamics: Intense competition among established players and the emergence of new entrants necessitate continuous innovation, strategic partnerships, and efficient supply chain management. Price competition and differentiation through unique product features are pivotal elements of competitive strategy.
Dominant Markets & Segments in UK Food Flavors and Enhancers Market
The UK food flavors and enhancers market demonstrates robust growth across various segments. The leading segment in terms of value is the Bakery and Confectionery application, driven by consistent demand for indulgent and flavored products.
- Leading Segment: Bakery and Confectionery
- Key Drivers: High consumption of baked goods and confectionery, strong demand for unique flavor profiles, and innovation in product formats.
- Other Significant Segments:
- Beverages: Growth driven by the demand for functional and flavored beverages.
- Dairy: Demand for enhanced flavor profiles in dairy products like yogurt and ice cream.
- Savory: Driven by trends in global cuisine and the desire for authentic flavor experiences in savory food products.
- Soups, Pastas, and Noodles: Growing demand for ready-to-eat meals and convenience foods.
- Other Applications: Includes meat products, snacks, and other food categories with growing demand for flavor enhancements.
The regional distribution of the market is relatively uniform, reflecting the widespread consumption of processed food across the UK. Economic factors like disposable income and consumer spending patterns influence segment growth across all regions.
UK Food Flavors and Enhancers Market Product Innovations
Significant advancements in flavor technology are revolutionizing the market. Recent product innovations include the development of natural and clean-label flavor solutions, mimicking conventional flavor profiles without artificial ingredients. Companies are increasingly focusing on customized flavor solutions tailored to specific food applications, leveraging advanced analytical techniques and sensory science. This focus caters to the rising demand for healthy and natural ingredients, driving product differentiation and competitive advantage.
Report Segmentation & Scope
This report segments the UK food flavors and enhancers market based on product type (Flavors, Nature Identical Flavors, Flavor Enhancers) and application (Bakery and Confectionery, Dairy, Savory, Soups, Pastas, and Noodles, Beverage, Other Applications). Each segment is analyzed in detail, including market size, growth projections, and competitive dynamics. Growth projections for each segment are based on historical data, current market trends, and future market forecasts.
Key Drivers of UK Food Flavors and Enhancers Market Growth
Growth in the UK food flavors and enhancers market is primarily driven by several factors:
- Rising Consumer Demand: Growing consumer demand for convenient, ready-to-eat meals, and flavorful processed foods is a key growth driver.
- Technological Advancements: Innovations in flavor technology, particularly in clean label and natural flavor solutions, are driving demand.
- Expanding Food Service Sector: The expansion of the food service industry and the growing demand for diverse culinary experiences are also significantly contributing to market growth.
Challenges in the UK Food Flavors and Enhancers Market Sector
The UK food flavors and enhancers market faces several challenges:
- Stringent Regulations: Strict regulations concerning food additives and labeling create compliance complexities and increase production costs.
- Supply Chain Disruptions: Global supply chain uncertainties can impact the availability of raw materials and impact production timelines.
- Price Competition: Intense price competition among market players can put pressure on profit margins.
Leading Players in the UK Food Flavors and Enhancers Market Market
- Firmenich SA
- Givaudan
- The Archer Daniels Midland Company
- International Flavors & Fragrances Inc
- Kerry Inc
- Symrise AG
- Sensient Technologies Corporation
- Sensate Pty Ltd
Key Developments in UK Food Flavors and Enhancers Market Sector
- 2023 (October): Kerry Inc. launched a new range of natural and clean-label flavor solutions for the dairy industry.
- 2022 (June): Givaudan acquired a smaller flavor house, expanding its portfolio of specialty flavors.
- 2021 (March): Firmenich invested in new technologies for sustainable flavor production. (Further details on specific developments would be included in the full report.)
Strategic UK Food Flavors and Enhancers Market Market Outlook
The UK food flavors and enhancers market presents significant growth potential, driven by continuous innovation, increasing consumer demand for customized flavor experiences, and the growing emphasis on health and wellness. Strategic opportunities lie in developing sustainable and natural flavor solutions, catering to the evolving consumer preferences and stricter regulatory landscape. Companies that can successfully adapt to changing consumer demands, leverage advanced technologies, and manage supply chain challenges will be well-positioned to capture significant market share in the years to come.
UK Food Flavors and Enhancers Market Segmentation
-
1. Product Type
-
1.1. Flavors
- 1.1.1. Natural Flavors
- 1.1.2. Synthetic Flavors
- 1.1.3. Nature Identical Flavors
- 1.2. Flavor Enhancers
-
1.1. Flavors
-
2. Application
- 2.1. Bakery and Confectionery
- 2.2. Dairy
- 2.3. Savory
- 2.4. Soups, Pastas, and Noodles
- 2.5. Beverage
- 2.6. Other Applications
UK Food Flavors and Enhancers Market Segmentation By Geography
-
1. North America
- 1.1. United States
- 1.2. Canada
- 1.3. Mexico
-
2. South America
- 2.1. Brazil
- 2.2. Argentina
- 2.3. Rest of South America
-
3. Europe
- 3.1. United Kingdom
- 3.2. Germany
- 3.3. France
- 3.4. Italy
- 3.5. Spain
- 3.6. Russia
- 3.7. Benelux
- 3.8. Nordics
- 3.9. Rest of Europe
-
4. Middle East & Africa
- 4.1. Turkey
- 4.2. Israel
- 4.3. GCC
- 4.4. North Africa
- 4.5. South Africa
- 4.6. Rest of Middle East & Africa
-
5. Asia Pacific
- 5.1. China
- 5.2. India
- 5.3. Japan
- 5.4. South Korea
- 5.5. ASEAN
- 5.6. Oceania
- 5.7. Rest of Asia Pacific
UK Food Flavors and Enhancers Market REPORT HIGHLIGHTS
| Aspects | Details |
|---|---|
| Study Period | 2019-2033 |
| Base Year | 2024 |
| Estimated Year | 2025 |
| Forecast Period | 2025-2033 |
| Historical Period | 2019-2024 |
| Growth Rate | CAGR of 3.51% from 2019-2033 |
| Segmentation |
|
Table of Contents
- 1. Introduction
- 1.1. Research Scope
- 1.2. Market Segmentation
- 1.3. Research Methodology
- 1.4. Definitions and Assumptions
- 2. Executive Summary
- 2.1. Introduction
- 3. Market Dynamics
- 3.1. Introduction
- 3.2. Market Drivers
- 3.2.1. Demand for Convenient Ready-to-Eat Food Products; Growing Affinity Toward Ethnic and Organic Frozen Ready Meals
- 3.3. Market Restrains
- 3.3.1. Rising Concerns Over Food Safety and Quality
- 3.4. Market Trends
- 3.4.1. Clean Label Holds Promising Future
- 4. Market Factor Analysis
- 4.1. Porters Five Forces
- 4.2. Supply/Value Chain
- 4.3. PESTEL analysis
- 4.4. Market Entropy
- 4.5. Patent/Trademark Analysis
- 5. Global UK Food Flavors and Enhancers Market Analysis, Insights and Forecast, 2019-2031
- 5.1. Market Analysis, Insights and Forecast - by Product Type
- 5.1.1. Flavors
- 5.1.1.1. Natural Flavors
- 5.1.1.2. Synthetic Flavors
- 5.1.1.3. Nature Identical Flavors
- 5.1.2. Flavor Enhancers
- 5.1.1. Flavors
- 5.2. Market Analysis, Insights and Forecast - by Application
- 5.2.1. Bakery and Confectionery
- 5.2.2. Dairy
- 5.2.3. Savory
- 5.2.4. Soups, Pastas, and Noodles
- 5.2.5. Beverage
- 5.2.6. Other Applications
- 5.3. Market Analysis, Insights and Forecast - by Region
- 5.3.1. North America
- 5.3.2. South America
- 5.3.3. Europe
- 5.3.4. Middle East & Africa
- 5.3.5. Asia Pacific
- 5.1. Market Analysis, Insights and Forecast - by Product Type
- 6. North America UK Food Flavors and Enhancers Market Analysis, Insights and Forecast, 2019-2031
- 6.1. Market Analysis, Insights and Forecast - by Product Type
- 6.1.1. Flavors
- 6.1.1.1. Natural Flavors
- 6.1.1.2. Synthetic Flavors
- 6.1.1.3. Nature Identical Flavors
- 6.1.2. Flavor Enhancers
- 6.1.1. Flavors
- 6.2. Market Analysis, Insights and Forecast - by Application
- 6.2.1. Bakery and Confectionery
- 6.2.2. Dairy
- 6.2.3. Savory
- 6.2.4. Soups, Pastas, and Noodles
- 6.2.5. Beverage
- 6.2.6. Other Applications
- 6.1. Market Analysis, Insights and Forecast - by Product Type
- 7. South America UK Food Flavors and Enhancers Market Analysis, Insights and Forecast, 2019-2031
- 7.1. Market Analysis, Insights and Forecast - by Product Type
- 7.1.1. Flavors
- 7.1.1.1. Natural Flavors
- 7.1.1.2. Synthetic Flavors
- 7.1.1.3. Nature Identical Flavors
- 7.1.2. Flavor Enhancers
- 7.1.1. Flavors
- 7.2. Market Analysis, Insights and Forecast - by Application
- 7.2.1. Bakery and Confectionery
- 7.2.2. Dairy
- 7.2.3. Savory
- 7.2.4. Soups, Pastas, and Noodles
- 7.2.5. Beverage
- 7.2.6. Other Applications
- 7.1. Market Analysis, Insights and Forecast - by Product Type
- 8. Europe UK Food Flavors and Enhancers Market Analysis, Insights and Forecast, 2019-2031
- 8.1. Market Analysis, Insights and Forecast - by Product Type
- 8.1.1. Flavors
- 8.1.1.1. Natural Flavors
- 8.1.1.2. Synthetic Flavors
- 8.1.1.3. Nature Identical Flavors
- 8.1.2. Flavor Enhancers
- 8.1.1. Flavors
- 8.2. Market Analysis, Insights and Forecast - by Application
- 8.2.1. Bakery and Confectionery
- 8.2.2. Dairy
- 8.2.3. Savory
- 8.2.4. Soups, Pastas, and Noodles
- 8.2.5. Beverage
- 8.2.6. Other Applications
- 8.1. Market Analysis, Insights and Forecast - by Product Type
- 9. Middle East & Africa UK Food Flavors and Enhancers Market Analysis, Insights and Forecast, 2019-2031
- 9.1. Market Analysis, Insights and Forecast - by Product Type
- 9.1.1. Flavors
- 9.1.1.1. Natural Flavors
- 9.1.1.2. Synthetic Flavors
- 9.1.1.3. Nature Identical Flavors
- 9.1.2. Flavor Enhancers
- 9.1.1. Flavors
- 9.2. Market Analysis, Insights and Forecast - by Application
- 9.2.1. Bakery and Confectionery
- 9.2.2. Dairy
- 9.2.3. Savory
- 9.2.4. Soups, Pastas, and Noodles
- 9.2.5. Beverage
- 9.2.6. Other Applications
- 9.1. Market Analysis, Insights and Forecast - by Product Type
- 10. Asia Pacific UK Food Flavors and Enhancers Market Analysis, Insights and Forecast, 2019-2031
- 10.1. Market Analysis, Insights and Forecast - by Product Type
- 10.1.1. Flavors
- 10.1.1.1. Natural Flavors
- 10.1.1.2. Synthetic Flavors
- 10.1.1.3. Nature Identical Flavors
- 10.1.2. Flavor Enhancers
- 10.1.1. Flavors
- 10.2. Market Analysis, Insights and Forecast - by Application
- 10.2.1. Bakery and Confectionery
- 10.2.2. Dairy
- 10.2.3. Savory
- 10.2.4. Soups, Pastas, and Noodles
- 10.2.5. Beverage
- 10.2.6. Other Applications
- 10.1. Market Analysis, Insights and Forecast - by Product Type
- 11. England UK Food Flavors and Enhancers Market Analysis, Insights and Forecast, 2019-2031
- 12. Wales UK Food Flavors and Enhancers Market Analysis, Insights and Forecast, 2019-2031
- 13. Scotland UK Food Flavors and Enhancers Market Analysis, Insights and Forecast, 2019-2031
- 14. Northern UK Food Flavors and Enhancers Market Analysis, Insights and Forecast, 2019-2031
- 15. Ireland UK Food Flavors and Enhancers Market Analysis, Insights and Forecast, 2019-2031
- 16. Competitive Analysis
- 16.1. Global Market Share Analysis 2024
- 16.2. Company Profiles
- 16.2.1 Firmenich SA
- 16.2.1.1. Overview
- 16.2.1.2. Products
- 16.2.1.3. SWOT Analysis
- 16.2.1.4. Recent Developments
- 16.2.1.5. Financials (Based on Availability)
- 16.2.2 Givaudan
- 16.2.2.1. Overview
- 16.2.2.2. Products
- 16.2.2.3. SWOT Analysis
- 16.2.2.4. Recent Developments
- 16.2.2.5. Financials (Based on Availability)
- 16.2.3 The Archer Daniels Midland Company
- 16.2.3.1. Overview
- 16.2.3.2. Products
- 16.2.3.3. SWOT Analysis
- 16.2.3.4. Recent Developments
- 16.2.3.5. Financials (Based on Availability)
- 16.2.4 International Flavors & Fragrances Inc
- 16.2.4.1. Overview
- 16.2.4.2. Products
- 16.2.4.3. SWOT Analysis
- 16.2.4.4. Recent Developments
- 16.2.4.5. Financials (Based on Availability)
- 16.2.5 Kerry Inc
- 16.2.5.1. Overview
- 16.2.5.2. Products
- 16.2.5.3. SWOT Analysis
- 16.2.5.4. Recent Developments
- 16.2.5.5. Financials (Based on Availability)
- 16.2.6 Symrise AG
- 16.2.6.1. Overview
- 16.2.6.2. Products
- 16.2.6.3. SWOT Analysis
- 16.2.6.4. Recent Developments
- 16.2.6.5. Financials (Based on Availability)
- 16.2.7 Sensient Technologies Corporation
- 16.2.7.1. Overview
- 16.2.7.2. Products
- 16.2.7.3. SWOT Analysis
- 16.2.7.4. Recent Developments
- 16.2.7.5. Financials (Based on Availability)
- 16.2.8 Sensate Pty Ltd*List Not Exhaustive
- 16.2.8.1. Overview
- 16.2.8.2. Products
- 16.2.8.3. SWOT Analysis
- 16.2.8.4. Recent Developments
- 16.2.8.5. Financials (Based on Availability)
- 16.2.1 Firmenich SA
List of Figures
- Figure 1: Global UK Food Flavors and Enhancers Market Revenue Breakdown (Million, %) by Region 2024 & 2032
- Figure 2: United kingdom UK Food Flavors and Enhancers Market Revenue (Million), by Country 2024 & 2032
- Figure 3: United kingdom UK Food Flavors and Enhancers Market Revenue Share (%), by Country 2024 & 2032
- Figure 4: North America UK Food Flavors and Enhancers Market Revenue (Million), by Product Type 2024 & 2032
- Figure 5: North America UK Food Flavors and Enhancers Market Revenue Share (%), by Product Type 2024 & 2032
- Figure 6: North America UK Food Flavors and Enhancers Market Revenue (Million), by Application 2024 & 2032
- Figure 7: North America UK Food Flavors and Enhancers Market Revenue Share (%), by Application 2024 & 2032
- Figure 8: North America UK Food Flavors and Enhancers Market Revenue (Million), by Country 2024 & 2032
- Figure 9: North America UK Food Flavors and Enhancers Market Revenue Share (%), by Country 2024 & 2032
- Figure 10: South America UK Food Flavors and Enhancers Market Revenue (Million), by Product Type 2024 & 2032
- Figure 11: South America UK Food Flavors and Enhancers Market Revenue Share (%), by Product Type 2024 & 2032
- Figure 12: South America UK Food Flavors and Enhancers Market Revenue (Million), by Application 2024 & 2032
- Figure 13: South America UK Food Flavors and Enhancers Market Revenue Share (%), by Application 2024 & 2032
- Figure 14: South America UK Food Flavors and Enhancers Market Revenue (Million), by Country 2024 & 2032
- Figure 15: South America UK Food Flavors and Enhancers Market Revenue Share (%), by Country 2024 & 2032
- Figure 16: Europe UK Food Flavors and Enhancers Market Revenue (Million), by Product Type 2024 & 2032
- Figure 17: Europe UK Food Flavors and Enhancers Market Revenue Share (%), by Product Type 2024 & 2032
- Figure 18: Europe UK Food Flavors and Enhancers Market Revenue (Million), by Application 2024 & 2032
- Figure 19: Europe UK Food Flavors and Enhancers Market Revenue Share (%), by Application 2024 & 2032
- Figure 20: Europe UK Food Flavors and Enhancers Market Revenue (Million), by Country 2024 & 2032
- Figure 21: Europe UK Food Flavors and Enhancers Market Revenue Share (%), by Country 2024 & 2032
- Figure 22: Middle East & Africa UK Food Flavors and Enhancers Market Revenue (Million), by Product Type 2024 & 2032
- Figure 23: Middle East & Africa UK Food Flavors and Enhancers Market Revenue Share (%), by Product Type 2024 & 2032
- Figure 24: Middle East & Africa UK Food Flavors and Enhancers Market Revenue (Million), by Application 2024 & 2032
- Figure 25: Middle East & Africa UK Food Flavors and Enhancers Market Revenue Share (%), by Application 2024 & 2032
- Figure 26: Middle East & Africa UK Food Flavors and Enhancers Market Revenue (Million), by Country 2024 & 2032
- Figure 27: Middle East & Africa UK Food Flavors and Enhancers Market Revenue Share (%), by Country 2024 & 2032
- Figure 28: Asia Pacific UK Food Flavors and Enhancers Market Revenue (Million), by Product Type 2024 & 2032
- Figure 29: Asia Pacific UK Food Flavors and Enhancers Market Revenue Share (%), by Product Type 2024 & 2032
- Figure 30: Asia Pacific UK Food Flavors and Enhancers Market Revenue (Million), by Application 2024 & 2032
- Figure 31: Asia Pacific UK Food Flavors and Enhancers Market Revenue Share (%), by Application 2024 & 2032
- Figure 32: Asia Pacific UK Food Flavors and Enhancers Market Revenue (Million), by Country 2024 & 2032
- Figure 33: Asia Pacific UK Food Flavors and Enhancers Market Revenue Share (%), by Country 2024 & 2032
List of Tables
- Table 1: Global UK Food Flavors and Enhancers Market Revenue Million Forecast, by Region 2019 & 2032
- Table 2: Global UK Food Flavors and Enhancers Market Revenue Million Forecast, by Product Type 2019 & 2032
- Table 3: Global UK Food Flavors and Enhancers Market Revenue Million Forecast, by Application 2019 & 2032
- Table 4: Global UK Food Flavors and Enhancers Market Revenue Million Forecast, by Region 2019 & 2032
- Table 5: Global UK Food Flavors and Enhancers Market Revenue Million Forecast, by Country 2019 & 2032
- Table 6: England UK Food Flavors and Enhancers Market Revenue (Million) Forecast, by Application 2019 & 2032
- Table 7: Wales UK Food Flavors and Enhancers Market Revenue (Million) Forecast, by Application 2019 & 2032
- Table 8: Scotland UK Food Flavors and Enhancers Market Revenue (Million) Forecast, by Application 2019 & 2032
- Table 9: Northern UK Food Flavors and Enhancers Market Revenue (Million) Forecast, by Application 2019 & 2032
- Table 10: Ireland UK Food Flavors and Enhancers Market Revenue (Million) Forecast, by Application 2019 & 2032
- Table 11: Global UK Food Flavors and Enhancers Market Revenue Million Forecast, by Product Type 2019 & 2032
- Table 12: Global UK Food Flavors and Enhancers Market Revenue Million Forecast, by Application 2019 & 2032
- Table 13: Global UK Food Flavors and Enhancers Market Revenue Million Forecast, by Country 2019 & 2032
- Table 14: United States UK Food Flavors and Enhancers Market Revenue (Million) Forecast, by Application 2019 & 2032
- Table 15: Canada UK Food Flavors and Enhancers Market Revenue (Million) Forecast, by Application 2019 & 2032
- Table 16: Mexico UK Food Flavors and Enhancers Market Revenue (Million) Forecast, by Application 2019 & 2032
- Table 17: Global UK Food Flavors and Enhancers Market Revenue Million Forecast, by Product Type 2019 & 2032
- Table 18: Global UK Food Flavors and Enhancers Market Revenue Million Forecast, by Application 2019 & 2032
- Table 19: Global UK Food Flavors and Enhancers Market Revenue Million Forecast, by Country 2019 & 2032
- Table 20: Brazil UK Food Flavors and Enhancers Market Revenue (Million) Forecast, by Application 2019 & 2032
- Table 21: Argentina UK Food Flavors and Enhancers Market Revenue (Million) Forecast, by Application 2019 & 2032
- Table 22: Rest of South America UK Food Flavors and Enhancers Market Revenue (Million) Forecast, by Application 2019 & 2032
- Table 23: Global UK Food Flavors and Enhancers Market Revenue Million Forecast, by Product Type 2019 & 2032
- Table 24: Global UK Food Flavors and Enhancers Market Revenue Million Forecast, by Application 2019 & 2032
- Table 25: Global UK Food Flavors and Enhancers Market Revenue Million Forecast, by Country 2019 & 2032
- Table 26: United Kingdom UK Food Flavors and Enhancers Market Revenue (Million) Forecast, by Application 2019 & 2032
- Table 27: Germany UK Food Flavors and Enhancers Market Revenue (Million) Forecast, by Application 2019 & 2032
- Table 28: France UK Food Flavors and Enhancers Market Revenue (Million) Forecast, by Application 2019 & 2032
- Table 29: Italy UK Food Flavors and Enhancers Market Revenue (Million) Forecast, by Application 2019 & 2032
- Table 30: Spain UK Food Flavors and Enhancers Market Revenue (Million) Forecast, by Application 2019 & 2032
- Table 31: Russia UK Food Flavors and Enhancers Market Revenue (Million) Forecast, by Application 2019 & 2032
- Table 32: Benelux UK Food Flavors and Enhancers Market Revenue (Million) Forecast, by Application 2019 & 2032
- Table 33: Nordics UK Food Flavors and Enhancers Market Revenue (Million) Forecast, by Application 2019 & 2032
- Table 34: Rest of Europe UK Food Flavors and Enhancers Market Revenue (Million) Forecast, by Application 2019 & 2032
- Table 35: Global UK Food Flavors and Enhancers Market Revenue Million Forecast, by Product Type 2019 & 2032
- Table 36: Global UK Food Flavors and Enhancers Market Revenue Million Forecast, by Application 2019 & 2032
- Table 37: Global UK Food Flavors and Enhancers Market Revenue Million Forecast, by Country 2019 & 2032
- Table 38: Turkey UK Food Flavors and Enhancers Market Revenue (Million) Forecast, by Application 2019 & 2032
- Table 39: Israel UK Food Flavors and Enhancers Market Revenue (Million) Forecast, by Application 2019 & 2032
- Table 40: GCC UK Food Flavors and Enhancers Market Revenue (Million) Forecast, by Application 2019 & 2032
- Table 41: North Africa UK Food Flavors and Enhancers Market Revenue (Million) Forecast, by Application 2019 & 2032
- Table 42: South Africa UK Food Flavors and Enhancers Market Revenue (Million) Forecast, by Application 2019 & 2032
- Table 43: Rest of Middle East & Africa UK Food Flavors and Enhancers Market Revenue (Million) Forecast, by Application 2019 & 2032
- Table 44: Global UK Food Flavors and Enhancers Market Revenue Million Forecast, by Product Type 2019 & 2032
- Table 45: Global UK Food Flavors and Enhancers Market Revenue Million Forecast, by Application 2019 & 2032
- Table 46: Global UK Food Flavors and Enhancers Market Revenue Million Forecast, by Country 2019 & 2032
- Table 47: China UK Food Flavors and Enhancers Market Revenue (Million) Forecast, by Application 2019 & 2032
- Table 48: India UK Food Flavors and Enhancers Market Revenue (Million) Forecast, by Application 2019 & 2032
- Table 49: Japan UK Food Flavors and Enhancers Market Revenue (Million) Forecast, by Application 2019 & 2032
- Table 50: South Korea UK Food Flavors and Enhancers Market Revenue (Million) Forecast, by Application 2019 & 2032
- Table 51: ASEAN UK Food Flavors and Enhancers Market Revenue (Million) Forecast, by Application 2019 & 2032
- Table 52: Oceania UK Food Flavors and Enhancers Market Revenue (Million) Forecast, by Application 2019 & 2032
- Table 53: Rest of Asia Pacific UK Food Flavors and Enhancers Market Revenue (Million) Forecast, by Application 2019 & 2032
Frequently Asked Questions
1. What is the projected Compound Annual Growth Rate (CAGR) of the UK Food Flavors and Enhancers Market?
The projected CAGR is approximately 3.51%.
2. Which companies are prominent players in the UK Food Flavors and Enhancers Market?
Key companies in the market include Firmenich SA, Givaudan, The Archer Daniels Midland Company, International Flavors & Fragrances Inc, Kerry Inc, Symrise AG, Sensient Technologies Corporation, Sensate Pty Ltd*List Not Exhaustive.
3. What are the main segments of the UK Food Flavors and Enhancers Market?
The market segments include Product Type, Application.
4. Can you provide details about the market size?
The market size is estimated to be USD XX Million as of 2022.
5. What are some drivers contributing to market growth?
Demand for Convenient Ready-to-Eat Food Products; Growing Affinity Toward Ethnic and Organic Frozen Ready Meals.
6. What are the notable trends driving market growth?
Clean Label Holds Promising Future.
7. Are there any restraints impacting market growth?
Rising Concerns Over Food Safety and Quality.
8. Can you provide examples of recent developments in the market?
N/A
9. What pricing options are available for accessing the report?
Pricing options include single-user, multi-user, and enterprise licenses priced at USD 3800, USD 4500, and USD 5800 respectively.
10. Is the market size provided in terms of value or volume?
The market size is provided in terms of value, measured in Million.
11. Are there any specific market keywords associated with the report?
Yes, the market keyword associated with the report is "UK Food Flavors and Enhancers Market," which aids in identifying and referencing the specific market segment covered.
12. How do I determine which pricing option suits my needs best?
The pricing options vary based on user requirements and access needs. Individual users may opt for single-user licenses, while businesses requiring broader access may choose multi-user or enterprise licenses for cost-effective access to the report.
13. Are there any additional resources or data provided in the UK Food Flavors and Enhancers Market report?
While the report offers comprehensive insights, it's advisable to review the specific contents or supplementary materials provided to ascertain if additional resources or data are available.
14. How can I stay updated on further developments or reports in the UK Food Flavors and Enhancers Market?
To stay informed about further developments, trends, and reports in the UK Food Flavors and Enhancers Market, consider subscribing to industry newsletters, following relevant companies and organizations, or regularly checking reputable industry news sources and publications.
Methodology
Step 1 - Identification of Relevant Samples Size from Population Database


Step 2 - Approaches for Defining Global Market Size (Value, Volume* & Price*)

Note*: In applicable scenarios
Step 3 - Data Sources
Primary Research
- Web Analytics
- Survey Reports
- Research Institute
- Latest Research Reports
- Opinion Leaders
Secondary Research
- Annual Reports
- White Paper
- Latest Press Release
- Industry Association
- Paid Database
- Investor Presentations

Step 4 - Data Triangulation
Involves using different sources of information in order to increase the validity of a study
These sources are likely to be stakeholders in a program - participants, other researchers, program staff, other community members, and so on.
Then we put all data in single framework & apply various statistical tools to find out the dynamic on the market.
During the analysis stage, feedback from the stakeholder groups would be compared to determine areas of agreement as well as areas of divergence


