
Key Insights
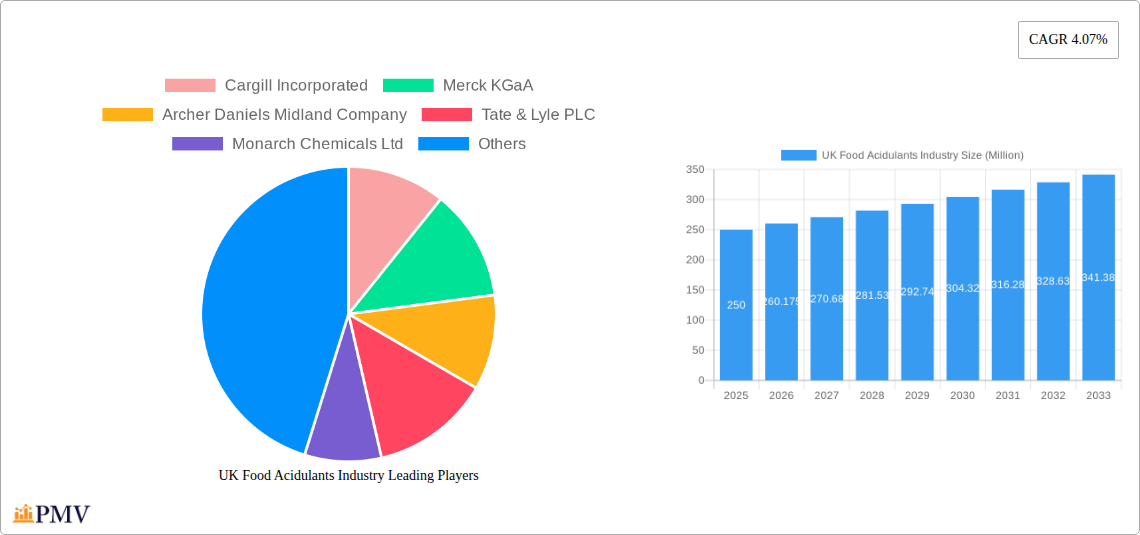
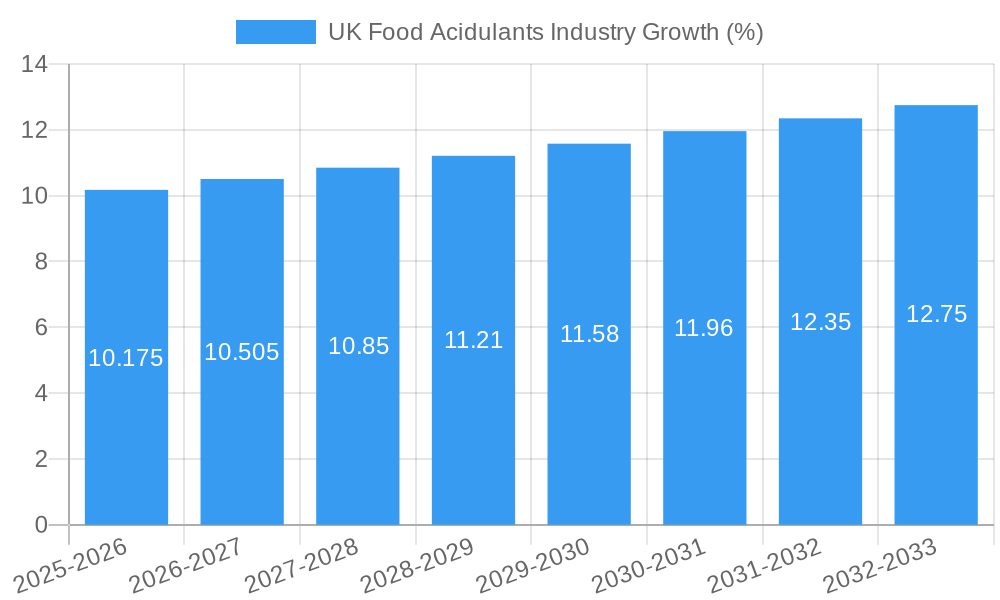
The UK food acidulants market, valued at approximately £250 million in 2025, is projected to experience steady growth, with a compound annual growth rate (CAGR) of 4.07% from 2025 to 2033. This expansion is driven by several key factors. The increasing demand for processed foods, particularly within the bakery, confectionery, and beverage sectors, fuels the need for acidulants to regulate pH, enhance flavor, and extend shelf life. Furthermore, the growing consumer preference for healthier and naturally sourced food additives is stimulating the demand for acidulants like citric and lactic acid, which are perceived as cleaner-label alternatives. The market is segmented by type (citric acid, phosphoric acid, lactic acid, and others) and application (beverages, dairy & frozen products, bakery, meat industry, confectionery, and others). Citric acid currently holds the largest market share due to its versatility and widespread use across various food applications. However, the lactic acid segment is expected to witness significant growth fueled by its natural origin and increasing health consciousness. Key players such as Cargill, Merck KGaA, and ADM are leveraging their established distribution networks and innovative product offerings to maintain a competitive edge in this growing market. The UK's robust food and beverage manufacturing industry, coupled with stringent food safety regulations, presents both opportunities and challenges for market participants.
Despite the positive outlook, the UK food acidulants market faces certain restraints. Fluctuations in raw material prices, especially for citric acid production, can impact profitability. Furthermore, increasing consumer awareness of artificial additives may lead to a shift towards natural preservatives, potentially impacting the demand for certain synthetic acidulants. The competitive landscape is characterized by both large multinational corporations and smaller specialized suppliers, leading to price competition and pressure on margins. To sustain growth, companies are investing in research and development to introduce novel acidulant formulations, focusing on improved functionality, enhanced organoleptic properties, and improved sustainability. The market's future success will hinge on these companies' ability to adapt to evolving consumer preferences, maintain cost-efficiency, and comply with regulatory requirements while catering to the diverse needs of the food and beverage industry in the UK.
UK Food Acidulants Industry Market Report: 2019-2033
This comprehensive report provides an in-depth analysis of the UK food acidulants industry, offering crucial insights for businesses, investors, and stakeholders seeking to understand this dynamic market. The study period covers 2019-2033, with a base year of 2025 and a forecast period of 2025-2033. The report segments the market by type (Citric Acid, Phosphoric Acid, Lactic Acid, Other Types) and application (Beverages, Dairy and Frozen Products, Bakery, Meat Industry, Confectionery, Other Applications), providing detailed market sizing and growth projections in Millions.
UK Food Acidulants Industry Market Structure & Competitive Dynamics
This section analyzes the UK food acidulants market's competitive landscape, encompassing market concentration, innovation, regulatory frameworks, product substitution, end-user trends, and mergers & acquisitions (M&A) activity. The market is moderately concentrated, with key players holding significant shares. For example, Cargill Incorporated and Tate & Lyle PLC individually command xx% and xx% market share respectively (2025 estimates). Innovation is driven by the need for natural and clean-label acidulants, triggering increased R&D spending. Stringent food safety regulations, such as those set by the FSA (Food Standards Agency), shape the industry landscape. The competitive dynamics are influenced by pricing strategies, product differentiation (e.g., organic options), and supply chain management. M&A activity has been relatively low in recent years with a total deal value of approximately £xx Million over the past five years, driven mainly by consolidation efforts among smaller players.
- Market Concentration: Moderately concentrated, with key players holding significant market shares.
- Innovation Ecosystems: Focus on natural and clean-label acidulants, driving R&D investments.
- Regulatory Frameworks: Stringent food safety regulations from the FSA influence industry practices.
- Product Substitutes: Limited direct substitutes, but consumer demand for natural alternatives poses a challenge.
- End-User Trends: Growing demand for healthier and more convenient food products drives market growth.
- M&A Activities: Low level of activity in recent years, with total deal value estimated at £xx Million (2019-2024).
UK Food Acidulants Industry Industry Trends & Insights
The UK food acidulants market is experiencing steady growth, driven by several factors. The increasing demand for processed foods and beverages fuels the market's expansion. Technological advancements, such as improved production processes and purification techniques, have led to increased efficiency and cost reductions. Consumer preference for healthier options (e.g., organic acidulants) and the rise of veganism are shaping the market. Meanwhile, intense competition among major players necessitates innovation and strategic partnerships. The market is projected to experience a Compound Annual Growth Rate (CAGR) of xx% during the forecast period (2025-2033), with market penetration expected to reach xx% by 2033.
Dominant Markets & Segments in UK Food Acidulants Industry
The beverages segment dominates the UK food acidulants market, accounting for xx% of total consumption (2025 estimates). Citric acid is the leading type of acidulant, with a market share of xx% (2025 estimates), driven by its versatility and widespread use in various food and beverage applications. This dominance is supported by strong consumer demand for carbonated drinks and fruit juices, along with the expanding use of citric acid as a preservative.
- Key Drivers for Beverages Segment:
- High demand for carbonated soft drinks and fruit juices
- Widespread use of citric acid as a preservative and flavour enhancer
- Increasing consumption of processed beverages.
- Key Drivers for Citric Acid Segment:
- Versatility and widespread applications across various food and beverage categories
- Cost-effectiveness compared to other acidulants
- Established supply chains and readily available production capacity
The dominance of these segments is further fueled by factors such as strong economic growth, robust infrastructure, and supportive government policies promoting the food processing industry.
UK Food Acidulants Industry Product Innovations
Recent innovations include the development of acidulants with enhanced functionality, such as improved solubility and stability, and the increased availability of organic and natural acidulants. Manufacturers are actively focusing on developing acidulants that meet the growing demand for clean-label products, free from artificial additives. These innovations aim to improve product quality, enhance shelf life, and meet specific consumer needs, thereby creating a competitive advantage in the market.
Report Segmentation & Scope
This report segments the UK food acidulants market by:
Type: Citric Acid (projected market size: £xx Million in 2025, CAGR xx%), Phosphoric Acid (£xx Million in 2025, CAGR xx%), Lactic Acid (£xx Million in 2025, CAGR xx%), Other Types (£xx Million in 2025, CAGR xx%). Each type exhibits unique growth trajectories driven by specific applications and consumer preferences.
Application: Beverages (£xx Million in 2025, CAGR xx%), Dairy and Frozen Products (£xx Million in 2025, CAGR xx%), Bakery (£xx Million in 2025, CAGR xx%), Meat Industry (£xx Million in 2025, CAGR xx%), Confectionery (£xx Million in 2025, CAGR xx%), Other Applications (£xx Million in 2025, CAGR xx%). Growth within each application segment depends on factors such as consumer demand, product innovation, and regulatory compliance.
Key Drivers of UK Food Acidulants Industry Growth
The UK food acidulants market growth is fueled by several factors: rising demand for processed foods, expanding food and beverage industry, increasing health consciousness (driving demand for natural acidulants), technological advancements in production, and supportive government regulations.
Challenges in the UK Food Acidulants Industry Sector
The UK food acidulants industry faces challenges including fluctuations in raw material prices, stringent regulatory compliance requirements, intense competition from both domestic and international players, and the ever-evolving consumer preferences for natural and clean-label products.
Leading Players in the UK Food Acidulants Industry Market
- Cargill Incorporated
- Merck KGaA
- Archer Daniels Midland Company
- Tate & Lyle PLC
- Monarch Chemicals Ltd
- Brenntag AG
- H Plus Limited
Key Developments in UK Food Acidulants Industry Sector
- 2022 Q3: Introduction of a new, sustainably sourced citric acid by Tate & Lyle PLC.
- 2023 Q1: Cargill Incorporated expands its UK production facility for lactic acid.
- 2024 Q2: New regulations regarding the labelling of food acidulants come into effect. (Further details would be needed to complete this section).
Strategic UK Food Acidulants Industry Market Outlook
The UK food acidulants market presents significant growth opportunities, driven by increasing demand for processed foods and beverages, particularly in the health and wellness sector. Strategic investments in research and development to create innovative, sustainable, and clean-label acidulants will be crucial for success. Companies that prioritize strong supply chain management and adapt to evolving consumer preferences will be well-positioned to capitalize on the market's future potential.
UK Food Acidulants Industry Segmentation
-
1. Type
- 1.1. Citric Acid
- 1.2. Phosphoric Acid
- 1.3. Lactic Acid
- 1.4. Other Types
-
2. Application
- 2.1. Beverages
- 2.2. Dairy and Frozen Products
- 2.3. Bakery
- 2.4. Meat Industry
- 2.5. Confectionery
- 2.6. Other Applications
UK Food Acidulants Industry Segmentation By Geography
-
1. North America
- 1.1. United States
- 1.2. Canada
- 1.3. Mexico
-
2. South America
- 2.1. Brazil
- 2.2. Argentina
- 2.3. Rest of South America
-
3. Europe
- 3.1. United Kingdom
- 3.2. Germany
- 3.3. France
- 3.4. Italy
- 3.5. Spain
- 3.6. Russia
- 3.7. Benelux
- 3.8. Nordics
- 3.9. Rest of Europe
-
4. Middle East & Africa
- 4.1. Turkey
- 4.2. Israel
- 4.3. GCC
- 4.4. North Africa
- 4.5. South Africa
- 4.6. Rest of Middle East & Africa
-
5. Asia Pacific
- 5.1. China
- 5.2. India
- 5.3. Japan
- 5.4. South Korea
- 5.5. ASEAN
- 5.6. Oceania
- 5.7. Rest of Asia Pacific
UK Food Acidulants Industry REPORT HIGHLIGHTS
| Aspects | Details |
|---|---|
| Study Period | 2019-2033 |
| Base Year | 2024 |
| Estimated Year | 2025 |
| Forecast Period | 2025-2033 |
| Historical Period | 2019-2024 |
| Growth Rate | CAGR of 4.07% from 2019-2033 |
| Segmentation |
|
Table of Contents
- 1. Introduction
- 1.1. Research Scope
- 1.2. Market Segmentation
- 1.3. Research Methodology
- 1.4. Definitions and Assumptions
- 2. Executive Summary
- 2.1. Introduction
- 3. Market Dynamics
- 3.1. Introduction
- 3.2. Market Drivers
- 3.2.1. Rising Application in Dietary Supplements
- 3.3. Market Restrains
- 3.3.1. Increasing prevalence of hydroglycemia
- 3.4. Market Trends
- 3.4.1. Phosphoric Acid Promises Growth in Future
- 4. Market Factor Analysis
- 4.1. Porters Five Forces
- 4.2. Supply/Value Chain
- 4.3. PESTEL analysis
- 4.4. Market Entropy
- 4.5. Patent/Trademark Analysis
- 5. Global UK Food Acidulants Industry Analysis, Insights and Forecast, 2019-2031
- 5.1. Market Analysis, Insights and Forecast - by Type
- 5.1.1. Citric Acid
- 5.1.2. Phosphoric Acid
- 5.1.3. Lactic Acid
- 5.1.4. Other Types
- 5.2. Market Analysis, Insights and Forecast - by Application
- 5.2.1. Beverages
- 5.2.2. Dairy and Frozen Products
- 5.2.3. Bakery
- 5.2.4. Meat Industry
- 5.2.5. Confectionery
- 5.2.6. Other Applications
- 5.3. Market Analysis, Insights and Forecast - by Region
- 5.3.1. North America
- 5.3.2. South America
- 5.3.3. Europe
- 5.3.4. Middle East & Africa
- 5.3.5. Asia Pacific
- 5.1. Market Analysis, Insights and Forecast - by Type
- 6. North America UK Food Acidulants Industry Analysis, Insights and Forecast, 2019-2031
- 6.1. Market Analysis, Insights and Forecast - by Type
- 6.1.1. Citric Acid
- 6.1.2. Phosphoric Acid
- 6.1.3. Lactic Acid
- 6.1.4. Other Types
- 6.2. Market Analysis, Insights and Forecast - by Application
- 6.2.1. Beverages
- 6.2.2. Dairy and Frozen Products
- 6.2.3. Bakery
- 6.2.4. Meat Industry
- 6.2.5. Confectionery
- 6.2.6. Other Applications
- 6.1. Market Analysis, Insights and Forecast - by Type
- 7. South America UK Food Acidulants Industry Analysis, Insights and Forecast, 2019-2031
- 7.1. Market Analysis, Insights and Forecast - by Type
- 7.1.1. Citric Acid
- 7.1.2. Phosphoric Acid
- 7.1.3. Lactic Acid
- 7.1.4. Other Types
- 7.2. Market Analysis, Insights and Forecast - by Application
- 7.2.1. Beverages
- 7.2.2. Dairy and Frozen Products
- 7.2.3. Bakery
- 7.2.4. Meat Industry
- 7.2.5. Confectionery
- 7.2.6. Other Applications
- 7.1. Market Analysis, Insights and Forecast - by Type
- 8. Europe UK Food Acidulants Industry Analysis, Insights and Forecast, 2019-2031
- 8.1. Market Analysis, Insights and Forecast - by Type
- 8.1.1. Citric Acid
- 8.1.2. Phosphoric Acid
- 8.1.3. Lactic Acid
- 8.1.4. Other Types
- 8.2. Market Analysis, Insights and Forecast - by Application
- 8.2.1. Beverages
- 8.2.2. Dairy and Frozen Products
- 8.2.3. Bakery
- 8.2.4. Meat Industry
- 8.2.5. Confectionery
- 8.2.6. Other Applications
- 8.1. Market Analysis, Insights and Forecast - by Type
- 9. Middle East & Africa UK Food Acidulants Industry Analysis, Insights and Forecast, 2019-2031
- 9.1. Market Analysis, Insights and Forecast - by Type
- 9.1.1. Citric Acid
- 9.1.2. Phosphoric Acid
- 9.1.3. Lactic Acid
- 9.1.4. Other Types
- 9.2. Market Analysis, Insights and Forecast - by Application
- 9.2.1. Beverages
- 9.2.2. Dairy and Frozen Products
- 9.2.3. Bakery
- 9.2.4. Meat Industry
- 9.2.5. Confectionery
- 9.2.6. Other Applications
- 9.1. Market Analysis, Insights and Forecast - by Type
- 10. Asia Pacific UK Food Acidulants Industry Analysis, Insights and Forecast, 2019-2031
- 10.1. Market Analysis, Insights and Forecast - by Type
- 10.1.1. Citric Acid
- 10.1.2. Phosphoric Acid
- 10.1.3. Lactic Acid
- 10.1.4. Other Types
- 10.2. Market Analysis, Insights and Forecast - by Application
- 10.2.1. Beverages
- 10.2.2. Dairy and Frozen Products
- 10.2.3. Bakery
- 10.2.4. Meat Industry
- 10.2.5. Confectionery
- 10.2.6. Other Applications
- 10.1. Market Analysis, Insights and Forecast - by Type
- 11. England UK Food Acidulants Industry Analysis, Insights and Forecast, 2019-2031
- 12. Wales UK Food Acidulants Industry Analysis, Insights and Forecast, 2019-2031
- 13. Scotland UK Food Acidulants Industry Analysis, Insights and Forecast, 2019-2031
- 14. Northern UK Food Acidulants Industry Analysis, Insights and Forecast, 2019-2031
- 15. Ireland UK Food Acidulants Industry Analysis, Insights and Forecast, 2019-2031
- 16. Competitive Analysis
- 16.1. Global Market Share Analysis 2024
- 16.2. Company Profiles
- 16.2.1 Cargill Incorporated
- 16.2.1.1. Overview
- 16.2.1.2. Products
- 16.2.1.3. SWOT Analysis
- 16.2.1.4. Recent Developments
- 16.2.1.5. Financials (Based on Availability)
- 16.2.2 Merck KGaA
- 16.2.2.1. Overview
- 16.2.2.2. Products
- 16.2.2.3. SWOT Analysis
- 16.2.2.4. Recent Developments
- 16.2.2.5. Financials (Based on Availability)
- 16.2.3 Archer Daniels Midland Company
- 16.2.3.1. Overview
- 16.2.3.2. Products
- 16.2.3.3. SWOT Analysis
- 16.2.3.4. Recent Developments
- 16.2.3.5. Financials (Based on Availability)
- 16.2.4 Tate & Lyle PLC
- 16.2.4.1. Overview
- 16.2.4.2. Products
- 16.2.4.3. SWOT Analysis
- 16.2.4.4. Recent Developments
- 16.2.4.5. Financials (Based on Availability)
- 16.2.5 Monarch Chemicals Ltd
- 16.2.5.1. Overview
- 16.2.5.2. Products
- 16.2.5.3. SWOT Analysis
- 16.2.5.4. Recent Developments
- 16.2.5.5. Financials (Based on Availability)
- 16.2.6 Brenntag AG
- 16.2.6.1. Overview
- 16.2.6.2. Products
- 16.2.6.3. SWOT Analysis
- 16.2.6.4. Recent Developments
- 16.2.6.5. Financials (Based on Availability)
- 16.2.7 H Plus Limited*List Not Exhaustive
- 16.2.7.1. Overview
- 16.2.7.2. Products
- 16.2.7.3. SWOT Analysis
- 16.2.7.4. Recent Developments
- 16.2.7.5. Financials (Based on Availability)
- 16.2.1 Cargill Incorporated
List of Figures
- Figure 1: Global UK Food Acidulants Industry Revenue Breakdown (Million, %) by Region 2024 & 2032
- Figure 2: Global UK Food Acidulants Industry Volume Breakdown (K Tons, %) by Region 2024 & 2032
- Figure 3: United kingdom Region UK Food Acidulants Industry Revenue (Million), by Country 2024 & 2032
- Figure 4: United kingdom Region UK Food Acidulants Industry Volume (K Tons), by Country 2024 & 2032
- Figure 5: United kingdom Region UK Food Acidulants Industry Revenue Share (%), by Country 2024 & 2032
- Figure 6: United kingdom Region UK Food Acidulants Industry Volume Share (%), by Country 2024 & 2032
- Figure 7: North America UK Food Acidulants Industry Revenue (Million), by Type 2024 & 2032
- Figure 8: North America UK Food Acidulants Industry Volume (K Tons), by Type 2024 & 2032
- Figure 9: North America UK Food Acidulants Industry Revenue Share (%), by Type 2024 & 2032
- Figure 10: North America UK Food Acidulants Industry Volume Share (%), by Type 2024 & 2032
- Figure 11: North America UK Food Acidulants Industry Revenue (Million), by Application 2024 & 2032
- Figure 12: North America UK Food Acidulants Industry Volume (K Tons), by Application 2024 & 2032
- Figure 13: North America UK Food Acidulants Industry Revenue Share (%), by Application 2024 & 2032
- Figure 14: North America UK Food Acidulants Industry Volume Share (%), by Application 2024 & 2032
- Figure 15: North America UK Food Acidulants Industry Revenue (Million), by Country 2024 & 2032
- Figure 16: North America UK Food Acidulants Industry Volume (K Tons), by Country 2024 & 2032
- Figure 17: North America UK Food Acidulants Industry Revenue Share (%), by Country 2024 & 2032
- Figure 18: North America UK Food Acidulants Industry Volume Share (%), by Country 2024 & 2032
- Figure 19: South America UK Food Acidulants Industry Revenue (Million), by Type 2024 & 2032
- Figure 20: South America UK Food Acidulants Industry Volume (K Tons), by Type 2024 & 2032
- Figure 21: South America UK Food Acidulants Industry Revenue Share (%), by Type 2024 & 2032
- Figure 22: South America UK Food Acidulants Industry Volume Share (%), by Type 2024 & 2032
- Figure 23: South America UK Food Acidulants Industry Revenue (Million), by Application 2024 & 2032
- Figure 24: South America UK Food Acidulants Industry Volume (K Tons), by Application 2024 & 2032
- Figure 25: South America UK Food Acidulants Industry Revenue Share (%), by Application 2024 & 2032
- Figure 26: South America UK Food Acidulants Industry Volume Share (%), by Application 2024 & 2032
- Figure 27: South America UK Food Acidulants Industry Revenue (Million), by Country 2024 & 2032
- Figure 28: South America UK Food Acidulants Industry Volume (K Tons), by Country 2024 & 2032
- Figure 29: South America UK Food Acidulants Industry Revenue Share (%), by Country 2024 & 2032
- Figure 30: South America UK Food Acidulants Industry Volume Share (%), by Country 2024 & 2032
- Figure 31: Europe UK Food Acidulants Industry Revenue (Million), by Type 2024 & 2032
- Figure 32: Europe UK Food Acidulants Industry Volume (K Tons), by Type 2024 & 2032
- Figure 33: Europe UK Food Acidulants Industry Revenue Share (%), by Type 2024 & 2032
- Figure 34: Europe UK Food Acidulants Industry Volume Share (%), by Type 2024 & 2032
- Figure 35: Europe UK Food Acidulants Industry Revenue (Million), by Application 2024 & 2032
- Figure 36: Europe UK Food Acidulants Industry Volume (K Tons), by Application 2024 & 2032
- Figure 37: Europe UK Food Acidulants Industry Revenue Share (%), by Application 2024 & 2032
- Figure 38: Europe UK Food Acidulants Industry Volume Share (%), by Application 2024 & 2032
- Figure 39: Europe UK Food Acidulants Industry Revenue (Million), by Country 2024 & 2032
- Figure 40: Europe UK Food Acidulants Industry Volume (K Tons), by Country 2024 & 2032
- Figure 41: Europe UK Food Acidulants Industry Revenue Share (%), by Country 2024 & 2032
- Figure 42: Europe UK Food Acidulants Industry Volume Share (%), by Country 2024 & 2032
- Figure 43: Middle East & Africa UK Food Acidulants Industry Revenue (Million), by Type 2024 & 2032
- Figure 44: Middle East & Africa UK Food Acidulants Industry Volume (K Tons), by Type 2024 & 2032
- Figure 45: Middle East & Africa UK Food Acidulants Industry Revenue Share (%), by Type 2024 & 2032
- Figure 46: Middle East & Africa UK Food Acidulants Industry Volume Share (%), by Type 2024 & 2032
- Figure 47: Middle East & Africa UK Food Acidulants Industry Revenue (Million), by Application 2024 & 2032
- Figure 48: Middle East & Africa UK Food Acidulants Industry Volume (K Tons), by Application 2024 & 2032
- Figure 49: Middle East & Africa UK Food Acidulants Industry Revenue Share (%), by Application 2024 & 2032
- Figure 50: Middle East & Africa UK Food Acidulants Industry Volume Share (%), by Application 2024 & 2032
- Figure 51: Middle East & Africa UK Food Acidulants Industry Revenue (Million), by Country 2024 & 2032
- Figure 52: Middle East & Africa UK Food Acidulants Industry Volume (K Tons), by Country 2024 & 2032
- Figure 53: Middle East & Africa UK Food Acidulants Industry Revenue Share (%), by Country 2024 & 2032
- Figure 54: Middle East & Africa UK Food Acidulants Industry Volume Share (%), by Country 2024 & 2032
- Figure 55: Asia Pacific UK Food Acidulants Industry Revenue (Million), by Type 2024 & 2032
- Figure 56: Asia Pacific UK Food Acidulants Industry Volume (K Tons), by Type 2024 & 2032
- Figure 57: Asia Pacific UK Food Acidulants Industry Revenue Share (%), by Type 2024 & 2032
- Figure 58: Asia Pacific UK Food Acidulants Industry Volume Share (%), by Type 2024 & 2032
- Figure 59: Asia Pacific UK Food Acidulants Industry Revenue (Million), by Application 2024 & 2032
- Figure 60: Asia Pacific UK Food Acidulants Industry Volume (K Tons), by Application 2024 & 2032
- Figure 61: Asia Pacific UK Food Acidulants Industry Revenue Share (%), by Application 2024 & 2032
- Figure 62: Asia Pacific UK Food Acidulants Industry Volume Share (%), by Application 2024 & 2032
- Figure 63: Asia Pacific UK Food Acidulants Industry Revenue (Million), by Country 2024 & 2032
- Figure 64: Asia Pacific UK Food Acidulants Industry Volume (K Tons), by Country 2024 & 2032
- Figure 65: Asia Pacific UK Food Acidulants Industry Revenue Share (%), by Country 2024 & 2032
- Figure 66: Asia Pacific UK Food Acidulants Industry Volume Share (%), by Country 2024 & 2032
List of Tables
- Table 1: Global UK Food Acidulants Industry Revenue Million Forecast, by Region 2019 & 2032
- Table 2: Global UK Food Acidulants Industry Volume K Tons Forecast, by Region 2019 & 2032
- Table 3: Global UK Food Acidulants Industry Revenue Million Forecast, by Type 2019 & 2032
- Table 4: Global UK Food Acidulants Industry Volume K Tons Forecast, by Type 2019 & 2032
- Table 5: Global UK Food Acidulants Industry Revenue Million Forecast, by Application 2019 & 2032
- Table 6: Global UK Food Acidulants Industry Volume K Tons Forecast, by Application 2019 & 2032
- Table 7: Global UK Food Acidulants Industry Revenue Million Forecast, by Region 2019 & 2032
- Table 8: Global UK Food Acidulants Industry Volume K Tons Forecast, by Region 2019 & 2032
- Table 9: Global UK Food Acidulants Industry Revenue Million Forecast, by Country 2019 & 2032
- Table 10: Global UK Food Acidulants Industry Volume K Tons Forecast, by Country 2019 & 2032
- Table 11: England UK Food Acidulants Industry Revenue (Million) Forecast, by Application 2019 & 2032
- Table 12: England UK Food Acidulants Industry Volume (K Tons) Forecast, by Application 2019 & 2032
- Table 13: Wales UK Food Acidulants Industry Revenue (Million) Forecast, by Application 2019 & 2032
- Table 14: Wales UK Food Acidulants Industry Volume (K Tons) Forecast, by Application 2019 & 2032
- Table 15: Scotland UK Food Acidulants Industry Revenue (Million) Forecast, by Application 2019 & 2032
- Table 16: Scotland UK Food Acidulants Industry Volume (K Tons) Forecast, by Application 2019 & 2032
- Table 17: Northern UK Food Acidulants Industry Revenue (Million) Forecast, by Application 2019 & 2032
- Table 18: Northern UK Food Acidulants Industry Volume (K Tons) Forecast, by Application 2019 & 2032
- Table 19: Ireland UK Food Acidulants Industry Revenue (Million) Forecast, by Application 2019 & 2032
- Table 20: Ireland UK Food Acidulants Industry Volume (K Tons) Forecast, by Application 2019 & 2032
- Table 21: Global UK Food Acidulants Industry Revenue Million Forecast, by Type 2019 & 2032
- Table 22: Global UK Food Acidulants Industry Volume K Tons Forecast, by Type 2019 & 2032
- Table 23: Global UK Food Acidulants Industry Revenue Million Forecast, by Application 2019 & 2032
- Table 24: Global UK Food Acidulants Industry Volume K Tons Forecast, by Application 2019 & 2032
- Table 25: Global UK Food Acidulants Industry Revenue Million Forecast, by Country 2019 & 2032
- Table 26: Global UK Food Acidulants Industry Volume K Tons Forecast, by Country 2019 & 2032
- Table 27: United States UK Food Acidulants Industry Revenue (Million) Forecast, by Application 2019 & 2032
- Table 28: United States UK Food Acidulants Industry Volume (K Tons) Forecast, by Application 2019 & 2032
- Table 29: Canada UK Food Acidulants Industry Revenue (Million) Forecast, by Application 2019 & 2032
- Table 30: Canada UK Food Acidulants Industry Volume (K Tons) Forecast, by Application 2019 & 2032
- Table 31: Mexico UK Food Acidulants Industry Revenue (Million) Forecast, by Application 2019 & 2032
- Table 32: Mexico UK Food Acidulants Industry Volume (K Tons) Forecast, by Application 2019 & 2032
- Table 33: Global UK Food Acidulants Industry Revenue Million Forecast, by Type 2019 & 2032
- Table 34: Global UK Food Acidulants Industry Volume K Tons Forecast, by Type 2019 & 2032
- Table 35: Global UK Food Acidulants Industry Revenue Million Forecast, by Application 2019 & 2032
- Table 36: Global UK Food Acidulants Industry Volume K Tons Forecast, by Application 2019 & 2032
- Table 37: Global UK Food Acidulants Industry Revenue Million Forecast, by Country 2019 & 2032
- Table 38: Global UK Food Acidulants Industry Volume K Tons Forecast, by Country 2019 & 2032
- Table 39: Brazil UK Food Acidulants Industry Revenue (Million) Forecast, by Application 2019 & 2032
- Table 40: Brazil UK Food Acidulants Industry Volume (K Tons) Forecast, by Application 2019 & 2032
- Table 41: Argentina UK Food Acidulants Industry Revenue (Million) Forecast, by Application 2019 & 2032
- Table 42: Argentina UK Food Acidulants Industry Volume (K Tons) Forecast, by Application 2019 & 2032
- Table 43: Rest of South America UK Food Acidulants Industry Revenue (Million) Forecast, by Application 2019 & 2032
- Table 44: Rest of South America UK Food Acidulants Industry Volume (K Tons) Forecast, by Application 2019 & 2032
- Table 45: Global UK Food Acidulants Industry Revenue Million Forecast, by Type 2019 & 2032
- Table 46: Global UK Food Acidulants Industry Volume K Tons Forecast, by Type 2019 & 2032
- Table 47: Global UK Food Acidulants Industry Revenue Million Forecast, by Application 2019 & 2032
- Table 48: Global UK Food Acidulants Industry Volume K Tons Forecast, by Application 2019 & 2032
- Table 49: Global UK Food Acidulants Industry Revenue Million Forecast, by Country 2019 & 2032
- Table 50: Global UK Food Acidulants Industry Volume K Tons Forecast, by Country 2019 & 2032
- Table 51: United Kingdom UK Food Acidulants Industry Revenue (Million) Forecast, by Application 2019 & 2032
- Table 52: United Kingdom UK Food Acidulants Industry Volume (K Tons) Forecast, by Application 2019 & 2032
- Table 53: Germany UK Food Acidulants Industry Revenue (Million) Forecast, by Application 2019 & 2032
- Table 54: Germany UK Food Acidulants Industry Volume (K Tons) Forecast, by Application 2019 & 2032
- Table 55: France UK Food Acidulants Industry Revenue (Million) Forecast, by Application 2019 & 2032
- Table 56: France UK Food Acidulants Industry Volume (K Tons) Forecast, by Application 2019 & 2032
- Table 57: Italy UK Food Acidulants Industry Revenue (Million) Forecast, by Application 2019 & 2032
- Table 58: Italy UK Food Acidulants Industry Volume (K Tons) Forecast, by Application 2019 & 2032
- Table 59: Spain UK Food Acidulants Industry Revenue (Million) Forecast, by Application 2019 & 2032
- Table 60: Spain UK Food Acidulants Industry Volume (K Tons) Forecast, by Application 2019 & 2032
- Table 61: Russia UK Food Acidulants Industry Revenue (Million) Forecast, by Application 2019 & 2032
- Table 62: Russia UK Food Acidulants Industry Volume (K Tons) Forecast, by Application 2019 & 2032
- Table 63: Benelux UK Food Acidulants Industry Revenue (Million) Forecast, by Application 2019 & 2032
- Table 64: Benelux UK Food Acidulants Industry Volume (K Tons) Forecast, by Application 2019 & 2032
- Table 65: Nordics UK Food Acidulants Industry Revenue (Million) Forecast, by Application 2019 & 2032
- Table 66: Nordics UK Food Acidulants Industry Volume (K Tons) Forecast, by Application 2019 & 2032
- Table 67: Rest of Europe UK Food Acidulants Industry Revenue (Million) Forecast, by Application 2019 & 2032
- Table 68: Rest of Europe UK Food Acidulants Industry Volume (K Tons) Forecast, by Application 2019 & 2032
- Table 69: Global UK Food Acidulants Industry Revenue Million Forecast, by Type 2019 & 2032
- Table 70: Global UK Food Acidulants Industry Volume K Tons Forecast, by Type 2019 & 2032
- Table 71: Global UK Food Acidulants Industry Revenue Million Forecast, by Application 2019 & 2032
- Table 72: Global UK Food Acidulants Industry Volume K Tons Forecast, by Application 2019 & 2032
- Table 73: Global UK Food Acidulants Industry Revenue Million Forecast, by Country 2019 & 2032
- Table 74: Global UK Food Acidulants Industry Volume K Tons Forecast, by Country 2019 & 2032
- Table 75: Turkey UK Food Acidulants Industry Revenue (Million) Forecast, by Application 2019 & 2032
- Table 76: Turkey UK Food Acidulants Industry Volume (K Tons) Forecast, by Application 2019 & 2032
- Table 77: Israel UK Food Acidulants Industry Revenue (Million) Forecast, by Application 2019 & 2032
- Table 78: Israel UK Food Acidulants Industry Volume (K Tons) Forecast, by Application 2019 & 2032
- Table 79: GCC UK Food Acidulants Industry Revenue (Million) Forecast, by Application 2019 & 2032
- Table 80: GCC UK Food Acidulants Industry Volume (K Tons) Forecast, by Application 2019 & 2032
- Table 81: North Africa UK Food Acidulants Industry Revenue (Million) Forecast, by Application 2019 & 2032
- Table 82: North Africa UK Food Acidulants Industry Volume (K Tons) Forecast, by Application 2019 & 2032
- Table 83: South Africa UK Food Acidulants Industry Revenue (Million) Forecast, by Application 2019 & 2032
- Table 84: South Africa UK Food Acidulants Industry Volume (K Tons) Forecast, by Application 2019 & 2032
- Table 85: Rest of Middle East & Africa UK Food Acidulants Industry Revenue (Million) Forecast, by Application 2019 & 2032
- Table 86: Rest of Middle East & Africa UK Food Acidulants Industry Volume (K Tons) Forecast, by Application 2019 & 2032
- Table 87: Global UK Food Acidulants Industry Revenue Million Forecast, by Type 2019 & 2032
- Table 88: Global UK Food Acidulants Industry Volume K Tons Forecast, by Type 2019 & 2032
- Table 89: Global UK Food Acidulants Industry Revenue Million Forecast, by Application 2019 & 2032
- Table 90: Global UK Food Acidulants Industry Volume K Tons Forecast, by Application 2019 & 2032
- Table 91: Global UK Food Acidulants Industry Revenue Million Forecast, by Country 2019 & 2032
- Table 92: Global UK Food Acidulants Industry Volume K Tons Forecast, by Country 2019 & 2032
- Table 93: China UK Food Acidulants Industry Revenue (Million) Forecast, by Application 2019 & 2032
- Table 94: China UK Food Acidulants Industry Volume (K Tons) Forecast, by Application 2019 & 2032
- Table 95: India UK Food Acidulants Industry Revenue (Million) Forecast, by Application 2019 & 2032
- Table 96: India UK Food Acidulants Industry Volume (K Tons) Forecast, by Application 2019 & 2032
- Table 97: Japan UK Food Acidulants Industry Revenue (Million) Forecast, by Application 2019 & 2032
- Table 98: Japan UK Food Acidulants Industry Volume (K Tons) Forecast, by Application 2019 & 2032
- Table 99: South Korea UK Food Acidulants Industry Revenue (Million) Forecast, by Application 2019 & 2032
- Table 100: South Korea UK Food Acidulants Industry Volume (K Tons) Forecast, by Application 2019 & 2032
- Table 101: ASEAN UK Food Acidulants Industry Revenue (Million) Forecast, by Application 2019 & 2032
- Table 102: ASEAN UK Food Acidulants Industry Volume (K Tons) Forecast, by Application 2019 & 2032
- Table 103: Oceania UK Food Acidulants Industry Revenue (Million) Forecast, by Application 2019 & 2032
- Table 104: Oceania UK Food Acidulants Industry Volume (K Tons) Forecast, by Application 2019 & 2032
- Table 105: Rest of Asia Pacific UK Food Acidulants Industry Revenue (Million) Forecast, by Application 2019 & 2032
- Table 106: Rest of Asia Pacific UK Food Acidulants Industry Volume (K Tons) Forecast, by Application 2019 & 2032
Frequently Asked Questions
1. What is the projected Compound Annual Growth Rate (CAGR) of the UK Food Acidulants Industry?
The projected CAGR is approximately 4.07%.
2. Which companies are prominent players in the UK Food Acidulants Industry?
Key companies in the market include Cargill Incorporated, Merck KGaA, Archer Daniels Midland Company, Tate & Lyle PLC, Monarch Chemicals Ltd, Brenntag AG, H Plus Limited*List Not Exhaustive.
3. What are the main segments of the UK Food Acidulants Industry?
The market segments include Type, Application.
4. Can you provide details about the market size?
The market size is estimated to be USD XX Million as of 2022.
5. What are some drivers contributing to market growth?
Rising Application in Dietary Supplements.
6. What are the notable trends driving market growth?
Phosphoric Acid Promises Growth in Future.
7. Are there any restraints impacting market growth?
Increasing prevalence of hydroglycemia.
8. Can you provide examples of recent developments in the market?
N/A
9. What pricing options are available for accessing the report?
Pricing options include single-user, multi-user, and enterprise licenses priced at USD 3800, USD 4500, and USD 5800 respectively.
10. Is the market size provided in terms of value or volume?
The market size is provided in terms of value, measured in Million and volume, measured in K Tons.
11. Are there any specific market keywords associated with the report?
Yes, the market keyword associated with the report is "UK Food Acidulants Industry," which aids in identifying and referencing the specific market segment covered.
12. How do I determine which pricing option suits my needs best?
The pricing options vary based on user requirements and access needs. Individual users may opt for single-user licenses, while businesses requiring broader access may choose multi-user or enterprise licenses for cost-effective access to the report.
13. Are there any additional resources or data provided in the UK Food Acidulants Industry report?
While the report offers comprehensive insights, it's advisable to review the specific contents or supplementary materials provided to ascertain if additional resources or data are available.
14. How can I stay updated on further developments or reports in the UK Food Acidulants Industry?
To stay informed about further developments, trends, and reports in the UK Food Acidulants Industry, consider subscribing to industry newsletters, following relevant companies and organizations, or regularly checking reputable industry news sources and publications.
Methodology
Step 1 - Identification of Relevant Samples Size from Population Database


Step 2 - Approaches for Defining Global Market Size (Value, Volume* & Price*)

Note*: In applicable scenarios
Step 3 - Data Sources
Primary Research
- Web Analytics
- Survey Reports
- Research Institute
- Latest Research Reports
- Opinion Leaders
Secondary Research
- Annual Reports
- White Paper
- Latest Press Release
- Industry Association
- Paid Database
- Investor Presentations

Step 4 - Data Triangulation
Involves using different sources of information in order to increase the validity of a study
These sources are likely to be stakeholders in a program - participants, other researchers, program staff, other community members, and so on.
Then we put all data in single framework & apply various statistical tools to find out the dynamic on the market.
During the analysis stage, feedback from the stakeholder groups would be compared to determine areas of agreement as well as areas of divergence


