
Key Insights
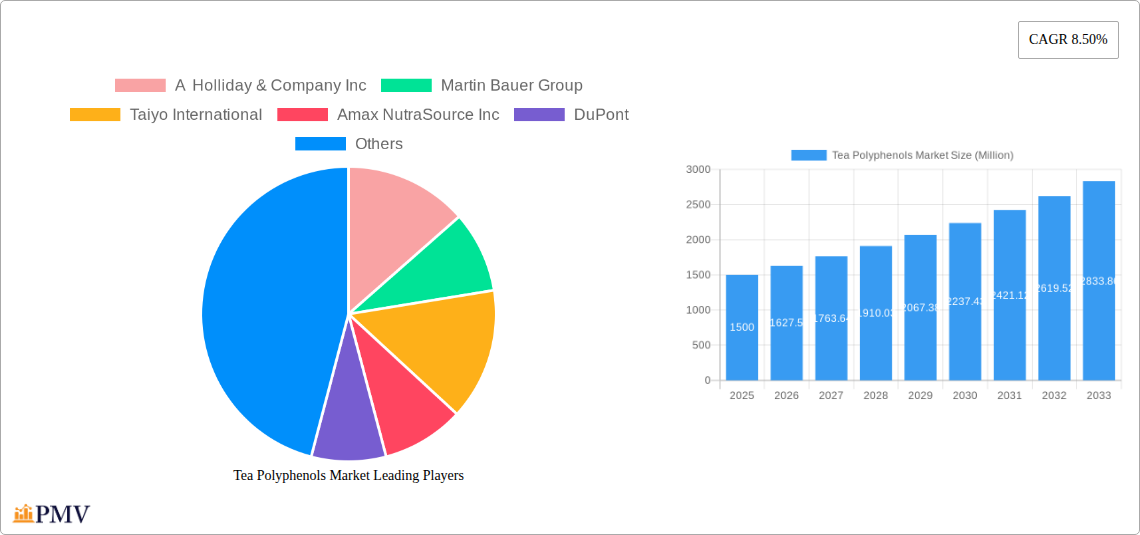
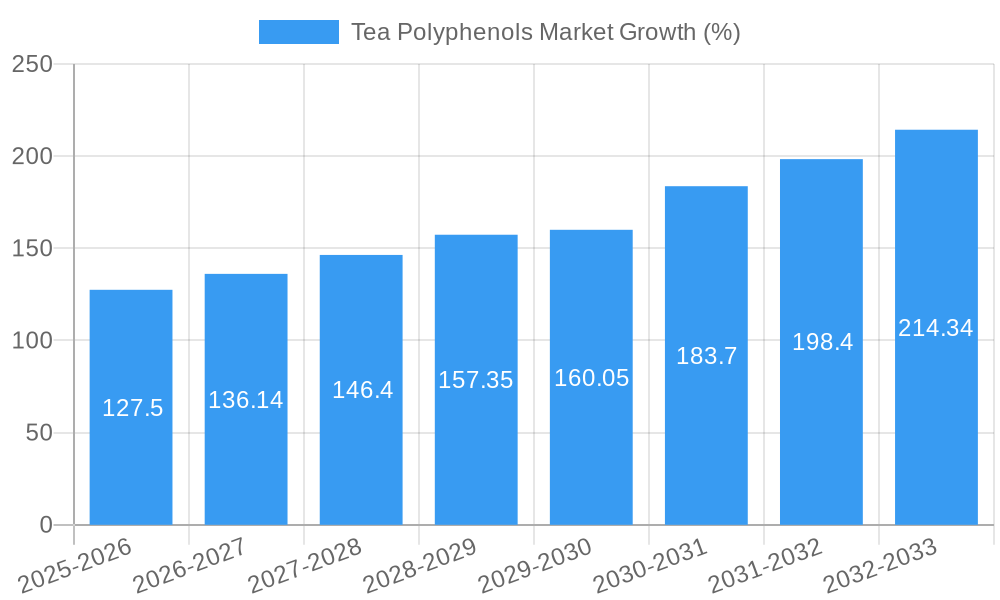
The global tea polyphenols market is experiencing robust growth, driven by increasing consumer awareness of the health benefits associated with these natural antioxidants. The market's expansion is fueled by the rising demand for functional foods and beverages, particularly in developed regions like North America and Europe, where health-conscious consumers are actively seeking natural alternatives to synthetic additives. The food and beverage sector remains the dominant application segment, leveraging tea polyphenols for their preservative and enriching properties in various products ranging from teas and juices to confectionery. The cosmetic and dietary supplement industries also contribute significantly to market growth, utilizing tea polyphenols for their antioxidant and anti-aging properties in skincare products and supplements aimed at boosting immunity and overall well-being. A projected CAGR of 8.50% from 2025 to 2033 suggests a substantial market expansion over the forecast period. This growth is expected to be further propelled by innovations in extraction technologies leading to higher quality and more cost-effective production of tea polyphenols. However, challenges such as fluctuations in tea leaf prices and the development of standardized quality control measures present potential restraints to market growth.
Competitive dynamics within the tea polyphenols market are characterized by the presence of both established global players and smaller, specialized firms. Companies like A Holliday & Company Inc, Martin Bauer Group, and Taiyo International are major contributors, leveraging their established supply chains and extensive research capabilities. The market is also witnessing the emergence of innovative companies focused on developing novel applications and delivery systems for tea polyphenols. Geographical expansion is another key trend, with emerging markets in Asia-Pacific and South America showing significant potential for growth as consumer awareness and disposable incomes increase. The market's success hinges on continued research into the diverse health benefits of tea polyphenols and the development of sustainable and efficient extraction processes. Furthermore, clear regulatory frameworks and labeling guidelines concerning the safety and efficacy of tea polyphenol-based products are crucial for maintaining consumer trust and driving further market expansion.
Tea Polyphenols Market: A Comprehensive Report (2019-2033)
This in-depth report provides a comprehensive analysis of the global Tea Polyphenols Market, offering invaluable insights for stakeholders across the value chain. Covering the historical period (2019-2024), base year (2025), and forecast period (2025-2033), this study meticulously examines market dynamics, competitive landscapes, and future growth potential. With a focus on key segments like Food and Beverage, Cosmetics, and Dietary Supplements, this report is an indispensable resource for businesses seeking to navigate this dynamic market. The market size is projected to reach xx Million by 2033, exhibiting a CAGR of xx% during the forecast period.
Tea Polyphenols Market Market Structure & Competitive Dynamics
The Tea Polyphenols Market exhibits a moderately concentrated structure, with key players like A Holliday & Company Inc, Martin Bauer Group, Taiyo International, Amax NutraSource Inc, DuPont, IFF (Frutarom Health), SV Agrofood, and Sabinsa holding significant market share. However, the presence of numerous smaller players indicates a competitive landscape. Innovation ecosystems are crucial, with companies investing heavily in R&D to develop novel extraction techniques and applications. Regulatory frameworks vary across regions, impacting market access and product formulations. Product substitutes, such as other antioxidants, pose a competitive challenge. End-user trends toward natural and functional ingredients drive market growth. M&A activities have been moderate, with deal values averaging xx Million in recent years. Examples include [insert specific examples of M&A activities with deal values if available, otherwise state "Specific M&A deal details are not publicly available at this time."]. Market share data for major players is detailed within the full report.
- Market Concentration: Moderately Concentrated
- Innovation Ecosystem: Active R&D and new product development
- Regulatory Framework: Regionally Varying
- Product Substitutes: Other antioxidants
- End-User Trends: Increasing demand for natural and functional ingredients
- M&A Activity: Moderate, with average deal values of xx Million
Tea Polyphenols Market Industry Trends & Insights
The Tea Polyphenols Market is experiencing robust growth driven by several key factors. The rising consumer awareness of health benefits associated with antioxidants and the increasing demand for natural ingredients in food and beverages are major drivers. Technological advancements in extraction and purification techniques are enhancing product quality and reducing costs. Consumer preferences are shifting towards clean-label products, further fueling market expansion. The market penetration of tea polyphenols in dietary supplements is increasing rapidly, while their use in cosmetics is also gaining traction. Competitive dynamics involve innovation in product formulation and delivery systems. The market is projected to witness significant growth, with a CAGR of xx% from 2025 to 2033. Market penetration in the food and beverage sector is estimated at xx% in 2025, projected to reach xx% by 2033.
Dominant Markets & Segments in Tea Polyphenols Market
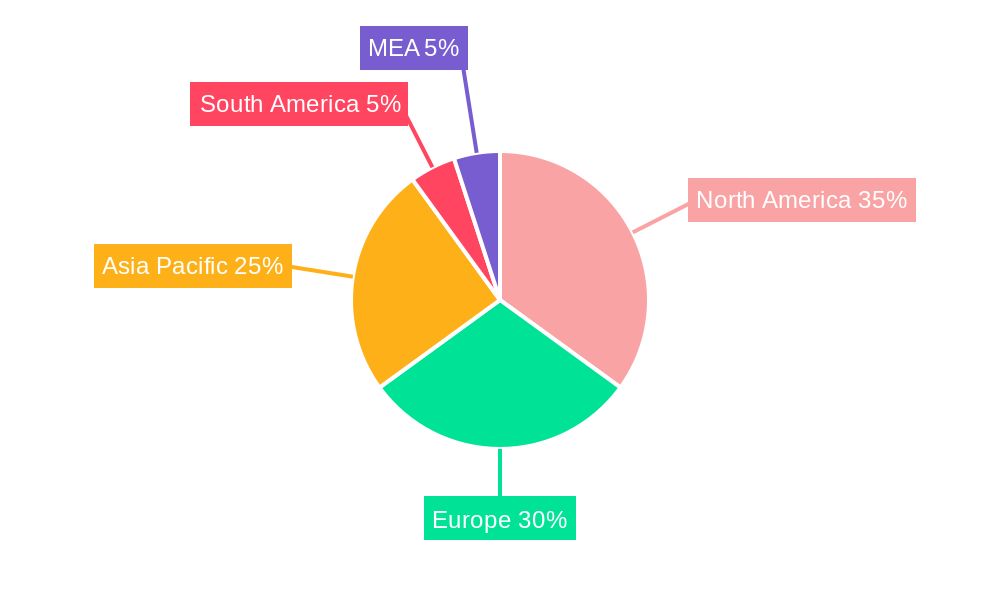
The Asia-Pacific region dominates the Tea Polyphenols Market, driven by high tea consumption, burgeoning health-conscious populations, and favorable economic conditions. Specifically, China and India are leading national markets due to their vast tea production and growing demand for functional foods and beverages.
Key Drivers for Asia-Pacific Dominance:
- High Tea Consumption
- Growing Health-Conscious Population
- Strong Economic Growth
- Favorable Government Policies Supporting the Food and Beverage Industry
- Well-established Tea Processing and Extraction Infrastructure
Within the application segments, the Food and Beverage sector holds the largest market share, driven by the increasing incorporation of tea polyphenols as natural antioxidants and functional ingredients. The Cosmetics segment is experiencing rapid growth, fueled by the demand for natural and effective skincare ingredients. Dietary Supplements represent a significant and rapidly growing segment driven by increasing consumer awareness of health benefits and preventative care.
Dominance Analysis:
The Asia-Pacific region's dominance stems from its large consumer base, high tea consumption, and established supply chains. Within applications, the Food & Beverage sector’s lead is due to the versatility and wide acceptance of tea polyphenols in various food products.
Tea Polyphenols Market Product Innovations
Recent innovations focus on improving the bioavailability and stability of tea polyphenols through encapsulation and microencapsulation technologies. Novel extraction methods are also being developed to enhance yield and purity. These advancements improve the efficacy and market fit of tea polyphenol-based products, leading to greater adoption across various applications. The competitive advantage lies in developing cost-effective and sustainable production methods alongside superior product quality.
Report Segmentation & Scope
The report segments the Tea Polyphenols Market by application:
Food and Beverage: This segment includes the use of tea polyphenols in various food and beverage products to enhance their functional properties and shelf life. Market size is projected to reach xx Million by 2033, with a CAGR of xx%. Competitive dynamics are driven by innovation in product formulation and delivery systems.
Cosmetics: This segment encompasses the application of tea polyphenols in skincare and personal care products due to their antioxidant and anti-aging properties. Market size is estimated at xx Million in 2025, projected to reach xx Million by 2033, with a CAGR of xx%. The competitive landscape focuses on developing innovative formulations and demonstrating efficacy.
Dietary Supplements: This segment involves the use of tea polyphenols in dietary supplements to promote health and well-being. Market size is expected to be xx Million in 2025 and grow to xx Million by 2033, with a CAGR of xx%. Competition centers around product efficacy, branding, and market reach.
Key Drivers of Tea Polyphenols Market Growth
The increasing demand for natural and functional food ingredients, coupled with growing consumer awareness of health benefits associated with antioxidants, is a key driver. Technological advancements in extraction and purification processes are improving the quality and efficiency of tea polyphenol production. Favorable regulatory environments in several regions are also facilitating market growth. The rising prevalence of chronic diseases is encouraging greater consumption of functional foods and supplements containing tea polyphenols.
Challenges in the Tea Polyphenols Market Sector
Fluctuations in raw material prices, along with seasonal variations in tea production, can impact supply chain stability. Stringent regulatory requirements for food and beverage additives pose challenges for manufacturers. Intense competition from other antioxidants and functional ingredients requires continuous innovation and differentiation. Maintaining consistent product quality and bioavailability across different formulations presents a technical challenge.
Leading Players in the Tea Polyphenols Market Market
- A Holliday & Company Inc
- Martin Bauer Group
- Taiyo International
- Amax NutraSource Inc
- DuPont
- IFF (Frutarom Health)
- SV Agrofood
- Sabinsa
Key Developments in Tea Polyphenols Market Sector
- January 2023: Taiyo International launches a new line of sustainably sourced tea polyphenols.
- June 2022: A Holliday & Company Inc. invests in a new extraction facility to increase production capacity.
- October 2021: Martin Bauer Group announces a strategic partnership to expand distribution channels.
- [Add more developments with dates if available. Otherwise, state: Further detailed information on specific key developments will be available in the full report.]
Strategic Tea Polyphenols Market Market Outlook
The Tea Polyphenols Market is poised for substantial growth in the coming years, driven by ongoing trends towards health and wellness, increasing demand for natural ingredients, and technological advancements in extraction and delivery systems. Strategic opportunities lie in developing innovative products tailored to specific health benefits, expanding into new markets, and establishing strategic partnerships to improve supply chain efficiency and market reach. The focus on sustainability and traceability will also be crucial for future success.
Tea Polyphenols Market Segmentation
-
1. Application
- 1.1. Food and Beverage
- 1.2. Cosmetics
- 1.3. Dietary Supplements
Tea Polyphenols Market Segmentation By Geography
-
1. North America
- 1.1. United States
- 1.2. Canada
- 1.3. Mexico
- 1.4. Rest of North America
-
2. Europe
- 2.1. Spain
- 2.2. United Kingdom
- 2.3. Germany
- 2.4. France
- 2.5. Italy
- 2.6. Russia
- 2.7. Rest of Europe
-
3. Asia Pacific
- 3.1. China
- 3.2. Japan
- 3.3. India
- 3.4. Australia
- 3.5. Rest of Asia Pacific
- 4. Rest of the World
Tea Polyphenols Market REPORT HIGHLIGHTS
| Aspects | Details |
|---|---|
| Study Period | 2019-2033 |
| Base Year | 2024 |
| Estimated Year | 2025 |
| Forecast Period | 2025-2033 |
| Historical Period | 2019-2024 |
| Growth Rate | CAGR of 8.50% from 2019-2033 |
| Segmentation |
|
Table of Contents
- 1. Introduction
- 1.1. Research Scope
- 1.2. Market Segmentation
- 1.3. Research Methodology
- 1.4. Definitions and Assumptions
- 2. Executive Summary
- 2.1. Introduction
- 3. Market Dynamics
- 3.1. Introduction
- 3.2. Market Drivers
- 3.2.1. Rising Demand for Clean Label Food & Beverage Products; Rising Demand for Dairy Products
- 3.3. Market Restrains
- 3.3.1. Presence of Preservatives in Ready Meals may Hamper the Market Growth
- 3.4. Market Trends
- 3.4.1. Increasing Usage of Plant-based Polyphenols in Nutraceuticals
- 4. Market Factor Analysis
- 4.1. Porters Five Forces
- 4.2. Supply/Value Chain
- 4.3. PESTEL analysis
- 4.4. Market Entropy
- 4.5. Patent/Trademark Analysis
- 5. Global Tea Polyphenols Market Analysis, Insights and Forecast, 2019-2031
- 5.1. Market Analysis, Insights and Forecast - by Application
- 5.1.1. Food and Beverage
- 5.1.2. Cosmetics
- 5.1.3. Dietary Supplements
- 5.2. Market Analysis, Insights and Forecast - by Region
- 5.2.1. North America
- 5.2.2. Europe
- 5.2.3. Asia Pacific
- 5.2.4. Rest of the World
- 5.1. Market Analysis, Insights and Forecast - by Application
- 6. North America Tea Polyphenols Market Analysis, Insights and Forecast, 2019-2031
- 6.1. Market Analysis, Insights and Forecast - by Application
- 6.1.1. Food and Beverage
- 6.1.2. Cosmetics
- 6.1.3. Dietary Supplements
- 6.1. Market Analysis, Insights and Forecast - by Application
- 7. Europe Tea Polyphenols Market Analysis, Insights and Forecast, 2019-2031
- 7.1. Market Analysis, Insights and Forecast - by Application
- 7.1.1. Food and Beverage
- 7.1.2. Cosmetics
- 7.1.3. Dietary Supplements
- 7.1. Market Analysis, Insights and Forecast - by Application
- 8. Asia Pacific Tea Polyphenols Market Analysis, Insights and Forecast, 2019-2031
- 8.1. Market Analysis, Insights and Forecast - by Application
- 8.1.1. Food and Beverage
- 8.1.2. Cosmetics
- 8.1.3. Dietary Supplements
- 8.1. Market Analysis, Insights and Forecast - by Application
- 9. Rest of the World Tea Polyphenols Market Analysis, Insights and Forecast, 2019-2031
- 9.1. Market Analysis, Insights and Forecast - by Application
- 9.1.1. Food and Beverage
- 9.1.2. Cosmetics
- 9.1.3. Dietary Supplements
- 9.1. Market Analysis, Insights and Forecast - by Application
- 10. North America Tea Polyphenols Market Analysis, Insights and Forecast, 2019-2031
- 10.1. Market Analysis, Insights and Forecast - By Country/Sub-region
- 10.1.1 United States
- 10.1.2 Canada
- 10.1.3 Mexico
- 11. Europe Tea Polyphenols Market Analysis, Insights and Forecast, 2019-2031
- 11.1. Market Analysis, Insights and Forecast - By Country/Sub-region
- 11.1.1 Germany
- 11.1.2 United Kingdom
- 11.1.3 France
- 11.1.4 Spain
- 11.1.5 Italy
- 11.1.6 Spain
- 11.1.7 Belgium
- 11.1.8 Netherland
- 11.1.9 Nordics
- 11.1.10 Rest of Europe
- 12. Asia Pacific Tea Polyphenols Market Analysis, Insights and Forecast, 2019-2031
- 12.1. Market Analysis, Insights and Forecast - By Country/Sub-region
- 12.1.1 China
- 12.1.2 Japan
- 12.1.3 India
- 12.1.4 South Korea
- 12.1.5 Southeast Asia
- 12.1.6 Australia
- 12.1.7 Indonesia
- 12.1.8 Phillipes
- 12.1.9 Singapore
- 12.1.10 Thailandc
- 12.1.11 Rest of Asia Pacific
- 13. South America Tea Polyphenols Market Analysis, Insights and Forecast, 2019-2031
- 13.1. Market Analysis, Insights and Forecast - By Country/Sub-region
- 13.1.1 Brazil
- 13.1.2 Argentina
- 13.1.3 Peru
- 13.1.4 Chile
- 13.1.5 Colombia
- 13.1.6 Ecuador
- 13.1.7 Venezuela
- 13.1.8 Rest of South America
- 14. North America Tea Polyphenols Market Analysis, Insights and Forecast, 2019-2031
- 14.1. Market Analysis, Insights and Forecast - By Country/Sub-region
- 14.1.1 United States
- 14.1.2 Canada
- 14.1.3 Mexico
- 15. MEA Tea Polyphenols Market Analysis, Insights and Forecast, 2019-2031
- 15.1. Market Analysis, Insights and Forecast - By Country/Sub-region
- 15.1.1 United Arab Emirates
- 15.1.2 Saudi Arabia
- 15.1.3 South Africa
- 15.1.4 Rest of Middle East and Africa
- 16. Competitive Analysis
- 16.1. Global Market Share Analysis 2024
- 16.2. Company Profiles
- 16.2.1 A Holliday & Company Inc
- 16.2.1.1. Overview
- 16.2.1.2. Products
- 16.2.1.3. SWOT Analysis
- 16.2.1.4. Recent Developments
- 16.2.1.5. Financials (Based on Availability)
- 16.2.2 Martin Bauer Group
- 16.2.2.1. Overview
- 16.2.2.2. Products
- 16.2.2.3. SWOT Analysis
- 16.2.2.4. Recent Developments
- 16.2.2.5. Financials (Based on Availability)
- 16.2.3 Taiyo International
- 16.2.3.1. Overview
- 16.2.3.2. Products
- 16.2.3.3. SWOT Analysis
- 16.2.3.4. Recent Developments
- 16.2.3.5. Financials (Based on Availability)
- 16.2.4 Amax NutraSource Inc
- 16.2.4.1. Overview
- 16.2.4.2. Products
- 16.2.4.3. SWOT Analysis
- 16.2.4.4. Recent Developments
- 16.2.4.5. Financials (Based on Availability)
- 16.2.5 DuPont
- 16.2.5.1. Overview
- 16.2.5.2. Products
- 16.2.5.3. SWOT Analysis
- 16.2.5.4. Recent Developments
- 16.2.5.5. Financials (Based on Availability)
- 16.2.6 IFF (Frutarom Health)
- 16.2.6.1. Overview
- 16.2.6.2. Products
- 16.2.6.3. SWOT Analysis
- 16.2.6.4. Recent Developments
- 16.2.6.5. Financials (Based on Availability)
- 16.2.7 SV Agrofood
- 16.2.7.1. Overview
- 16.2.7.2. Products
- 16.2.7.3. SWOT Analysis
- 16.2.7.4. Recent Developments
- 16.2.7.5. Financials (Based on Availability)
- 16.2.8 Sabinsa*List Not Exhaustive
- 16.2.8.1. Overview
- 16.2.8.2. Products
- 16.2.8.3. SWOT Analysis
- 16.2.8.4. Recent Developments
- 16.2.8.5. Financials (Based on Availability)
- 16.2.1 A Holliday & Company Inc
List of Figures
- Figure 1: Global Tea Polyphenols Market Revenue Breakdown (Million, %) by Region 2024 & 2032
- Figure 2: North America Tea Polyphenols Market Revenue (Million), by Country 2024 & 2032
- Figure 3: North America Tea Polyphenols Market Revenue Share (%), by Country 2024 & 2032
- Figure 4: Europe Tea Polyphenols Market Revenue (Million), by Country 2024 & 2032
- Figure 5: Europe Tea Polyphenols Market Revenue Share (%), by Country 2024 & 2032
- Figure 6: Asia Pacific Tea Polyphenols Market Revenue (Million), by Country 2024 & 2032
- Figure 7: Asia Pacific Tea Polyphenols Market Revenue Share (%), by Country 2024 & 2032
- Figure 8: South America Tea Polyphenols Market Revenue (Million), by Country 2024 & 2032
- Figure 9: South America Tea Polyphenols Market Revenue Share (%), by Country 2024 & 2032
- Figure 10: North America Tea Polyphenols Market Revenue (Million), by Country 2024 & 2032
- Figure 11: North America Tea Polyphenols Market Revenue Share (%), by Country 2024 & 2032
- Figure 12: MEA Tea Polyphenols Market Revenue (Million), by Country 2024 & 2032
- Figure 13: MEA Tea Polyphenols Market Revenue Share (%), by Country 2024 & 2032
- Figure 14: North America Tea Polyphenols Market Revenue (Million), by Application 2024 & 2032
- Figure 15: North America Tea Polyphenols Market Revenue Share (%), by Application 2024 & 2032
- Figure 16: North America Tea Polyphenols Market Revenue (Million), by Country 2024 & 2032
- Figure 17: North America Tea Polyphenols Market Revenue Share (%), by Country 2024 & 2032
- Figure 18: Europe Tea Polyphenols Market Revenue (Million), by Application 2024 & 2032
- Figure 19: Europe Tea Polyphenols Market Revenue Share (%), by Application 2024 & 2032
- Figure 20: Europe Tea Polyphenols Market Revenue (Million), by Country 2024 & 2032
- Figure 21: Europe Tea Polyphenols Market Revenue Share (%), by Country 2024 & 2032
- Figure 22: Asia Pacific Tea Polyphenols Market Revenue (Million), by Application 2024 & 2032
- Figure 23: Asia Pacific Tea Polyphenols Market Revenue Share (%), by Application 2024 & 2032
- Figure 24: Asia Pacific Tea Polyphenols Market Revenue (Million), by Country 2024 & 2032
- Figure 25: Asia Pacific Tea Polyphenols Market Revenue Share (%), by Country 2024 & 2032
- Figure 26: Rest of the World Tea Polyphenols Market Revenue (Million), by Application 2024 & 2032
- Figure 27: Rest of the World Tea Polyphenols Market Revenue Share (%), by Application 2024 & 2032
- Figure 28: Rest of the World Tea Polyphenols Market Revenue (Million), by Country 2024 & 2032
- Figure 29: Rest of the World Tea Polyphenols Market Revenue Share (%), by Country 2024 & 2032
List of Tables
- Table 1: Global Tea Polyphenols Market Revenue Million Forecast, by Region 2019 & 2032
- Table 2: Global Tea Polyphenols Market Revenue Million Forecast, by Application 2019 & 2032
- Table 3: Global Tea Polyphenols Market Revenue Million Forecast, by Region 2019 & 2032
- Table 4: Global Tea Polyphenols Market Revenue Million Forecast, by Country 2019 & 2032
- Table 5: United States Tea Polyphenols Market Revenue (Million) Forecast, by Application 2019 & 2032
- Table 6: Canada Tea Polyphenols Market Revenue (Million) Forecast, by Application 2019 & 2032
- Table 7: Mexico Tea Polyphenols Market Revenue (Million) Forecast, by Application 2019 & 2032
- Table 8: Global Tea Polyphenols Market Revenue Million Forecast, by Country 2019 & 2032
- Table 9: Germany Tea Polyphenols Market Revenue (Million) Forecast, by Application 2019 & 2032
- Table 10: United Kingdom Tea Polyphenols Market Revenue (Million) Forecast, by Application 2019 & 2032
- Table 11: France Tea Polyphenols Market Revenue (Million) Forecast, by Application 2019 & 2032
- Table 12: Spain Tea Polyphenols Market Revenue (Million) Forecast, by Application 2019 & 2032
- Table 13: Italy Tea Polyphenols Market Revenue (Million) Forecast, by Application 2019 & 2032
- Table 14: Spain Tea Polyphenols Market Revenue (Million) Forecast, by Application 2019 & 2032
- Table 15: Belgium Tea Polyphenols Market Revenue (Million) Forecast, by Application 2019 & 2032
- Table 16: Netherland Tea Polyphenols Market Revenue (Million) Forecast, by Application 2019 & 2032
- Table 17: Nordics Tea Polyphenols Market Revenue (Million) Forecast, by Application 2019 & 2032
- Table 18: Rest of Europe Tea Polyphenols Market Revenue (Million) Forecast, by Application 2019 & 2032
- Table 19: Global Tea Polyphenols Market Revenue Million Forecast, by Country 2019 & 2032
- Table 20: China Tea Polyphenols Market Revenue (Million) Forecast, by Application 2019 & 2032
- Table 21: Japan Tea Polyphenols Market Revenue (Million) Forecast, by Application 2019 & 2032
- Table 22: India Tea Polyphenols Market Revenue (Million) Forecast, by Application 2019 & 2032
- Table 23: South Korea Tea Polyphenols Market Revenue (Million) Forecast, by Application 2019 & 2032
- Table 24: Southeast Asia Tea Polyphenols Market Revenue (Million) Forecast, by Application 2019 & 2032
- Table 25: Australia Tea Polyphenols Market Revenue (Million) Forecast, by Application 2019 & 2032
- Table 26: Indonesia Tea Polyphenols Market Revenue (Million) Forecast, by Application 2019 & 2032
- Table 27: Phillipes Tea Polyphenols Market Revenue (Million) Forecast, by Application 2019 & 2032
- Table 28: Singapore Tea Polyphenols Market Revenue (Million) Forecast, by Application 2019 & 2032
- Table 29: Thailandc Tea Polyphenols Market Revenue (Million) Forecast, by Application 2019 & 2032
- Table 30: Rest of Asia Pacific Tea Polyphenols Market Revenue (Million) Forecast, by Application 2019 & 2032
- Table 31: Global Tea Polyphenols Market Revenue Million Forecast, by Country 2019 & 2032
- Table 32: Brazil Tea Polyphenols Market Revenue (Million) Forecast, by Application 2019 & 2032
- Table 33: Argentina Tea Polyphenols Market Revenue (Million) Forecast, by Application 2019 & 2032
- Table 34: Peru Tea Polyphenols Market Revenue (Million) Forecast, by Application 2019 & 2032
- Table 35: Chile Tea Polyphenols Market Revenue (Million) Forecast, by Application 2019 & 2032
- Table 36: Colombia Tea Polyphenols Market Revenue (Million) Forecast, by Application 2019 & 2032
- Table 37: Ecuador Tea Polyphenols Market Revenue (Million) Forecast, by Application 2019 & 2032
- Table 38: Venezuela Tea Polyphenols Market Revenue (Million) Forecast, by Application 2019 & 2032
- Table 39: Rest of South America Tea Polyphenols Market Revenue (Million) Forecast, by Application 2019 & 2032
- Table 40: Global Tea Polyphenols Market Revenue Million Forecast, by Country 2019 & 2032
- Table 41: United States Tea Polyphenols Market Revenue (Million) Forecast, by Application 2019 & 2032
- Table 42: Canada Tea Polyphenols Market Revenue (Million) Forecast, by Application 2019 & 2032
- Table 43: Mexico Tea Polyphenols Market Revenue (Million) Forecast, by Application 2019 & 2032
- Table 44: Global Tea Polyphenols Market Revenue Million Forecast, by Country 2019 & 2032
- Table 45: United Arab Emirates Tea Polyphenols Market Revenue (Million) Forecast, by Application 2019 & 2032
- Table 46: Saudi Arabia Tea Polyphenols Market Revenue (Million) Forecast, by Application 2019 & 2032
- Table 47: South Africa Tea Polyphenols Market Revenue (Million) Forecast, by Application 2019 & 2032
- Table 48: Rest of Middle East and Africa Tea Polyphenols Market Revenue (Million) Forecast, by Application 2019 & 2032
- Table 49: Global Tea Polyphenols Market Revenue Million Forecast, by Application 2019 & 2032
- Table 50: Global Tea Polyphenols Market Revenue Million Forecast, by Country 2019 & 2032
- Table 51: United States Tea Polyphenols Market Revenue (Million) Forecast, by Application 2019 & 2032
- Table 52: Canada Tea Polyphenols Market Revenue (Million) Forecast, by Application 2019 & 2032
- Table 53: Mexico Tea Polyphenols Market Revenue (Million) Forecast, by Application 2019 & 2032
- Table 54: Rest of North America Tea Polyphenols Market Revenue (Million) Forecast, by Application 2019 & 2032
- Table 55: Global Tea Polyphenols Market Revenue Million Forecast, by Application 2019 & 2032
- Table 56: Global Tea Polyphenols Market Revenue Million Forecast, by Country 2019 & 2032
- Table 57: Spain Tea Polyphenols Market Revenue (Million) Forecast, by Application 2019 & 2032
- Table 58: United Kingdom Tea Polyphenols Market Revenue (Million) Forecast, by Application 2019 & 2032
- Table 59: Germany Tea Polyphenols Market Revenue (Million) Forecast, by Application 2019 & 2032
- Table 60: France Tea Polyphenols Market Revenue (Million) Forecast, by Application 2019 & 2032
- Table 61: Italy Tea Polyphenols Market Revenue (Million) Forecast, by Application 2019 & 2032
- Table 62: Russia Tea Polyphenols Market Revenue (Million) Forecast, by Application 2019 & 2032
- Table 63: Rest of Europe Tea Polyphenols Market Revenue (Million) Forecast, by Application 2019 & 2032
- Table 64: Global Tea Polyphenols Market Revenue Million Forecast, by Application 2019 & 2032
- Table 65: Global Tea Polyphenols Market Revenue Million Forecast, by Country 2019 & 2032
- Table 66: China Tea Polyphenols Market Revenue (Million) Forecast, by Application 2019 & 2032
- Table 67: Japan Tea Polyphenols Market Revenue (Million) Forecast, by Application 2019 & 2032
- Table 68: India Tea Polyphenols Market Revenue (Million) Forecast, by Application 2019 & 2032
- Table 69: Australia Tea Polyphenols Market Revenue (Million) Forecast, by Application 2019 & 2032
- Table 70: Rest of Asia Pacific Tea Polyphenols Market Revenue (Million) Forecast, by Application 2019 & 2032
- Table 71: Global Tea Polyphenols Market Revenue Million Forecast, by Application 2019 & 2032
- Table 72: Global Tea Polyphenols Market Revenue Million Forecast, by Country 2019 & 2032
Frequently Asked Questions
1. What is the projected Compound Annual Growth Rate (CAGR) of the Tea Polyphenols Market?
The projected CAGR is approximately 8.50%.
2. Which companies are prominent players in the Tea Polyphenols Market?
Key companies in the market include A Holliday & Company Inc, Martin Bauer Group, Taiyo International, Amax NutraSource Inc, DuPont, IFF (Frutarom Health), SV Agrofood, Sabinsa*List Not Exhaustive.
3. What are the main segments of the Tea Polyphenols Market?
The market segments include Application.
4. Can you provide details about the market size?
The market size is estimated to be USD XX Million as of 2022.
5. What are some drivers contributing to market growth?
Rising Demand for Clean Label Food & Beverage Products; Rising Demand for Dairy Products.
6. What are the notable trends driving market growth?
Increasing Usage of Plant-based Polyphenols in Nutraceuticals.
7. Are there any restraints impacting market growth?
Presence of Preservatives in Ready Meals may Hamper the Market Growth.
8. Can you provide examples of recent developments in the market?
N/A
9. What pricing options are available for accessing the report?
Pricing options include single-user, multi-user, and enterprise licenses priced at USD 4750, USD 5250, and USD 8750 respectively.
10. Is the market size provided in terms of value or volume?
The market size is provided in terms of value, measured in Million.
11. Are there any specific market keywords associated with the report?
Yes, the market keyword associated with the report is "Tea Polyphenols Market," which aids in identifying and referencing the specific market segment covered.
12. How do I determine which pricing option suits my needs best?
The pricing options vary based on user requirements and access needs. Individual users may opt for single-user licenses, while businesses requiring broader access may choose multi-user or enterprise licenses for cost-effective access to the report.
13. Are there any additional resources or data provided in the Tea Polyphenols Market report?
While the report offers comprehensive insights, it's advisable to review the specific contents or supplementary materials provided to ascertain if additional resources or data are available.
14. How can I stay updated on further developments or reports in the Tea Polyphenols Market?
To stay informed about further developments, trends, and reports in the Tea Polyphenols Market, consider subscribing to industry newsletters, following relevant companies and organizations, or regularly checking reputable industry news sources and publications.
Methodology
Step 1 - Identification of Relevant Samples Size from Population Database


Step 2 - Approaches for Defining Global Market Size (Value, Volume* & Price*)

Note*: In applicable scenarios
Step 3 - Data Sources
Primary Research
- Web Analytics
- Survey Reports
- Research Institute
- Latest Research Reports
- Opinion Leaders
Secondary Research
- Annual Reports
- White Paper
- Latest Press Release
- Industry Association
- Paid Database
- Investor Presentations

Step 4 - Data Triangulation
Involves using different sources of information in order to increase the validity of a study
These sources are likely to be stakeholders in a program - participants, other researchers, program staff, other community members, and so on.
Then we put all data in single framework & apply various statistical tools to find out the dynamic on the market.
During the analysis stage, feedback from the stakeholder groups would be compared to determine areas of agreement as well as areas of divergence


