
Key Insights
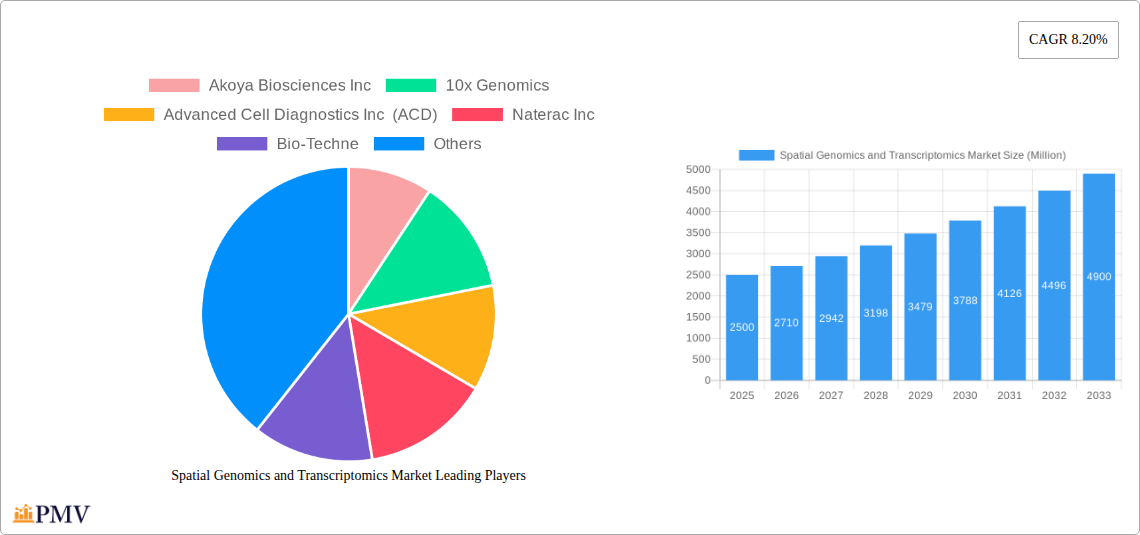
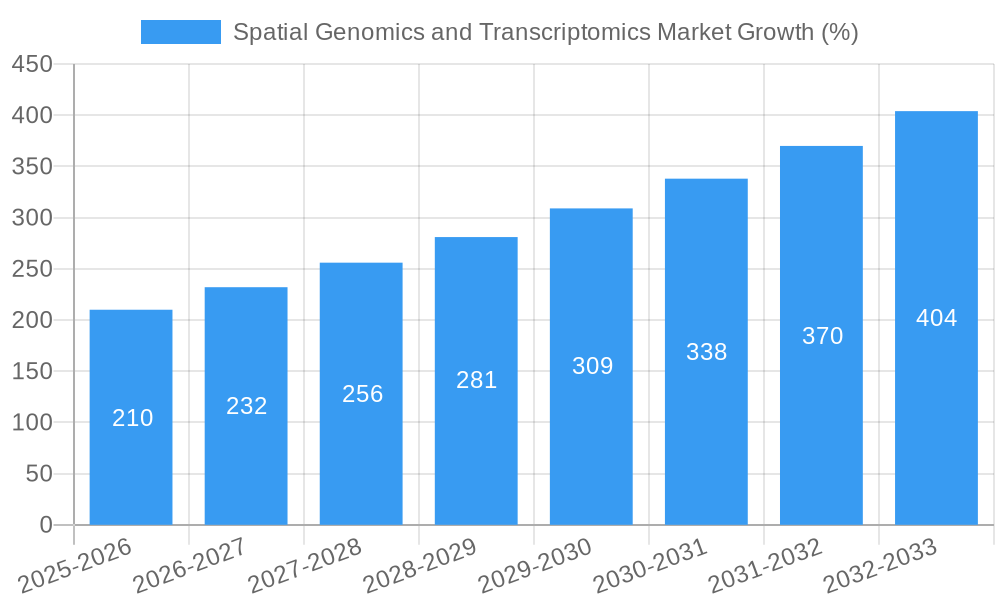
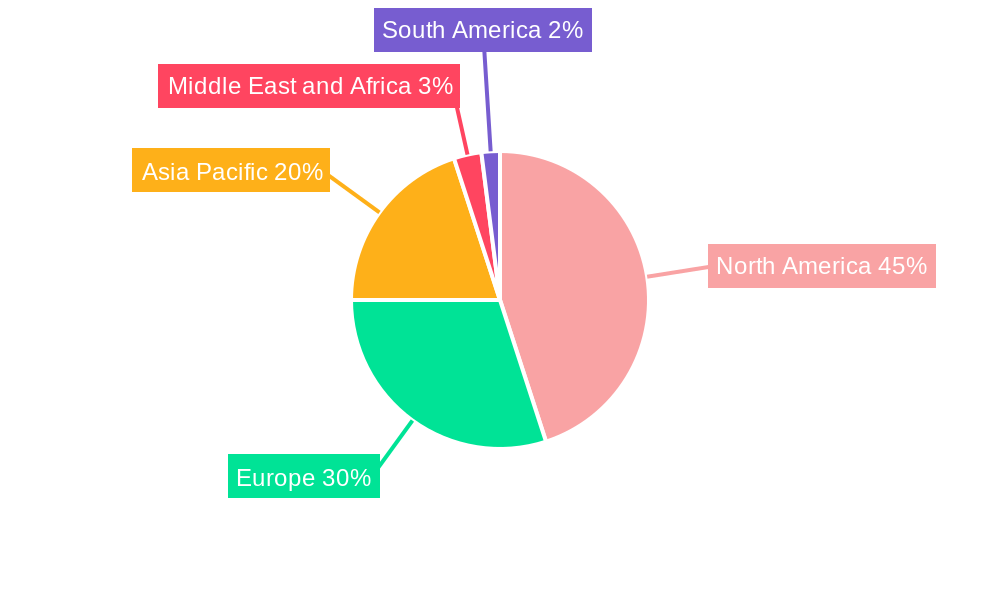
The spatial genomics and transcriptomics market is experiencing robust growth, driven by the increasing need for high-resolution analysis of gene expression and cellular organization within tissues. This technology allows researchers to understand complex biological processes with unprecedented detail, offering significant advancements in drug discovery, diagnostics, and personalized medicine. The market's expansion is fueled by technological advancements leading to improved sensitivity, throughput, and data analysis capabilities. Furthermore, increasing research funding for genomics and translational research is bolstering market growth. The key segments driving this growth include instruments, software, and consumables, with pharmaceutical manufacturers and diagnostic customers being the primary end-users. North America currently holds the largest market share, benefiting from strong research infrastructure and early adoption of innovative technologies. However, Asia Pacific is projected to experience the fastest growth rate due to rising investments in healthcare infrastructure and growing awareness of advanced diagnostic techniques. Competition is fierce, with key players such as 10x Genomics, Illumina, and Akoya Biosciences continually innovating and expanding their product portfolios. The market is also witnessing the emergence of smaller, specialized companies offering unique solutions and focusing on niche applications.
Challenges include the high cost of instruments and consumables, the complexity of data analysis, and the need for specialized expertise to operate these advanced technologies. However, ongoing research and development efforts are addressing these limitations, leading to the development of more user-friendly platforms and cost-effective solutions. The long-term outlook for the spatial genomics and transcriptomics market remains positive, with continued growth fueled by technological advancements and increasing demand from various sectors. The market is expected to witness substantial expansion as more researchers and clinicians recognize the transformative potential of this technology in understanding and treating diseases. The integration of artificial intelligence and machine learning in data analysis is also expected to further accelerate market growth in the coming years.
Spatial Genomics and Transcriptomics Market: A Comprehensive Report (2019-2033)
This comprehensive report provides a detailed analysis of the Spatial Genomics and Transcriptomics market, offering actionable insights for stakeholders across the industry. The study period covers 2019-2033, with 2025 serving as the base and estimated year. The forecast period extends from 2025 to 2033, while the historical period encompasses 2019-2024. The market is segmented by technology (Spatial Transcriptomics, Spatial Genomics), product (Instruments, Software, Consumables), and end-user (Pharmaceutical Manufacturer, Diagnostic Customers, Others). Key players analyzed include Akoya Biosciences Inc, 10x Genomics, Advanced Cell Diagnostics Inc (ACD), Naterac Inc, Bio-Techne, Illumina Inc, Fluidigm, S2 Genomics Inc, Seven Bridges Genomics, Dovetail Genomics, NanoString Technologies Inc, and Horizon Discovery Group plc. The report projects a market value exceeding xx Million by 2033.
Spatial Genomics and Transcriptomics Market Market Structure & Competitive Dynamics
The Spatial Genomics and Transcriptomics market is characterized by a moderately concentrated structure, with a few major players holding significant market share. The competitive landscape is dynamic, driven by continuous innovation in technologies and applications. The market's innovation ecosystem is robust, with collaborations between academic institutions, research organizations, and industry players fostering advancements. Regulatory frameworks, while evolving, generally support the development and adoption of these technologies. Product substitutes are limited, primarily focusing on traditional histological and microscopic techniques. However, the superior resolution and data depth offered by spatial genomics and transcriptomics are driving market growth. End-user trends indicate a growing preference for comprehensive, high-throughput platforms that integrate seamlessly into existing workflows. M&A activities have been relatively frequent, with deal values ranging from xx Million to xx Million, reflecting the strategic importance of this market segment. For instance, the acquisition of [Company A] by [Company B] in [Year] significantly altered the market landscape. Further analysis of market share reveals that [Company Name] holds approximately x% market share, while [Company Name] holds approximately y%.
- Market Concentration: Moderately concentrated.
- Innovation Ecosystem: Robust, with strong collaborations.
- Regulatory Framework: Evolving but generally supportive.
- Product Substitutes: Limited; traditional methods are being displaced.
- M&A Activity: Frequent, with deal values ranging from xx Million to xx Million.
- Market Share: [Company Name] - x%, [Company Name] - y%, Others - z%.
Spatial Genomics and Transcriptomics Market Industry Trends & Insights
The Spatial Genomics and Transcriptomics market is experiencing rapid growth, driven by several key factors. The increasing prevalence of chronic diseases, coupled with the need for precision medicine approaches, is fueling demand for advanced diagnostic and therapeutic tools. Technological advancements, such as the development of higher-resolution imaging techniques and improved data analysis algorithms, are further accelerating market expansion. Consumer preferences are shifting towards minimally invasive procedures and personalized treatments, which are well-aligned with the capabilities of spatial genomics and transcriptomics. The competitive dynamics are intense, with companies investing heavily in R&D to develop innovative products and expand market reach. The market is expected to exhibit a Compound Annual Growth Rate (CAGR) of xx% during the forecast period (2025-2033), with market penetration steadily increasing across various applications. The rising adoption of cloud-based data analysis platforms is streamlining workflows and improving accessibility. Moreover, the decreasing costs of sequencing technologies are further enhancing the affordability and accessibility of spatial genomics and transcriptomics platforms. This trend is expected to continue, further boosting market expansion.
Dominant Markets & Segments in Spatial Genomics and Transcriptomics Market
Leading Region: North America currently dominates the market due to high adoption rates and robust research infrastructure.
Leading Country: The United States holds the largest market share within North America, driven by substantial investments in research and development, and a strong presence of key players.
Dominant Segment (By Technology): Spatial Transcriptomics is currently the leading segment due to its wider range of applications and relative maturity.
Dominant Segment (By Product): Instruments are the largest segment due to high initial investment in advanced equipment.
Dominant Segment (By End-User): Pharmaceutical manufacturers are the key end users, focusing on drug discovery and development, leveraging the technology for targeted therapies and personalized medicine.
Key Drivers for Dominant Segments:
- North America: High R&D spending, advanced healthcare infrastructure, strong regulatory support.
- United States: Significant government funding for biomedical research, concentration of biotech and pharmaceutical companies.
- Spatial Transcriptomics: Wider applicability, mature technology.
- Instruments: High initial investment; a necessary tool for the technology.
- Pharmaceutical Manufacturers: Need for precision medicine and targeted therapies.
Spatial Genomics and Transcriptomics Market Product Innovations
Recent product innovations are focused on enhancing the throughput, resolution, and data analysis capabilities of spatial genomics and transcriptomics platforms. New instruments are being developed with improved sensitivity and multiplexing capabilities. Sophisticated software solutions offer advanced data visualization and analysis features, making it easier to extract meaningful insights from complex datasets. The integration of artificial intelligence and machine learning algorithms is further enhancing data analysis capabilities, improving the accuracy and efficiency of research processes. This trend is driving the overall market penetration and strengthening competitive advantages through technological differentiation and enhanced workflow efficiency.
Report Segmentation & Scope
By Technology: The market is segmented into Spatial Transcriptomics and Spatial Genomics. Spatial Transcriptomics is projected to witness a CAGR of xx% during the forecast period, while Spatial Genomics is expected to grow at a CAGR of xx%. The competitive dynamics within each segment are influenced by the technological advancements and the specific applications served.
By Product: This includes Instruments, Software, and Consumables. The Instruments segment is expected to dominate due to its high value, with a CAGR of xx%. Software will grow at a faster CAGR of xx% due to increasing demand for improved analysis capabilities. Consumables are expected to grow at a CAGR of xx%.
By End-User: This comprises Pharmaceutical Manufacturers, Diagnostic Customers, and Others. Pharmaceutical Manufacturers are projected to be the largest end-user segment, showcasing a CAGR of xx% driven by the need for personalized medicine. Diagnostic Customers are expected to grow at xx%, and the "Others" segment, which includes research institutions and academic labs, will grow at xx%.
Key Drivers of Spatial Genomics and Transcriptomics Market Growth
The Spatial Genomics and Transcriptomics market is experiencing significant growth driven by several key factors:
- Technological Advancements: Improved resolution and sensitivity of imaging techniques, advancements in sequencing technologies, and development of sophisticated data analysis tools are key drivers.
- Increased Funding for Research: Significant investments from both public and private sectors are fueling innovation and market expansion.
- Growing Demand for Personalized Medicine: The increasing need for precision medicine approaches is driving the adoption of these technologies for drug development and diagnostics.
- Rising Prevalence of Chronic Diseases: The growing burden of chronic diseases is creating a greater demand for advanced diagnostic and therapeutic tools.
Challenges in the Spatial Genomics and Transcriptomics Market Sector
Several challenges hinder the growth of this market:
- High Costs: The high cost of instruments and consumables can limit accessibility, particularly in resource-constrained settings. This leads to a xx Million shortfall in market potential annually.
- Data Analysis Complexity: Analyzing complex spatial data requires specialized expertise and advanced computational resources, potentially increasing the barrier to entry for smaller companies and institutions.
- Regulatory Hurdles: Obtaining regulatory approvals for new diagnostic and therapeutic applications can be time-consuming and complex, leading to delays in market entry and limiting market access.
Leading Players in the Spatial Genomics and Transcriptomics Market Market
- Akoya Biosciences Inc
- 10x Genomics
- Advanced Cell Diagnostics Inc (ACD)
- Naterac Inc
- Bio-Techne
- Illumina Inc
- Fluidigm
- S2 Genomics Inc
- Seven Bridges Genomics
- Dovetail Genomics
- NanoString Technologies Inc
- Horizon Discovery Group plc
Key Developments in Spatial Genomics and Transcriptomics Market Sector
May 2022: NanoString announced a seamless, cloud-based workflow improving spatial data analysis for customers using Illumina NextSeq 1000 and NextSeq 2000 sequencing systems and the GeoMx Digital Spatial Profiler. This significantly enhanced the usability and accessibility of spatial biology research.
January 2022: Illumina Inc. and Nashville Biosciences LLC partnered to utilize Illumina's NGS platforms to create a clinical genomic resource and accelerate new medicine development. This strategic collaboration expands access to Illumina's technologies and boosts the potential for breakthroughs in personalized medicine.
Strategic Spatial Genomics and Transcriptomics Market Market Outlook
The future of the Spatial Genomics and Transcriptomics market is bright, with significant growth potential driven by ongoing technological advancements, increased research funding, and the rising demand for personalized medicine. Strategic opportunities exist in developing more affordable and accessible platforms, improving data analysis tools, and expanding applications into new therapeutic areas. The integration of artificial intelligence and machine learning will play a crucial role in unlocking the full potential of spatial data analysis. Further collaborations between industry players and academic institutions will be critical to accelerate innovation and drive market expansion. The market is poised to transform biomedical research and healthcare delivery, fostering a new era of precision medicine and personalized therapies.
Spatial Genomics and Transcriptomics Market Segmentation
-
1. Technology
- 1.1. Spatial Transcriptomics
- 1.2. Spatial Genomics
-
2. Product
- 2.1. Instruments
- 2.2. Software
- 2.3. Consumables
-
3. End-User
- 3.1. Pharmaceutical Manufacturer
- 3.2. Diagnostic Customers
- 3.3. Others
Spatial Genomics and Transcriptomics Market Segmentation By Geography
-
1. North America
- 1.1. United States
- 1.2. Canada
- 1.3. Mexico
-
2. Europe
- 2.1. Germany
- 2.2. United Kingdom
- 2.3. France
- 2.4. Italy
- 2.5. Spain
- 2.6. Rest of Europe
-
3. Asia Pacific
- 3.1. China
- 3.2. Japan
- 3.3. India
- 3.4. Australia
- 3.5. South Korea
- 3.6. Rest of Asia Pacific
-
4. Middle East and Africa
- 4.1. GCC
- 4.2. South Africa
- 4.3. Rest of Middle East and Africa
-
5. South America
- 5.1. Brazil
- 5.2. Argentina
- 5.3. Rest of South America
Spatial Genomics and Transcriptomics Market REPORT HIGHLIGHTS
| Aspects | Details |
|---|---|
| Study Period | 2019-2033 |
| Base Year | 2024 |
| Estimated Year | 2025 |
| Forecast Period | 2025-2033 |
| Historical Period | 2019-2024 |
| Growth Rate | CAGR of 8.20% from 2019-2033 |
| Segmentation |
|
Table of Contents
- 1. Introduction
- 1.1. Research Scope
- 1.2. Market Segmentation
- 1.3. Research Methodology
- 1.4. Definitions and Assumptions
- 2. Executive Summary
- 2.1. Introduction
- 3. Market Dynamics
- 3.1. Introduction
- 3.2. Market Drivers
- 3.2.1. Emerging Potential of Spatial Genomic Analysis as Cancer Diagnostic Tool; Increasing Advanced Technologies of Spatial Genomics and Transcriptomics; Advent of Fourth Generation of Sequencing
- 3.3. Market Restrains
- 3.3.1. Slow Implementation of Technology; Well-Established Workflows for Conventional Genomics and Transcriptomics Analysis
- 3.4. Market Trends
- 3.4.1. Consumables Segment is Expected to Witness Healthy Growth During the Forecast Period
- 4. Market Factor Analysis
- 4.1. Porters Five Forces
- 4.2. Supply/Value Chain
- 4.3. PESTEL analysis
- 4.4. Market Entropy
- 4.5. Patent/Trademark Analysis
- 5. Global Spatial Genomics and Transcriptomics Market Analysis, Insights and Forecast, 2019-2031
- 5.1. Market Analysis, Insights and Forecast - by Technology
- 5.1.1. Spatial Transcriptomics
- 5.1.2. Spatial Genomics
- 5.2. Market Analysis, Insights and Forecast - by Product
- 5.2.1. Instruments
- 5.2.2. Software
- 5.2.3. Consumables
- 5.3. Market Analysis, Insights and Forecast - by End-User
- 5.3.1. Pharmaceutical Manufacturer
- 5.3.2. Diagnostic Customers
- 5.3.3. Others
- 5.4. Market Analysis, Insights and Forecast - by Region
- 5.4.1. North America
- 5.4.2. Europe
- 5.4.3. Asia Pacific
- 5.4.4. Middle East and Africa
- 5.4.5. South America
- 5.1. Market Analysis, Insights and Forecast - by Technology
- 6. North America Spatial Genomics and Transcriptomics Market Analysis, Insights and Forecast, 2019-2031
- 6.1. Market Analysis, Insights and Forecast - by Technology
- 6.1.1. Spatial Transcriptomics
- 6.1.2. Spatial Genomics
- 6.2. Market Analysis, Insights and Forecast - by Product
- 6.2.1. Instruments
- 6.2.2. Software
- 6.2.3. Consumables
- 6.3. Market Analysis, Insights and Forecast - by End-User
- 6.3.1. Pharmaceutical Manufacturer
- 6.3.2. Diagnostic Customers
- 6.3.3. Others
- 6.1. Market Analysis, Insights and Forecast - by Technology
- 7. Europe Spatial Genomics and Transcriptomics Market Analysis, Insights and Forecast, 2019-2031
- 7.1. Market Analysis, Insights and Forecast - by Technology
- 7.1.1. Spatial Transcriptomics
- 7.1.2. Spatial Genomics
- 7.2. Market Analysis, Insights and Forecast - by Product
- 7.2.1. Instruments
- 7.2.2. Software
- 7.2.3. Consumables
- 7.3. Market Analysis, Insights and Forecast - by End-User
- 7.3.1. Pharmaceutical Manufacturer
- 7.3.2. Diagnostic Customers
- 7.3.3. Others
- 7.1. Market Analysis, Insights and Forecast - by Technology
- 8. Asia Pacific Spatial Genomics and Transcriptomics Market Analysis, Insights and Forecast, 2019-2031
- 8.1. Market Analysis, Insights and Forecast - by Technology
- 8.1.1. Spatial Transcriptomics
- 8.1.2. Spatial Genomics
- 8.2. Market Analysis, Insights and Forecast - by Product
- 8.2.1. Instruments
- 8.2.2. Software
- 8.2.3. Consumables
- 8.3. Market Analysis, Insights and Forecast - by End-User
- 8.3.1. Pharmaceutical Manufacturer
- 8.3.2. Diagnostic Customers
- 8.3.3. Others
- 8.1. Market Analysis, Insights and Forecast - by Technology
- 9. Middle East and Africa Spatial Genomics and Transcriptomics Market Analysis, Insights and Forecast, 2019-2031
- 9.1. Market Analysis, Insights and Forecast - by Technology
- 9.1.1. Spatial Transcriptomics
- 9.1.2. Spatial Genomics
- 9.2. Market Analysis, Insights and Forecast - by Product
- 9.2.1. Instruments
- 9.2.2. Software
- 9.2.3. Consumables
- 9.3. Market Analysis, Insights and Forecast - by End-User
- 9.3.1. Pharmaceutical Manufacturer
- 9.3.2. Diagnostic Customers
- 9.3.3. Others
- 9.1. Market Analysis, Insights and Forecast - by Technology
- 10. South America Spatial Genomics and Transcriptomics Market Analysis, Insights and Forecast, 2019-2031
- 10.1. Market Analysis, Insights and Forecast - by Technology
- 10.1.1. Spatial Transcriptomics
- 10.1.2. Spatial Genomics
- 10.2. Market Analysis, Insights and Forecast - by Product
- 10.2.1. Instruments
- 10.2.2. Software
- 10.2.3. Consumables
- 10.3. Market Analysis, Insights and Forecast - by End-User
- 10.3.1. Pharmaceutical Manufacturer
- 10.3.2. Diagnostic Customers
- 10.3.3. Others
- 10.1. Market Analysis, Insights and Forecast - by Technology
- 11. North America Spatial Genomics and Transcriptomics Market Analysis, Insights and Forecast, 2019-2031
- 11.1. Market Analysis, Insights and Forecast - By Country/Sub-region
- 11.1.1 United States
- 11.1.2 Canada
- 11.1.3 Mexico
- 12. Europe Spatial Genomics and Transcriptomics Market Analysis, Insights and Forecast, 2019-2031
- 12.1. Market Analysis, Insights and Forecast - By Country/Sub-region
- 12.1.1 Germany
- 12.1.2 United Kingdom
- 12.1.3 France
- 12.1.4 Italy
- 12.1.5 Spain
- 12.1.6 Rest of Europe
- 13. Asia Pacific Spatial Genomics and Transcriptomics Market Analysis, Insights and Forecast, 2019-2031
- 13.1. Market Analysis, Insights and Forecast - By Country/Sub-region
- 13.1.1 China
- 13.1.2 Japan
- 13.1.3 India
- 13.1.4 Australia
- 13.1.5 South Korea
- 13.1.6 Rest of Asia Pacific
- 14. Middle East and Africa Spatial Genomics and Transcriptomics Market Analysis, Insights and Forecast, 2019-2031
- 14.1. Market Analysis, Insights and Forecast - By Country/Sub-region
- 14.1.1 GCC
- 14.1.2 South Africa
- 14.1.3 Rest of Middle East and Africa
- 15. South America Spatial Genomics and Transcriptomics Market Analysis, Insights and Forecast, 2019-2031
- 15.1. Market Analysis, Insights and Forecast - By Country/Sub-region
- 15.1.1 Brazil
- 15.1.2 Argentina
- 15.1.3 Rest of South America
- 16. Competitive Analysis
- 16.1. Global Market Share Analysis 2024
- 16.2. Company Profiles
- 16.2.1 Akoya Biosciences Inc
- 16.2.1.1. Overview
- 16.2.1.2. Products
- 16.2.1.3. SWOT Analysis
- 16.2.1.4. Recent Developments
- 16.2.1.5. Financials (Based on Availability)
- 16.2.2 10x Genomics
- 16.2.2.1. Overview
- 16.2.2.2. Products
- 16.2.2.3. SWOT Analysis
- 16.2.2.4. Recent Developments
- 16.2.2.5. Financials (Based on Availability)
- 16.2.3 Advanced Cell Diagnostics Inc (ACD)
- 16.2.3.1. Overview
- 16.2.3.2. Products
- 16.2.3.3. SWOT Analysis
- 16.2.3.4. Recent Developments
- 16.2.3.5. Financials (Based on Availability)
- 16.2.4 Naterac Inc
- 16.2.4.1. Overview
- 16.2.4.2. Products
- 16.2.4.3. SWOT Analysis
- 16.2.4.4. Recent Developments
- 16.2.4.5. Financials (Based on Availability)
- 16.2.5 Bio-Techne
- 16.2.5.1. Overview
- 16.2.5.2. Products
- 16.2.5.3. SWOT Analysis
- 16.2.5.4. Recent Developments
- 16.2.5.5. Financials (Based on Availability)
- 16.2.6 Illumina Inc
- 16.2.6.1. Overview
- 16.2.6.2. Products
- 16.2.6.3. SWOT Analysis
- 16.2.6.4. Recent Developments
- 16.2.6.5. Financials (Based on Availability)
- 16.2.7 Fluidigm
- 16.2.7.1. Overview
- 16.2.7.2. Products
- 16.2.7.3. SWOT Analysis
- 16.2.7.4. Recent Developments
- 16.2.7.5. Financials (Based on Availability)
- 16.2.8 S2 Genomics Inc
- 16.2.8.1. Overview
- 16.2.8.2. Products
- 16.2.8.3. SWOT Analysis
- 16.2.8.4. Recent Developments
- 16.2.8.5. Financials (Based on Availability)
- 16.2.9 Seven Bridges Genomics*List Not Exhaustive
- 16.2.9.1. Overview
- 16.2.9.2. Products
- 16.2.9.3. SWOT Analysis
- 16.2.9.4. Recent Developments
- 16.2.9.5. Financials (Based on Availability)
- 16.2.10 Dovetail Genomics
- 16.2.10.1. Overview
- 16.2.10.2. Products
- 16.2.10.3. SWOT Analysis
- 16.2.10.4. Recent Developments
- 16.2.10.5. Financials (Based on Availability)
- 16.2.11 NanoString Technologies Inc
- 16.2.11.1. Overview
- 16.2.11.2. Products
- 16.2.11.3. SWOT Analysis
- 16.2.11.4. Recent Developments
- 16.2.11.5. Financials (Based on Availability)
- 16.2.12 Horizon Discovery Group plc
- 16.2.12.1. Overview
- 16.2.12.2. Products
- 16.2.12.3. SWOT Analysis
- 16.2.12.4. Recent Developments
- 16.2.12.5. Financials (Based on Availability)
- 16.2.1 Akoya Biosciences Inc
List of Figures
- Figure 1: Global Spatial Genomics and Transcriptomics Market Revenue Breakdown (Million, %) by Region 2024 & 2032
- Figure 2: North America Spatial Genomics and Transcriptomics Market Revenue (Million), by Country 2024 & 2032
- Figure 3: North America Spatial Genomics and Transcriptomics Market Revenue Share (%), by Country 2024 & 2032
- Figure 4: Europe Spatial Genomics and Transcriptomics Market Revenue (Million), by Country 2024 & 2032
- Figure 5: Europe Spatial Genomics and Transcriptomics Market Revenue Share (%), by Country 2024 & 2032
- Figure 6: Asia Pacific Spatial Genomics and Transcriptomics Market Revenue (Million), by Country 2024 & 2032
- Figure 7: Asia Pacific Spatial Genomics and Transcriptomics Market Revenue Share (%), by Country 2024 & 2032
- Figure 8: Middle East and Africa Spatial Genomics and Transcriptomics Market Revenue (Million), by Country 2024 & 2032
- Figure 9: Middle East and Africa Spatial Genomics and Transcriptomics Market Revenue Share (%), by Country 2024 & 2032
- Figure 10: South America Spatial Genomics and Transcriptomics Market Revenue (Million), by Country 2024 & 2032
- Figure 11: South America Spatial Genomics and Transcriptomics Market Revenue Share (%), by Country 2024 & 2032
- Figure 12: North America Spatial Genomics and Transcriptomics Market Revenue (Million), by Technology 2024 & 2032
- Figure 13: North America Spatial Genomics and Transcriptomics Market Revenue Share (%), by Technology 2024 & 2032
- Figure 14: North America Spatial Genomics and Transcriptomics Market Revenue (Million), by Product 2024 & 2032
- Figure 15: North America Spatial Genomics and Transcriptomics Market Revenue Share (%), by Product 2024 & 2032
- Figure 16: North America Spatial Genomics and Transcriptomics Market Revenue (Million), by End-User 2024 & 2032
- Figure 17: North America Spatial Genomics and Transcriptomics Market Revenue Share (%), by End-User 2024 & 2032
- Figure 18: North America Spatial Genomics and Transcriptomics Market Revenue (Million), by Country 2024 & 2032
- Figure 19: North America Spatial Genomics and Transcriptomics Market Revenue Share (%), by Country 2024 & 2032
- Figure 20: Europe Spatial Genomics and Transcriptomics Market Revenue (Million), by Technology 2024 & 2032
- Figure 21: Europe Spatial Genomics and Transcriptomics Market Revenue Share (%), by Technology 2024 & 2032
- Figure 22: Europe Spatial Genomics and Transcriptomics Market Revenue (Million), by Product 2024 & 2032
- Figure 23: Europe Spatial Genomics and Transcriptomics Market Revenue Share (%), by Product 2024 & 2032
- Figure 24: Europe Spatial Genomics and Transcriptomics Market Revenue (Million), by End-User 2024 & 2032
- Figure 25: Europe Spatial Genomics and Transcriptomics Market Revenue Share (%), by End-User 2024 & 2032
- Figure 26: Europe Spatial Genomics and Transcriptomics Market Revenue (Million), by Country 2024 & 2032
- Figure 27: Europe Spatial Genomics and Transcriptomics Market Revenue Share (%), by Country 2024 & 2032
- Figure 28: Asia Pacific Spatial Genomics and Transcriptomics Market Revenue (Million), by Technology 2024 & 2032
- Figure 29: Asia Pacific Spatial Genomics and Transcriptomics Market Revenue Share (%), by Technology 2024 & 2032
- Figure 30: Asia Pacific Spatial Genomics and Transcriptomics Market Revenue (Million), by Product 2024 & 2032
- Figure 31: Asia Pacific Spatial Genomics and Transcriptomics Market Revenue Share (%), by Product 2024 & 2032
- Figure 32: Asia Pacific Spatial Genomics and Transcriptomics Market Revenue (Million), by End-User 2024 & 2032
- Figure 33: Asia Pacific Spatial Genomics and Transcriptomics Market Revenue Share (%), by End-User 2024 & 2032
- Figure 34: Asia Pacific Spatial Genomics and Transcriptomics Market Revenue (Million), by Country 2024 & 2032
- Figure 35: Asia Pacific Spatial Genomics and Transcriptomics Market Revenue Share (%), by Country 2024 & 2032
- Figure 36: Middle East and Africa Spatial Genomics and Transcriptomics Market Revenue (Million), by Technology 2024 & 2032
- Figure 37: Middle East and Africa Spatial Genomics and Transcriptomics Market Revenue Share (%), by Technology 2024 & 2032
- Figure 38: Middle East and Africa Spatial Genomics and Transcriptomics Market Revenue (Million), by Product 2024 & 2032
- Figure 39: Middle East and Africa Spatial Genomics and Transcriptomics Market Revenue Share (%), by Product 2024 & 2032
- Figure 40: Middle East and Africa Spatial Genomics and Transcriptomics Market Revenue (Million), by End-User 2024 & 2032
- Figure 41: Middle East and Africa Spatial Genomics and Transcriptomics Market Revenue Share (%), by End-User 2024 & 2032
- Figure 42: Middle East and Africa Spatial Genomics and Transcriptomics Market Revenue (Million), by Country 2024 & 2032
- Figure 43: Middle East and Africa Spatial Genomics and Transcriptomics Market Revenue Share (%), by Country 2024 & 2032
- Figure 44: South America Spatial Genomics and Transcriptomics Market Revenue (Million), by Technology 2024 & 2032
- Figure 45: South America Spatial Genomics and Transcriptomics Market Revenue Share (%), by Technology 2024 & 2032
- Figure 46: South America Spatial Genomics and Transcriptomics Market Revenue (Million), by Product 2024 & 2032
- Figure 47: South America Spatial Genomics and Transcriptomics Market Revenue Share (%), by Product 2024 & 2032
- Figure 48: South America Spatial Genomics and Transcriptomics Market Revenue (Million), by End-User 2024 & 2032
- Figure 49: South America Spatial Genomics and Transcriptomics Market Revenue Share (%), by End-User 2024 & 2032
- Figure 50: South America Spatial Genomics and Transcriptomics Market Revenue (Million), by Country 2024 & 2032
- Figure 51: South America Spatial Genomics and Transcriptomics Market Revenue Share (%), by Country 2024 & 2032
List of Tables
- Table 1: Global Spatial Genomics and Transcriptomics Market Revenue Million Forecast, by Region 2019 & 2032
- Table 2: Global Spatial Genomics and Transcriptomics Market Revenue Million Forecast, by Technology 2019 & 2032
- Table 3: Global Spatial Genomics and Transcriptomics Market Revenue Million Forecast, by Product 2019 & 2032
- Table 4: Global Spatial Genomics and Transcriptomics Market Revenue Million Forecast, by End-User 2019 & 2032
- Table 5: Global Spatial Genomics and Transcriptomics Market Revenue Million Forecast, by Region 2019 & 2032
- Table 6: Global Spatial Genomics and Transcriptomics Market Revenue Million Forecast, by Country 2019 & 2032
- Table 7: United States Spatial Genomics and Transcriptomics Market Revenue (Million) Forecast, by Application 2019 & 2032
- Table 8: Canada Spatial Genomics and Transcriptomics Market Revenue (Million) Forecast, by Application 2019 & 2032
- Table 9: Mexico Spatial Genomics and Transcriptomics Market Revenue (Million) Forecast, by Application 2019 & 2032
- Table 10: Global Spatial Genomics and Transcriptomics Market Revenue Million Forecast, by Country 2019 & 2032
- Table 11: Germany Spatial Genomics and Transcriptomics Market Revenue (Million) Forecast, by Application 2019 & 2032
- Table 12: United Kingdom Spatial Genomics and Transcriptomics Market Revenue (Million) Forecast, by Application 2019 & 2032
- Table 13: France Spatial Genomics and Transcriptomics Market Revenue (Million) Forecast, by Application 2019 & 2032
- Table 14: Italy Spatial Genomics and Transcriptomics Market Revenue (Million) Forecast, by Application 2019 & 2032
- Table 15: Spain Spatial Genomics and Transcriptomics Market Revenue (Million) Forecast, by Application 2019 & 2032
- Table 16: Rest of Europe Spatial Genomics and Transcriptomics Market Revenue (Million) Forecast, by Application 2019 & 2032
- Table 17: Global Spatial Genomics and Transcriptomics Market Revenue Million Forecast, by Country 2019 & 2032
- Table 18: China Spatial Genomics and Transcriptomics Market Revenue (Million) Forecast, by Application 2019 & 2032
- Table 19: Japan Spatial Genomics and Transcriptomics Market Revenue (Million) Forecast, by Application 2019 & 2032
- Table 20: India Spatial Genomics and Transcriptomics Market Revenue (Million) Forecast, by Application 2019 & 2032
- Table 21: Australia Spatial Genomics and Transcriptomics Market Revenue (Million) Forecast, by Application 2019 & 2032
- Table 22: South Korea Spatial Genomics and Transcriptomics Market Revenue (Million) Forecast, by Application 2019 & 2032
- Table 23: Rest of Asia Pacific Spatial Genomics and Transcriptomics Market Revenue (Million) Forecast, by Application 2019 & 2032
- Table 24: Global Spatial Genomics and Transcriptomics Market Revenue Million Forecast, by Country 2019 & 2032
- Table 25: GCC Spatial Genomics and Transcriptomics Market Revenue (Million) Forecast, by Application 2019 & 2032
- Table 26: South Africa Spatial Genomics and Transcriptomics Market Revenue (Million) Forecast, by Application 2019 & 2032
- Table 27: Rest of Middle East and Africa Spatial Genomics and Transcriptomics Market Revenue (Million) Forecast, by Application 2019 & 2032
- Table 28: Global Spatial Genomics and Transcriptomics Market Revenue Million Forecast, by Country 2019 & 2032
- Table 29: Brazil Spatial Genomics and Transcriptomics Market Revenue (Million) Forecast, by Application 2019 & 2032
- Table 30: Argentina Spatial Genomics and Transcriptomics Market Revenue (Million) Forecast, by Application 2019 & 2032
- Table 31: Rest of South America Spatial Genomics and Transcriptomics Market Revenue (Million) Forecast, by Application 2019 & 2032
- Table 32: Global Spatial Genomics and Transcriptomics Market Revenue Million Forecast, by Technology 2019 & 2032
- Table 33: Global Spatial Genomics and Transcriptomics Market Revenue Million Forecast, by Product 2019 & 2032
- Table 34: Global Spatial Genomics and Transcriptomics Market Revenue Million Forecast, by End-User 2019 & 2032
- Table 35: Global Spatial Genomics and Transcriptomics Market Revenue Million Forecast, by Country 2019 & 2032
- Table 36: United States Spatial Genomics and Transcriptomics Market Revenue (Million) Forecast, by Application 2019 & 2032
- Table 37: Canada Spatial Genomics and Transcriptomics Market Revenue (Million) Forecast, by Application 2019 & 2032
- Table 38: Mexico Spatial Genomics and Transcriptomics Market Revenue (Million) Forecast, by Application 2019 & 2032
- Table 39: Global Spatial Genomics and Transcriptomics Market Revenue Million Forecast, by Technology 2019 & 2032
- Table 40: Global Spatial Genomics and Transcriptomics Market Revenue Million Forecast, by Product 2019 & 2032
- Table 41: Global Spatial Genomics and Transcriptomics Market Revenue Million Forecast, by End-User 2019 & 2032
- Table 42: Global Spatial Genomics and Transcriptomics Market Revenue Million Forecast, by Country 2019 & 2032
- Table 43: Germany Spatial Genomics and Transcriptomics Market Revenue (Million) Forecast, by Application 2019 & 2032
- Table 44: United Kingdom Spatial Genomics and Transcriptomics Market Revenue (Million) Forecast, by Application 2019 & 2032
- Table 45: France Spatial Genomics and Transcriptomics Market Revenue (Million) Forecast, by Application 2019 & 2032
- Table 46: Italy Spatial Genomics and Transcriptomics Market Revenue (Million) Forecast, by Application 2019 & 2032
- Table 47: Spain Spatial Genomics and Transcriptomics Market Revenue (Million) Forecast, by Application 2019 & 2032
- Table 48: Rest of Europe Spatial Genomics and Transcriptomics Market Revenue (Million) Forecast, by Application 2019 & 2032
- Table 49: Global Spatial Genomics and Transcriptomics Market Revenue Million Forecast, by Technology 2019 & 2032
- Table 50: Global Spatial Genomics and Transcriptomics Market Revenue Million Forecast, by Product 2019 & 2032
- Table 51: Global Spatial Genomics and Transcriptomics Market Revenue Million Forecast, by End-User 2019 & 2032
- Table 52: Global Spatial Genomics and Transcriptomics Market Revenue Million Forecast, by Country 2019 & 2032
- Table 53: China Spatial Genomics and Transcriptomics Market Revenue (Million) Forecast, by Application 2019 & 2032
- Table 54: Japan Spatial Genomics and Transcriptomics Market Revenue (Million) Forecast, by Application 2019 & 2032
- Table 55: India Spatial Genomics and Transcriptomics Market Revenue (Million) Forecast, by Application 2019 & 2032
- Table 56: Australia Spatial Genomics and Transcriptomics Market Revenue (Million) Forecast, by Application 2019 & 2032
- Table 57: South Korea Spatial Genomics and Transcriptomics Market Revenue (Million) Forecast, by Application 2019 & 2032
- Table 58: Rest of Asia Pacific Spatial Genomics and Transcriptomics Market Revenue (Million) Forecast, by Application 2019 & 2032
- Table 59: Global Spatial Genomics and Transcriptomics Market Revenue Million Forecast, by Technology 2019 & 2032
- Table 60: Global Spatial Genomics and Transcriptomics Market Revenue Million Forecast, by Product 2019 & 2032
- Table 61: Global Spatial Genomics and Transcriptomics Market Revenue Million Forecast, by End-User 2019 & 2032
- Table 62: Global Spatial Genomics and Transcriptomics Market Revenue Million Forecast, by Country 2019 & 2032
- Table 63: GCC Spatial Genomics and Transcriptomics Market Revenue (Million) Forecast, by Application 2019 & 2032
- Table 64: South Africa Spatial Genomics and Transcriptomics Market Revenue (Million) Forecast, by Application 2019 & 2032
- Table 65: Rest of Middle East and Africa Spatial Genomics and Transcriptomics Market Revenue (Million) Forecast, by Application 2019 & 2032
- Table 66: Global Spatial Genomics and Transcriptomics Market Revenue Million Forecast, by Technology 2019 & 2032
- Table 67: Global Spatial Genomics and Transcriptomics Market Revenue Million Forecast, by Product 2019 & 2032
- Table 68: Global Spatial Genomics and Transcriptomics Market Revenue Million Forecast, by End-User 2019 & 2032
- Table 69: Global Spatial Genomics and Transcriptomics Market Revenue Million Forecast, by Country 2019 & 2032
- Table 70: Brazil Spatial Genomics and Transcriptomics Market Revenue (Million) Forecast, by Application 2019 & 2032
- Table 71: Argentina Spatial Genomics and Transcriptomics Market Revenue (Million) Forecast, by Application 2019 & 2032
- Table 72: Rest of South America Spatial Genomics and Transcriptomics Market Revenue (Million) Forecast, by Application 2019 & 2032
Frequently Asked Questions
1. What is the projected Compound Annual Growth Rate (CAGR) of the Spatial Genomics and Transcriptomics Market?
The projected CAGR is approximately 8.20%.
2. Which companies are prominent players in the Spatial Genomics and Transcriptomics Market?
Key companies in the market include Akoya Biosciences Inc, 10x Genomics, Advanced Cell Diagnostics Inc (ACD), Naterac Inc, Bio-Techne, Illumina Inc, Fluidigm, S2 Genomics Inc, Seven Bridges Genomics*List Not Exhaustive, Dovetail Genomics, NanoString Technologies Inc, Horizon Discovery Group plc.
3. What are the main segments of the Spatial Genomics and Transcriptomics Market?
The market segments include Technology, Product, End-User.
4. Can you provide details about the market size?
The market size is estimated to be USD XX Million as of 2022.
5. What are some drivers contributing to market growth?
Emerging Potential of Spatial Genomic Analysis as Cancer Diagnostic Tool; Increasing Advanced Technologies of Spatial Genomics and Transcriptomics; Advent of Fourth Generation of Sequencing.
6. What are the notable trends driving market growth?
Consumables Segment is Expected to Witness Healthy Growth During the Forecast Period.
7. Are there any restraints impacting market growth?
Slow Implementation of Technology; Well-Established Workflows for Conventional Genomics and Transcriptomics Analysis.
8. Can you provide examples of recent developments in the market?
May 2022: NanoString announced a seamless, cloud-based workflow that improves the spatial data analysis experience of customers using Illumina NextSeq 1000 and NextSeq 2000 sequencing systems and the GeoMx Digital Spatial Profiler to facilitate spatial biology research using next-generation sequencing.
9. What pricing options are available for accessing the report?
Pricing options include single-user, multi-user, and enterprise licenses priced at USD 4750, USD 5250, and USD 8750 respectively.
10. Is the market size provided in terms of value or volume?
The market size is provided in terms of value, measured in Million.
11. Are there any specific market keywords associated with the report?
Yes, the market keyword associated with the report is "Spatial Genomics and Transcriptomics Market," which aids in identifying and referencing the specific market segment covered.
12. How do I determine which pricing option suits my needs best?
The pricing options vary based on user requirements and access needs. Individual users may opt for single-user licenses, while businesses requiring broader access may choose multi-user or enterprise licenses for cost-effective access to the report.
13. Are there any additional resources or data provided in the Spatial Genomics and Transcriptomics Market report?
While the report offers comprehensive insights, it's advisable to review the specific contents or supplementary materials provided to ascertain if additional resources or data are available.
14. How can I stay updated on further developments or reports in the Spatial Genomics and Transcriptomics Market?
To stay informed about further developments, trends, and reports in the Spatial Genomics and Transcriptomics Market, consider subscribing to industry newsletters, following relevant companies and organizations, or regularly checking reputable industry news sources and publications.
Methodology
Step 1 - Identification of Relevant Samples Size from Population Database


Step 2 - Approaches for Defining Global Market Size (Value, Volume* & Price*)

Note*: In applicable scenarios
Step 3 - Data Sources
Primary Research
- Web Analytics
- Survey Reports
- Research Institute
- Latest Research Reports
- Opinion Leaders
Secondary Research
- Annual Reports
- White Paper
- Latest Press Release
- Industry Association
- Paid Database
- Investor Presentations

Step 4 - Data Triangulation
Involves using different sources of information in order to increase the validity of a study
These sources are likely to be stakeholders in a program - participants, other researchers, program staff, other community members, and so on.
Then we put all data in single framework & apply various statistical tools to find out the dynamic on the market.
During the analysis stage, feedback from the stakeholder groups would be compared to determine areas of agreement as well as areas of divergence


