
Key Insights
The Semiconductor Silicon Intellectual Property (IP) market is experiencing robust growth, driven by the increasing demand for advanced semiconductor devices across various end-user verticals. The market's Compound Annual Growth Rate (CAGR) of 7.38% from 2019 to 2024 indicates a consistent upward trajectory. Key drivers include the proliferation of mobile devices, the rise of the Internet of Things (IoT), and the increasing adoption of artificial intelligence (AI) and machine learning (ML) technologies. These applications necessitate sophisticated semiconductor designs, fueling the demand for high-performance and specialized silicon IPs. The market is segmented by revenue type (license, royalty, services), IP type (processor IP, wired and wireless interface IP, others), and end-user vertical (consumer electronics, computers and peripherals, automotive, industrial, and others). The significant presence of established players like ARM, Synopsys, and Cadence, along with emerging companies, points to a competitive yet innovative landscape. Growth is geographically diverse, with North America and Asia-Pacific expected to lead due to substantial technological advancements and manufacturing capabilities in these regions. The automotive sector is projected to experience particularly strong growth as the demand for advanced driver-assistance systems (ADAS) and autonomous driving technologies increases.
The continued miniaturization of semiconductor devices and the rising complexity of system-on-a-chip (SoC) designs are further reinforcing the demand for specialized silicon IPs. The shift toward more energy-efficient designs and the growing emphasis on security features in embedded systems contribute to market expansion. While potential restraints might include challenges related to IP protection and licensing agreements, the overall market outlook remains positive. The forecast period of 2025-2033 suggests continued expansion, with specific growth rates likely influenced by technological breakthroughs, economic conditions, and government policies. The adoption of advanced process nodes and the development of new IP technologies will be crucial in shaping the market's trajectory in the coming years. Companies are likely to focus on strategic partnerships, acquisitions, and R&D investments to maintain their competitive edge in this dynamic market.
Semiconductor Silicon Intellectual Property (IP) Industry Market Report: 2019-2033
This comprehensive report provides a detailed analysis of the Semiconductor Silicon Intellectual Property (IP) industry, offering invaluable insights for stakeholders seeking to navigate this dynamic market. The report covers the period 2019-2033, with a focus on the forecast period 2025-2033, and a base year of 2025. The study encompasses market sizing, segmentation, competitive landscape, key drivers, challenges, and future outlook, incorporating recent industry developments to deliver actionable intelligence. The market is expected to reach xx Million by 2033, exhibiting a CAGR of xx% during the forecast period.
Semiconductor Silicon Intellectual Property Industry Market Structure & Competitive Dynamics
The Semiconductor Silicon Intellectual Property (IP) market is characterized by a moderately concentrated structure, with a few dominant players alongside a number of smaller, specialized firms. Key players like Synopsys Inc., Cadence Design Systems Inc., and ARM Ltd (SoftBank) hold significant market share, estimated at xx%, xx%, and xx% respectively in 2025. However, the industry also fosters a vibrant ecosystem of innovation, driven by continuous advancements in chip design technology and increasing demand across various end-user verticals.
The regulatory landscape varies across geographies, impacting market access and intellectual property protection. Product substitution is a significant factor, with continuous development of alternative technologies shaping market competition. End-user trends towards miniaturization, power efficiency, and enhanced functionality influence IP demand. Mergers and acquisitions (M&A) are frequent, reflecting strategic efforts to expand product portfolios and market reach. Recent M&A activity shows significant deal values, with some transactions exceeding xx Million. For instance, the acquisition of VisiSonics' spatial audio business by CEVA Inc. exemplifies this trend.
- Market Concentration: Moderately concentrated, with a few dominant players.
- Innovation Ecosystem: Highly dynamic, driven by technological advancements.
- Regulatory Frameworks: Vary across regions, affecting market access.
- Product Substitutes: Continuous development of alternative technologies.
- End-User Trends: Demand for miniaturization, power efficiency, and advanced features.
- M&A Activity: Frequent, with significant deal values observed (xx Million+ in some cases).
Semiconductor Silicon Intellectual Property Industry Industry Trends & Insights
The Semiconductor Silicon Intellectual Property (IP) market is experiencing robust growth, propelled by several key factors. The increasing demand for advanced semiconductor devices in consumer electronics, automobiles, and industrial applications is a primary driver. Technological disruptions, such as the rise of artificial intelligence (AI) and the Internet of Things (IoT), are further fueling market expansion. Consumer preferences for faster, more powerful, and energy-efficient devices are shaping the demand for advanced semiconductor IP. The market's competitive dynamics are characterized by continuous innovation, strategic partnerships, and M&A activity.
The market growth is significantly influenced by the growing adoption of advanced node technologies like 5nm, 3nm, and 2nm, pushing the need for sophisticated IP solutions. The rising adoption of AI and machine learning is fostering development of specialized IP for these applications, driving market growth. Furthermore, the automotive sector's rapid adoption of advanced driver-assistance systems (ADAS) and autonomous driving technology is a major driver of semiconductor IP demand. The market penetration of semiconductor IP in various end-user verticals is expected to increase significantly in the coming years, with a projected penetration rate of xx% by 2033.
Dominant Markets & Segments in Semiconductor Silicon Intellectual Property Industry
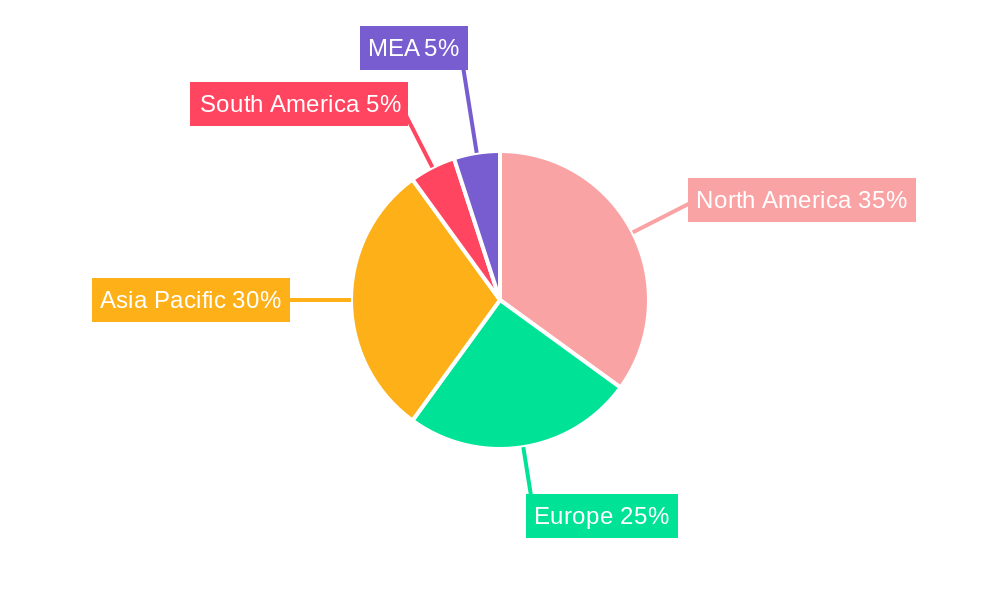
The global Semiconductor Silicon Intellectual Property market is geographically diverse, with significant presence in North America, Asia-Pacific, and Europe. However, the Asia-Pacific region, particularly China, dominates the market, driven by substantial investments in semiconductor manufacturing and a thriving electronics industry. By Revenue Type, the license segment holds the largest market share, followed by royalties and services. Processor IP dominates the IP type segment, while the consumer electronics vertical is the leading end-user segment.
By Revenue Type:
- License: Largest market share, driven by high demand for IP licenses.
- Royalty: Significant contributor, representing recurring revenue streams.
- Services: Growing segment, offering customization and support services.
By IP Type:
- Processor IP: Dominant segment, essential for various applications.
- Wired and Wireless Interface IP: Strong growth, driven by connectivity needs.
- Other IP Types: Includes memory controllers, analog IP, security IP, and other specialized solutions, growing steadily.
By End-user Vertical:
- Consumer Electronics: Leading segment due to high volume production.
- Computers and Peripherals: Significant contributor, reflecting increasing computing power needs.
- Automobile: Rapidly growing segment driven by ADAS and autonomous driving technology.
- Industrial: Steady growth driven by automation and industrial IoT.
Key Drivers for Dominant Regions/Segments:
- Asia-Pacific (China): Massive investments in semiconductor manufacturing and a large electronics industry.
- North America: Strong presence of key IP vendors and advanced technology development.
- Europe: Focus on specific niches and specialized IP solutions.
Semiconductor Silicon Intellectual Property Industry Product Innovations
Recent advancements in semiconductor silicon intellectual property include the development of AI-powered electronic design automation (EDA) tools, which significantly accelerate chip design processes. Furthermore, the integration of advanced security features into IP cores addresses the growing concerns about data protection. These innovations offer considerable competitive advantages, enabling faster time-to-market and enhanced product performance. The market trend is moving towards highly specialized IP cores tailored for specific applications and optimized for power efficiency.
Report Segmentation & Scope
This report segments the semiconductor silicon intellectual property market across multiple dimensions. By Revenue Type, it analyzes License, Royalty, and Services revenue streams, projecting xx Million, xx Million, and xx Million respectively by 2033. By IP Type, it categorizes the market into Processor IP, Wired and Wireless Interface IP, and Other IP Types, with Processor IP holding the largest share. By End-user Vertical, the report examines Consumer Electronics, Computers and Peripherals, Automobile, Industrial, and Other end-user verticals, anticipating strongest growth in the Automotive sector. Each segment's growth projection is based on detailed market size analysis and competitive dynamics.
Key Drivers of Semiconductor Silicon Intellectual Property Industry Growth
The Semiconductor Silicon Intellectual Property industry's growth is driven by several key factors. Firstly, the rising demand for high-performance computing across various sectors like consumer electronics, automobiles, and data centers fuels demand for advanced IP solutions. Secondly, the proliferation of IoT devices necessitates the development of energy-efficient and cost-effective IP cores. Finally, government initiatives promoting domestic semiconductor manufacturing in several countries are boosting the market.
Challenges in the Semiconductor Silicon Intellectual Property Industry Sector
The Semiconductor Silicon Intellectual Property market faces several challenges. Maintaining robust intellectual property protection is crucial, especially against counterfeiting. Supply chain disruptions can significantly impact the availability of essential components. Intense competition among IP providers necessitates continuous innovation and cost optimization to maintain market share. These challenges affect profitability and growth trajectory, requiring strategic adaptation for industry players. For example, geopolitical instability can lead to increased manufacturing costs and delays.
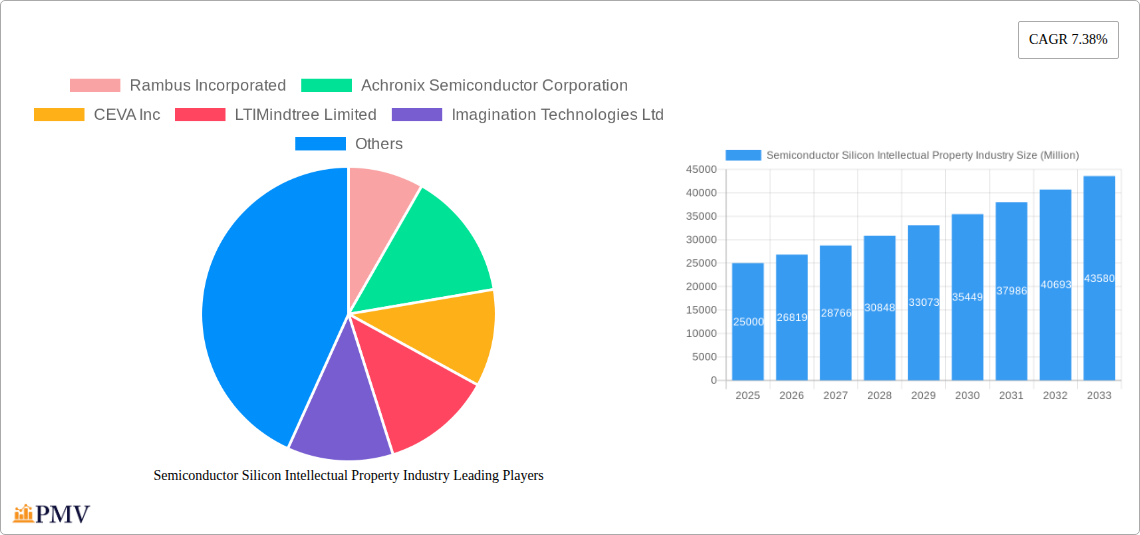
Leading Players in the Semiconductor Silicon Intellectual Property Industry Market
- Rambus Incorporated
- Achronix Semiconductor Corporation
- CEVA Inc
- LTIMindtree Limited
- Imagination Technologies Ltd
- Fujitsu Ltd
- Andes Technology Corporation
- Faraday Technology Corporation
- MIPS Tech LLC
- Digital Media Professionals
- Synopsys Inc.
- Cadence Design Systems Inc.
- eMemory Technology Inc
- MediaTek Inc
- VeriSilicon Holdings Co Ltd
- ARM Ltd (SoftBank )
Key Developments in Semiconductor Silicon Intellectual Property Industry Sector
- May 2023: CEVA Inc. acquired RealSpace 3D Spatial Audio business from VisiSonics, expanding its application software portfolio and strengthening its position in wearables.
- March 2023: Synopsys launched its Synopsys.ai suite of AI-powered EDA tools, promising significant reductions in development time and costs.
Strategic Semiconductor Silicon Intellectual Property Industry Market Outlook
The Semiconductor Silicon Intellectual Property market presents substantial growth opportunities, driven by the increasing demand for advanced semiconductor devices and the continuous development of cutting-edge technologies like AI and 5G. Strategic partnerships and acquisitions will continue to reshape the competitive landscape. Companies focusing on specialized IP solutions and efficient design methodologies are poised for significant success. The market's future growth will depend on ongoing innovation, addressing global supply chain challenges, and adapting to evolving regulatory landscapes.
Semiconductor Silicon Intellectual Property Industry Segmentation
-
1. Revenue Type
- 1.1. License
- 1.2. Royalty
- 1.3. Services
-
2. IP Type
- 2.1. Processor IP
- 2.2. Wired and Wireless Interface IP
- 2.3. Other IP Types
-
3. End-user Vertical
- 3.1. Consumer Electronics
- 3.2. Computers and Peripherals
- 3.3. Automobile
- 3.4. Industrial
- 3.5. Other End-user Verticals
Semiconductor Silicon Intellectual Property Industry Segmentation By Geography
-
1. North America
- 1.1. United States
- 1.2. Canada
-
2. Europe
- 2.1. United Kingdom
- 2.2. Germany
- 2.3. France
-
3. Asia
- 3.1. China
- 3.2. Taiwan
- 3.3. Japan
- 3.4. South Korea
- 3.5. India
- 3.6. Australia and New Zealand
- 4. Latin America
- 5. Middle East and Africa
Semiconductor Silicon Intellectual Property Industry REPORT HIGHLIGHTS
| Aspects | Details |
|---|---|
| Study Period | 2019-2033 |
| Base Year | 2024 |
| Estimated Year | 2025 |
| Forecast Period | 2025-2033 |
| Historical Period | 2019-2024 |
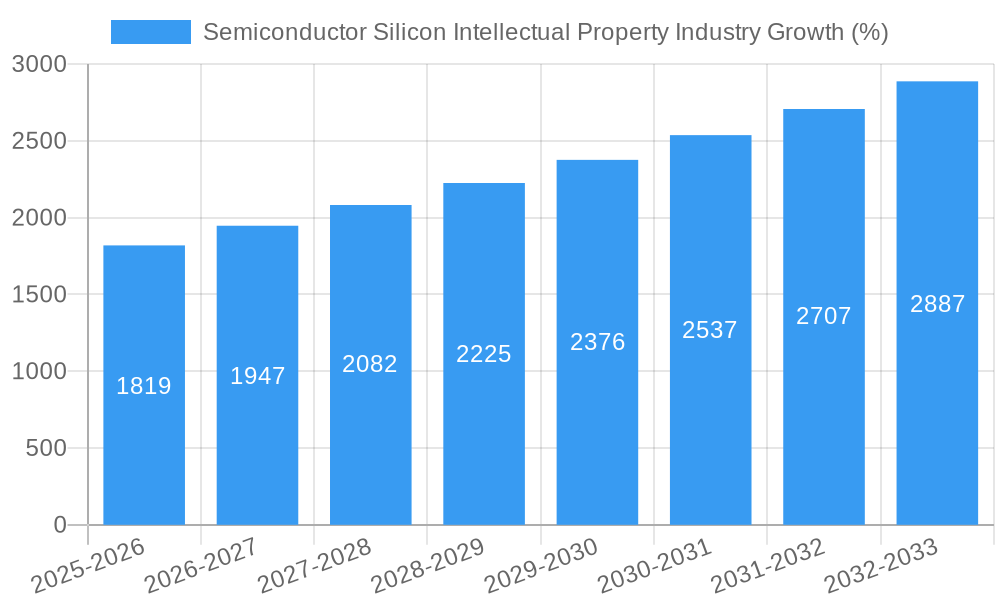
| Growth Rate | CAGR of 7.38% from 2019-2033 |
| Segmentation |
|
Table of Contents
- 1. Introduction
- 1.1. Research Scope
- 1.2. Market Segmentation
- 1.3. Research Methodology
- 1.4. Definitions and Assumptions
- 2. Executive Summary
- 2.1. Introduction
- 3. Market Dynamics
- 3.1. Introduction
- 3.2. Market Drivers
- 3.2.1. Growing Demand for Connected Devices; Growing Demand for Modern SoC Designs
- 3.3. Market Restrains
- 3.3.1. IP Business Model and Economies of Scale
- 3.4. Market Trends
- 3.4.1. Consumer Electronics to be the Largest End-user Vertical
- 4. Market Factor Analysis
- 4.1. Porters Five Forces
- 4.2. Supply/Value Chain
- 4.3. PESTEL analysis
- 4.4. Market Entropy
- 4.5. Patent/Trademark Analysis
- 5. Global Semiconductor Silicon Intellectual Property Industry Analysis, Insights and Forecast, 2019-2031
- 5.1. Market Analysis, Insights and Forecast - by Revenue Type
- 5.1.1. License
- 5.1.2. Royalty
- 5.1.3. Services
- 5.2. Market Analysis, Insights and Forecast - by IP Type
- 5.2.1. Processor IP
- 5.2.2. Wired and Wireless Interface IP
- 5.2.3. Other IP Types
- 5.3. Market Analysis, Insights and Forecast - by End-user Vertical
- 5.3.1. Consumer Electronics
- 5.3.2. Computers and Peripherals
- 5.3.3. Automobile
- 5.3.4. Industrial
- 5.3.5. Other End-user Verticals
- 5.4. Market Analysis, Insights and Forecast - by Region
- 5.4.1. North America
- 5.4.2. Europe
- 5.4.3. Asia
- 5.4.4. Latin America
- 5.4.5. Middle East and Africa
- 5.1. Market Analysis, Insights and Forecast - by Revenue Type
- 6. North America Semiconductor Silicon Intellectual Property Industry Analysis, Insights and Forecast, 2019-2031
- 6.1. Market Analysis, Insights and Forecast - by Revenue Type
- 6.1.1. License
- 6.1.2. Royalty
- 6.1.3. Services
- 6.2. Market Analysis, Insights and Forecast - by IP Type
- 6.2.1. Processor IP
- 6.2.2. Wired and Wireless Interface IP
- 6.2.3. Other IP Types
- 6.3. Market Analysis, Insights and Forecast - by End-user Vertical
- 6.3.1. Consumer Electronics
- 6.3.2. Computers and Peripherals
- 6.3.3. Automobile
- 6.3.4. Industrial
- 6.3.5. Other End-user Verticals
- 6.1. Market Analysis, Insights and Forecast - by Revenue Type
- 7. Europe Semiconductor Silicon Intellectual Property Industry Analysis, Insights and Forecast, 2019-2031
- 7.1. Market Analysis, Insights and Forecast - by Revenue Type
- 7.1.1. License
- 7.1.2. Royalty
- 7.1.3. Services
- 7.2. Market Analysis, Insights and Forecast - by IP Type
- 7.2.1. Processor IP
- 7.2.2. Wired and Wireless Interface IP
- 7.2.3. Other IP Types
- 7.3. Market Analysis, Insights and Forecast - by End-user Vertical
- 7.3.1. Consumer Electronics
- 7.3.2. Computers and Peripherals
- 7.3.3. Automobile
- 7.3.4. Industrial
- 7.3.5. Other End-user Verticals
- 7.1. Market Analysis, Insights and Forecast - by Revenue Type
- 8. Asia Semiconductor Silicon Intellectual Property Industry Analysis, Insights and Forecast, 2019-2031
- 8.1. Market Analysis, Insights and Forecast - by Revenue Type
- 8.1.1. License
- 8.1.2. Royalty
- 8.1.3. Services
- 8.2. Market Analysis, Insights and Forecast - by IP Type
- 8.2.1. Processor IP
- 8.2.2. Wired and Wireless Interface IP
- 8.2.3. Other IP Types
- 8.3. Market Analysis, Insights and Forecast - by End-user Vertical
- 8.3.1. Consumer Electronics
- 8.3.2. Computers and Peripherals
- 8.3.3. Automobile
- 8.3.4. Industrial
- 8.3.5. Other End-user Verticals
- 8.1. Market Analysis, Insights and Forecast - by Revenue Type
- 9. Latin America Semiconductor Silicon Intellectual Property Industry Analysis, Insights and Forecast, 2019-2031
- 9.1. Market Analysis, Insights and Forecast - by Revenue Type
- 9.1.1. License
- 9.1.2. Royalty
- 9.1.3. Services
- 9.2. Market Analysis, Insights and Forecast - by IP Type
- 9.2.1. Processor IP
- 9.2.2. Wired and Wireless Interface IP
- 9.2.3. Other IP Types
- 9.3. Market Analysis, Insights and Forecast - by End-user Vertical
- 9.3.1. Consumer Electronics
- 9.3.2. Computers and Peripherals
- 9.3.3. Automobile
- 9.3.4. Industrial
- 9.3.5. Other End-user Verticals
- 9.1. Market Analysis, Insights and Forecast - by Revenue Type
- 10. Middle East and Africa Semiconductor Silicon Intellectual Property Industry Analysis, Insights and Forecast, 2019-2031
- 10.1. Market Analysis, Insights and Forecast - by Revenue Type
- 10.1.1. License
- 10.1.2. Royalty
- 10.1.3. Services
- 10.2. Market Analysis, Insights and Forecast - by IP Type
- 10.2.1. Processor IP
- 10.2.2. Wired and Wireless Interface IP
- 10.2.3. Other IP Types
- 10.3. Market Analysis, Insights and Forecast - by End-user Vertical
- 10.3.1. Consumer Electronics
- 10.3.2. Computers and Peripherals
- 10.3.3. Automobile
- 10.3.4. Industrial
- 10.3.5. Other End-user Verticals
- 10.1. Market Analysis, Insights and Forecast - by Revenue Type
- 11. North America Semiconductor Silicon Intellectual Property Industry Analysis, Insights and Forecast, 2019-2031
- 11.1. Market Analysis, Insights and Forecast - By Country/Sub-region
- 11.1.1 United States
- 11.1.2 Canada
- 11.1.3 Mexico
- 12. Europe Semiconductor Silicon Intellectual Property Industry Analysis, Insights and Forecast, 2019-2031
- 12.1. Market Analysis, Insights and Forecast - By Country/Sub-region
- 12.1.1 Germany
- 12.1.2 United Kingdom
- 12.1.3 France
- 12.1.4 Spain
- 12.1.5 Italy
- 12.1.6 Spain
- 12.1.7 Belgium
- 12.1.8 Netherland
- 12.1.9 Nordics
- 12.1.10 Rest of Europe
- 13. Asia Pacific Semiconductor Silicon Intellectual Property Industry Analysis, Insights and Forecast, 2019-2031
- 13.1. Market Analysis, Insights and Forecast - By Country/Sub-region
- 13.1.1 China
- 13.1.2 Japan
- 13.1.3 India
- 13.1.4 South Korea
- 13.1.5 Southeast Asia
- 13.1.6 Australia
- 13.1.7 Indonesia
- 13.1.8 Phillipes
- 13.1.9 Singapore
- 13.1.10 Thailandc
- 13.1.11 Rest of Asia Pacific
- 14. South America Semiconductor Silicon Intellectual Property Industry Analysis, Insights and Forecast, 2019-2031
- 14.1. Market Analysis, Insights and Forecast - By Country/Sub-region
- 14.1.1 Brazil
- 14.1.2 Argentina
- 14.1.3 Peru
- 14.1.4 Chile
- 14.1.5 Colombia
- 14.1.6 Ecuador
- 14.1.7 Venezuela
- 14.1.8 Rest of South America
- 15. North America Semiconductor Silicon Intellectual Property Industry Analysis, Insights and Forecast, 2019-2031
- 15.1. Market Analysis, Insights and Forecast - By Country/Sub-region
- 15.1.1 United States
- 15.1.2 Canada
- 15.1.3 Mexico
- 16. MEA Semiconductor Silicon Intellectual Property Industry Analysis, Insights and Forecast, 2019-2031
- 16.1. Market Analysis, Insights and Forecast - By Country/Sub-region
- 16.1.1 United Arab Emirates
- 16.1.2 Saudi Arabia
- 16.1.3 South Africa
- 16.1.4 Rest of Middle East and Africa
- 17. Competitive Analysis
- 17.1. Global Market Share Analysis 2024
- 17.2. Company Profiles
- 17.2.1 Rambus Incorporated
- 17.2.1.1. Overview
- 17.2.1.2. Products
- 17.2.1.3. SWOT Analysis
- 17.2.1.4. Recent Developments
- 17.2.1.5. Financials (Based on Availability)
- 17.2.2 Achronix Semiconductor Corporation
- 17.2.2.1. Overview
- 17.2.2.2. Products
- 17.2.2.3. SWOT Analysis
- 17.2.2.4. Recent Developments
- 17.2.2.5. Financials (Based on Availability)
- 17.2.3 CEVA Inc
- 17.2.3.1. Overview
- 17.2.3.2. Products
- 17.2.3.3. SWOT Analysis
- 17.2.3.4. Recent Developments
- 17.2.3.5. Financials (Based on Availability)
- 17.2.4 LTIMindtree Limited
- 17.2.4.1. Overview
- 17.2.4.2. Products
- 17.2.4.3. SWOT Analysis
- 17.2.4.4. Recent Developments
- 17.2.4.5. Financials (Based on Availability)
- 17.2.5 Imagination Technologies Ltd
- 17.2.5.1. Overview
- 17.2.5.2. Products
- 17.2.5.3. SWOT Analysis
- 17.2.5.4. Recent Developments
- 17.2.5.5. Financials (Based on Availability)
- 17.2.6 Fujitsu Ltd
- 17.2.6.1. Overview
- 17.2.6.2. Products
- 17.2.6.3. SWOT Analysis
- 17.2.6.4. Recent Developments
- 17.2.6.5. Financials (Based on Availability)
- 17.2.7 Andes Technology Corporation
- 17.2.7.1. Overview
- 17.2.7.2. Products
- 17.2.7.3. SWOT Analysis
- 17.2.7.4. Recent Developments
- 17.2.7.5. Financials (Based on Availability)
- 17.2.8 Faraday Technology Corporation
- 17.2.8.1. Overview
- 17.2.8.2. Products
- 17.2.8.3. SWOT Analysis
- 17.2.8.4. Recent Developments
- 17.2.8.5. Financials (Based on Availability)
- 17.2.9 MIPS Tech LLC
- 17.2.9.1. Overview
- 17.2.9.2. Products
- 17.2.9.3. SWOT Analysis
- 17.2.9.4. Recent Developments
- 17.2.9.5. Financials (Based on Availability)
- 17.2.10 Digital Media Professionals
- 17.2.10.1. Overview
- 17.2.10.2. Products
- 17.2.10.3. SWOT Analysis
- 17.2.10.4. Recent Developments
- 17.2.10.5. Financials (Based on Availability)
- 17.2.11 Synopsys Inc
- 17.2.11.1. Overview
- 17.2.11.2. Products
- 17.2.11.3. SWOT Analysis
- 17.2.11.4. Recent Developments
- 17.2.11.5. Financials (Based on Availability)
- 17.2.12 Cadence Design Systems Inc
- 17.2.12.1. Overview
- 17.2.12.2. Products
- 17.2.12.3. SWOT Analysis
- 17.2.12.4. Recent Developments
- 17.2.12.5. Financials (Based on Availability)
- 17.2.13 eMemory Technology Inc
- 17.2.13.1. Overview
- 17.2.13.2. Products
- 17.2.13.3. SWOT Analysis
- 17.2.13.4. Recent Developments
- 17.2.13.5. Financials (Based on Availability)
- 17.2.14 MediaTek Inc
- 17.2.14.1. Overview
- 17.2.14.2. Products
- 17.2.14.3. SWOT Analysis
- 17.2.14.4. Recent Developments
- 17.2.14.5. Financials (Based on Availability)
- 17.2.15 VeriSilicon Holdings Co Ltd
- 17.2.15.1. Overview
- 17.2.15.2. Products
- 17.2.15.3. SWOT Analysis
- 17.2.15.4. Recent Developments
- 17.2.15.5. Financials (Based on Availability)
- 17.2.16 ARM Ltd (SoftBank )
- 17.2.16.1. Overview
- 17.2.16.2. Products
- 17.2.16.3. SWOT Analysis
- 17.2.16.4. Recent Developments
- 17.2.16.5. Financials (Based on Availability)
- 17.2.1 Rambus Incorporated
List of Figures
- Figure 1: Global Semiconductor Silicon Intellectual Property Industry Revenue Breakdown (Million, %) by Region 2024 & 2032
- Figure 2: North America Semiconductor Silicon Intellectual Property Industry Revenue (Million), by Country 2024 & 2032
- Figure 3: North America Semiconductor Silicon Intellectual Property Industry Revenue Share (%), by Country 2024 & 2032
- Figure 4: Europe Semiconductor Silicon Intellectual Property Industry Revenue (Million), by Country 2024 & 2032
- Figure 5: Europe Semiconductor Silicon Intellectual Property Industry Revenue Share (%), by Country 2024 & 2032
- Figure 6: Asia Pacific Semiconductor Silicon Intellectual Property Industry Revenue (Million), by Country 2024 & 2032
- Figure 7: Asia Pacific Semiconductor Silicon Intellectual Property Industry Revenue Share (%), by Country 2024 & 2032
- Figure 8: South America Semiconductor Silicon Intellectual Property Industry Revenue (Million), by Country 2024 & 2032
- Figure 9: South America Semiconductor Silicon Intellectual Property Industry Revenue Share (%), by Country 2024 & 2032
- Figure 10: North America Semiconductor Silicon Intellectual Property Industry Revenue (Million), by Country 2024 & 2032
- Figure 11: North America Semiconductor Silicon Intellectual Property Industry Revenue Share (%), by Country 2024 & 2032
- Figure 12: MEA Semiconductor Silicon Intellectual Property Industry Revenue (Million), by Country 2024 & 2032
- Figure 13: MEA Semiconductor Silicon Intellectual Property Industry Revenue Share (%), by Country 2024 & 2032
- Figure 14: North America Semiconductor Silicon Intellectual Property Industry Revenue (Million), by Revenue Type 2024 & 2032
- Figure 15: North America Semiconductor Silicon Intellectual Property Industry Revenue Share (%), by Revenue Type 2024 & 2032
- Figure 16: North America Semiconductor Silicon Intellectual Property Industry Revenue (Million), by IP Type 2024 & 2032
- Figure 17: North America Semiconductor Silicon Intellectual Property Industry Revenue Share (%), by IP Type 2024 & 2032
- Figure 18: North America Semiconductor Silicon Intellectual Property Industry Revenue (Million), by End-user Vertical 2024 & 2032
- Figure 19: North America Semiconductor Silicon Intellectual Property Industry Revenue Share (%), by End-user Vertical 2024 & 2032
- Figure 20: North America Semiconductor Silicon Intellectual Property Industry Revenue (Million), by Country 2024 & 2032
- Figure 21: North America Semiconductor Silicon Intellectual Property Industry Revenue Share (%), by Country 2024 & 2032
- Figure 22: Europe Semiconductor Silicon Intellectual Property Industry Revenue (Million), by Revenue Type 2024 & 2032
- Figure 23: Europe Semiconductor Silicon Intellectual Property Industry Revenue Share (%), by Revenue Type 2024 & 2032
- Figure 24: Europe Semiconductor Silicon Intellectual Property Industry Revenue (Million), by IP Type 2024 & 2032
- Figure 25: Europe Semiconductor Silicon Intellectual Property Industry Revenue Share (%), by IP Type 2024 & 2032
- Figure 26: Europe Semiconductor Silicon Intellectual Property Industry Revenue (Million), by End-user Vertical 2024 & 2032
- Figure 27: Europe Semiconductor Silicon Intellectual Property Industry Revenue Share (%), by End-user Vertical 2024 & 2032
- Figure 28: Europe Semiconductor Silicon Intellectual Property Industry Revenue (Million), by Country 2024 & 2032
- Figure 29: Europe Semiconductor Silicon Intellectual Property Industry Revenue Share (%), by Country 2024 & 2032
- Figure 30: Asia Semiconductor Silicon Intellectual Property Industry Revenue (Million), by Revenue Type 2024 & 2032
- Figure 31: Asia Semiconductor Silicon Intellectual Property Industry Revenue Share (%), by Revenue Type 2024 & 2032
- Figure 32: Asia Semiconductor Silicon Intellectual Property Industry Revenue (Million), by IP Type 2024 & 2032
- Figure 33: Asia Semiconductor Silicon Intellectual Property Industry Revenue Share (%), by IP Type 2024 & 2032
- Figure 34: Asia Semiconductor Silicon Intellectual Property Industry Revenue (Million), by End-user Vertical 2024 & 2032
- Figure 35: Asia Semiconductor Silicon Intellectual Property Industry Revenue Share (%), by End-user Vertical 2024 & 2032
- Figure 36: Asia Semiconductor Silicon Intellectual Property Industry Revenue (Million), by Country 2024 & 2032
- Figure 37: Asia Semiconductor Silicon Intellectual Property Industry Revenue Share (%), by Country 2024 & 2032
- Figure 38: Latin America Semiconductor Silicon Intellectual Property Industry Revenue (Million), by Revenue Type 2024 & 2032
- Figure 39: Latin America Semiconductor Silicon Intellectual Property Industry Revenue Share (%), by Revenue Type 2024 & 2032
- Figure 40: Latin America Semiconductor Silicon Intellectual Property Industry Revenue (Million), by IP Type 2024 & 2032
- Figure 41: Latin America Semiconductor Silicon Intellectual Property Industry Revenue Share (%), by IP Type 2024 & 2032
- Figure 42: Latin America Semiconductor Silicon Intellectual Property Industry Revenue (Million), by End-user Vertical 2024 & 2032
- Figure 43: Latin America Semiconductor Silicon Intellectual Property Industry Revenue Share (%), by End-user Vertical 2024 & 2032
- Figure 44: Latin America Semiconductor Silicon Intellectual Property Industry Revenue (Million), by Country 2024 & 2032
- Figure 45: Latin America Semiconductor Silicon Intellectual Property Industry Revenue Share (%), by Country 2024 & 2032
- Figure 46: Middle East and Africa Semiconductor Silicon Intellectual Property Industry Revenue (Million), by Revenue Type 2024 & 2032
- Figure 47: Middle East and Africa Semiconductor Silicon Intellectual Property Industry Revenue Share (%), by Revenue Type 2024 & 2032
- Figure 48: Middle East and Africa Semiconductor Silicon Intellectual Property Industry Revenue (Million), by IP Type 2024 & 2032
- Figure 49: Middle East and Africa Semiconductor Silicon Intellectual Property Industry Revenue Share (%), by IP Type 2024 & 2032
- Figure 50: Middle East and Africa Semiconductor Silicon Intellectual Property Industry Revenue (Million), by End-user Vertical 2024 & 2032
- Figure 51: Middle East and Africa Semiconductor Silicon Intellectual Property Industry Revenue Share (%), by End-user Vertical 2024 & 2032
- Figure 52: Middle East and Africa Semiconductor Silicon Intellectual Property Industry Revenue (Million), by Country 2024 & 2032
- Figure 53: Middle East and Africa Semiconductor Silicon Intellectual Property Industry Revenue Share (%), by Country 2024 & 2032
List of Tables
- Table 1: Global Semiconductor Silicon Intellectual Property Industry Revenue Million Forecast, by Region 2019 & 2032
- Table 2: Global Semiconductor Silicon Intellectual Property Industry Revenue Million Forecast, by Revenue Type 2019 & 2032
- Table 3: Global Semiconductor Silicon Intellectual Property Industry Revenue Million Forecast, by IP Type 2019 & 2032
- Table 4: Global Semiconductor Silicon Intellectual Property Industry Revenue Million Forecast, by End-user Vertical 2019 & 2032
- Table 5: Global Semiconductor Silicon Intellectual Property Industry Revenue Million Forecast, by Region 2019 & 2032
- Table 6: Global Semiconductor Silicon Intellectual Property Industry Revenue Million Forecast, by Country 2019 & 2032
- Table 7: United States Semiconductor Silicon Intellectual Property Industry Revenue (Million) Forecast, by Application 2019 & 2032
- Table 8: Canada Semiconductor Silicon Intellectual Property Industry Revenue (Million) Forecast, by Application 2019 & 2032
- Table 9: Mexico Semiconductor Silicon Intellectual Property Industry Revenue (Million) Forecast, by Application 2019 & 2032
- Table 10: Global Semiconductor Silicon Intellectual Property Industry Revenue Million Forecast, by Country 2019 & 2032
- Table 11: Germany Semiconductor Silicon Intellectual Property Industry Revenue (Million) Forecast, by Application 2019 & 2032
- Table 12: United Kingdom Semiconductor Silicon Intellectual Property Industry Revenue (Million) Forecast, by Application 2019 & 2032
- Table 13: France Semiconductor Silicon Intellectual Property Industry Revenue (Million) Forecast, by Application 2019 & 2032
- Table 14: Spain Semiconductor Silicon Intellectual Property Industry Revenue (Million) Forecast, by Application 2019 & 2032
- Table 15: Italy Semiconductor Silicon Intellectual Property Industry Revenue (Million) Forecast, by Application 2019 & 2032
- Table 16: Spain Semiconductor Silicon Intellectual Property Industry Revenue (Million) Forecast, by Application 2019 & 2032
- Table 17: Belgium Semiconductor Silicon Intellectual Property Industry Revenue (Million) Forecast, by Application 2019 & 2032
- Table 18: Netherland Semiconductor Silicon Intellectual Property Industry Revenue (Million) Forecast, by Application 2019 & 2032
- Table 19: Nordics Semiconductor Silicon Intellectual Property Industry Revenue (Million) Forecast, by Application 2019 & 2032
- Table 20: Rest of Europe Semiconductor Silicon Intellectual Property Industry Revenue (Million) Forecast, by Application 2019 & 2032
- Table 21: Global Semiconductor Silicon Intellectual Property Industry Revenue Million Forecast, by Country 2019 & 2032
- Table 22: China Semiconductor Silicon Intellectual Property Industry Revenue (Million) Forecast, by Application 2019 & 2032
- Table 23: Japan Semiconductor Silicon Intellectual Property Industry Revenue (Million) Forecast, by Application 2019 & 2032
- Table 24: India Semiconductor Silicon Intellectual Property Industry Revenue (Million) Forecast, by Application 2019 & 2032
- Table 25: South Korea Semiconductor Silicon Intellectual Property Industry Revenue (Million) Forecast, by Application 2019 & 2032
- Table 26: Southeast Asia Semiconductor Silicon Intellectual Property Industry Revenue (Million) Forecast, by Application 2019 & 2032
- Table 27: Australia Semiconductor Silicon Intellectual Property Industry Revenue (Million) Forecast, by Application 2019 & 2032
- Table 28: Indonesia Semiconductor Silicon Intellectual Property Industry Revenue (Million) Forecast, by Application 2019 & 2032
- Table 29: Phillipes Semiconductor Silicon Intellectual Property Industry Revenue (Million) Forecast, by Application 2019 & 2032
- Table 30: Singapore Semiconductor Silicon Intellectual Property Industry Revenue (Million) Forecast, by Application 2019 & 2032
- Table 31: Thailandc Semiconductor Silicon Intellectual Property Industry Revenue (Million) Forecast, by Application 2019 & 2032
- Table 32: Rest of Asia Pacific Semiconductor Silicon Intellectual Property Industry Revenue (Million) Forecast, by Application 2019 & 2032
- Table 33: Global Semiconductor Silicon Intellectual Property Industry Revenue Million Forecast, by Country 2019 & 2032
- Table 34: Brazil Semiconductor Silicon Intellectual Property Industry Revenue (Million) Forecast, by Application 2019 & 2032
- Table 35: Argentina Semiconductor Silicon Intellectual Property Industry Revenue (Million) Forecast, by Application 2019 & 2032
- Table 36: Peru Semiconductor Silicon Intellectual Property Industry Revenue (Million) Forecast, by Application 2019 & 2032
- Table 37: Chile Semiconductor Silicon Intellectual Property Industry Revenue (Million) Forecast, by Application 2019 & 2032
- Table 38: Colombia Semiconductor Silicon Intellectual Property Industry Revenue (Million) Forecast, by Application 2019 & 2032
- Table 39: Ecuador Semiconductor Silicon Intellectual Property Industry Revenue (Million) Forecast, by Application 2019 & 2032
- Table 40: Venezuela Semiconductor Silicon Intellectual Property Industry Revenue (Million) Forecast, by Application 2019 & 2032
- Table 41: Rest of South America Semiconductor Silicon Intellectual Property Industry Revenue (Million) Forecast, by Application 2019 & 2032
- Table 42: Global Semiconductor Silicon Intellectual Property Industry Revenue Million Forecast, by Country 2019 & 2032
- Table 43: United States Semiconductor Silicon Intellectual Property Industry Revenue (Million) Forecast, by Application 2019 & 2032
- Table 44: Canada Semiconductor Silicon Intellectual Property Industry Revenue (Million) Forecast, by Application 2019 & 2032
- Table 45: Mexico Semiconductor Silicon Intellectual Property Industry Revenue (Million) Forecast, by Application 2019 & 2032
- Table 46: Global Semiconductor Silicon Intellectual Property Industry Revenue Million Forecast, by Country 2019 & 2032
- Table 47: United Arab Emirates Semiconductor Silicon Intellectual Property Industry Revenue (Million) Forecast, by Application 2019 & 2032
- Table 48: Saudi Arabia Semiconductor Silicon Intellectual Property Industry Revenue (Million) Forecast, by Application 2019 & 2032
- Table 49: South Africa Semiconductor Silicon Intellectual Property Industry Revenue (Million) Forecast, by Application 2019 & 2032
- Table 50: Rest of Middle East and Africa Semiconductor Silicon Intellectual Property Industry Revenue (Million) Forecast, by Application 2019 & 2032
- Table 51: Global Semiconductor Silicon Intellectual Property Industry Revenue Million Forecast, by Revenue Type 2019 & 2032
- Table 52: Global Semiconductor Silicon Intellectual Property Industry Revenue Million Forecast, by IP Type 2019 & 2032
- Table 53: Global Semiconductor Silicon Intellectual Property Industry Revenue Million Forecast, by End-user Vertical 2019 & 2032
- Table 54: Global Semiconductor Silicon Intellectual Property Industry Revenue Million Forecast, by Country 2019 & 2032
- Table 55: United States Semiconductor Silicon Intellectual Property Industry Revenue (Million) Forecast, by Application 2019 & 2032
- Table 56: Canada Semiconductor Silicon Intellectual Property Industry Revenue (Million) Forecast, by Application 2019 & 2032
- Table 57: Global Semiconductor Silicon Intellectual Property Industry Revenue Million Forecast, by Revenue Type 2019 & 2032
- Table 58: Global Semiconductor Silicon Intellectual Property Industry Revenue Million Forecast, by IP Type 2019 & 2032
- Table 59: Global Semiconductor Silicon Intellectual Property Industry Revenue Million Forecast, by End-user Vertical 2019 & 2032
- Table 60: Global Semiconductor Silicon Intellectual Property Industry Revenue Million Forecast, by Country 2019 & 2032
- Table 61: United Kingdom Semiconductor Silicon Intellectual Property Industry Revenue (Million) Forecast, by Application 2019 & 2032
- Table 62: Germany Semiconductor Silicon Intellectual Property Industry Revenue (Million) Forecast, by Application 2019 & 2032
- Table 63: France Semiconductor Silicon Intellectual Property Industry Revenue (Million) Forecast, by Application 2019 & 2032
- Table 64: Global Semiconductor Silicon Intellectual Property Industry Revenue Million Forecast, by Revenue Type 2019 & 2032
- Table 65: Global Semiconductor Silicon Intellectual Property Industry Revenue Million Forecast, by IP Type 2019 & 2032
- Table 66: Global Semiconductor Silicon Intellectual Property Industry Revenue Million Forecast, by End-user Vertical 2019 & 2032
- Table 67: Global Semiconductor Silicon Intellectual Property Industry Revenue Million Forecast, by Country 2019 & 2032
- Table 68: China Semiconductor Silicon Intellectual Property Industry Revenue (Million) Forecast, by Application 2019 & 2032
- Table 69: Taiwan Semiconductor Silicon Intellectual Property Industry Revenue (Million) Forecast, by Application 2019 & 2032
- Table 70: Japan Semiconductor Silicon Intellectual Property Industry Revenue (Million) Forecast, by Application 2019 & 2032
- Table 71: South Korea Semiconductor Silicon Intellectual Property Industry Revenue (Million) Forecast, by Application 2019 & 2032
- Table 72: India Semiconductor Silicon Intellectual Property Industry Revenue (Million) Forecast, by Application 2019 & 2032
- Table 73: Australia and New Zealand Semiconductor Silicon Intellectual Property Industry Revenue (Million) Forecast, by Application 2019 & 2032
- Table 74: Global Semiconductor Silicon Intellectual Property Industry Revenue Million Forecast, by Revenue Type 2019 & 2032
- Table 75: Global Semiconductor Silicon Intellectual Property Industry Revenue Million Forecast, by IP Type 2019 & 2032
- Table 76: Global Semiconductor Silicon Intellectual Property Industry Revenue Million Forecast, by End-user Vertical 2019 & 2032
- Table 77: Global Semiconductor Silicon Intellectual Property Industry Revenue Million Forecast, by Country 2019 & 2032
- Table 78: Global Semiconductor Silicon Intellectual Property Industry Revenue Million Forecast, by Revenue Type 2019 & 2032
- Table 79: Global Semiconductor Silicon Intellectual Property Industry Revenue Million Forecast, by IP Type 2019 & 2032
- Table 80: Global Semiconductor Silicon Intellectual Property Industry Revenue Million Forecast, by End-user Vertical 2019 & 2032
- Table 81: Global Semiconductor Silicon Intellectual Property Industry Revenue Million Forecast, by Country 2019 & 2032
Frequently Asked Questions
1. What is the projected Compound Annual Growth Rate (CAGR) of the Semiconductor Silicon Intellectual Property Industry?
The projected CAGR is approximately 7.38%.
2. Which companies are prominent players in the Semiconductor Silicon Intellectual Property Industry?
Key companies in the market include Rambus Incorporated, Achronix Semiconductor Corporation, CEVA Inc, LTIMindtree Limited, Imagination Technologies Ltd, Fujitsu Ltd, Andes Technology Corporation, Faraday Technology Corporation, MIPS Tech LLC, Digital Media Professionals, Synopsys Inc, Cadence Design Systems Inc, eMemory Technology Inc, MediaTek Inc, VeriSilicon Holdings Co Ltd, ARM Ltd (SoftBank ).
3. What are the main segments of the Semiconductor Silicon Intellectual Property Industry?
The market segments include Revenue Type, IP Type, End-user Vertical.
4. Can you provide details about the market size?
The market size is estimated to be USD XX Million as of 2022.
5. What are some drivers contributing to market growth?
Growing Demand for Connected Devices; Growing Demand for Modern SoC Designs.
6. What are the notable trends driving market growth?
Consumer Electronics to be the Largest End-user Vertical.
7. Are there any restraints impacting market growth?
IP Business Model and Economies of Scale.
8. Can you provide examples of recent developments in the market?
May 2023: CEVA Inc. announced the acquisition of the RealSpace 3D Spatial Audio business, technology, and patents from VisiSonicsCorporation. Based in Maryland, close to CEVA's sensor fusion R&D development center, the VisiSonicsspatial audio R&D team and software expand the Company's application software portfolio for embedded systems, bolstering CEVA's strong market position in wearables, where spatial audio is fast becoming a must-have component.
9. What pricing options are available for accessing the report?
Pricing options include single-user, multi-user, and enterprise licenses priced at USD 4750, USD 5250, and USD 8750 respectively.
10. Is the market size provided in terms of value or volume?
The market size is provided in terms of value, measured in Million.
11. Are there any specific market keywords associated with the report?
Yes, the market keyword associated with the report is "Semiconductor Silicon Intellectual Property Industry," which aids in identifying and referencing the specific market segment covered.
12. How do I determine which pricing option suits my needs best?
The pricing options vary based on user requirements and access needs. Individual users may opt for single-user licenses, while businesses requiring broader access may choose multi-user or enterprise licenses for cost-effective access to the report.
13. Are there any additional resources or data provided in the Semiconductor Silicon Intellectual Property Industry report?
While the report offers comprehensive insights, it's advisable to review the specific contents or supplementary materials provided to ascertain if additional resources or data are available.
14. How can I stay updated on further developments or reports in the Semiconductor Silicon Intellectual Property Industry?
To stay informed about further developments, trends, and reports in the Semiconductor Silicon Intellectual Property Industry, consider subscribing to industry newsletters, following relevant companies and organizations, or regularly checking reputable industry news sources and publications.
Methodology
Step 1 - Identification of Relevant Samples Size from Population Database


Step 2 - Approaches for Defining Global Market Size (Value, Volume* & Price*)

Note*: In applicable scenarios
Step 3 - Data Sources
Primary Research
- Web Analytics
- Survey Reports
- Research Institute
- Latest Research Reports
- Opinion Leaders
Secondary Research
- Annual Reports
- White Paper
- Latest Press Release
- Industry Association
- Paid Database
- Investor Presentations

Step 4 - Data Triangulation
Involves using different sources of information in order to increase the validity of a study
These sources are likely to be stakeholders in a program - participants, other researchers, program staff, other community members, and so on.
Then we put all data in single framework & apply various statistical tools to find out the dynamic on the market.
During the analysis stage, feedback from the stakeholder groups would be compared to determine areas of agreement as well as areas of divergence


