Key Insights
The Indonesian retail market, valued at $56.87 billion in 2025, is projected for significant expansion at a Compound Annual Growth Rate (CAGR) of 5.6% through 2033. This growth is propelled by increasing disposable incomes, a growing middle class, and the accelerated adoption of e-commerce and digital payment systems. Government initiatives supporting infrastructure development and improving the ease of doing business also foster a favorable investment climate. Key challenges include intense competition from established and emerging players, necessitating strategic differentiation and operational efficiency. Managing supply chain consistency and inflationary pressures are ongoing concerns. The market is segmented by product type, retail format, and geography, each presenting distinct growth trajectories and opportunities.
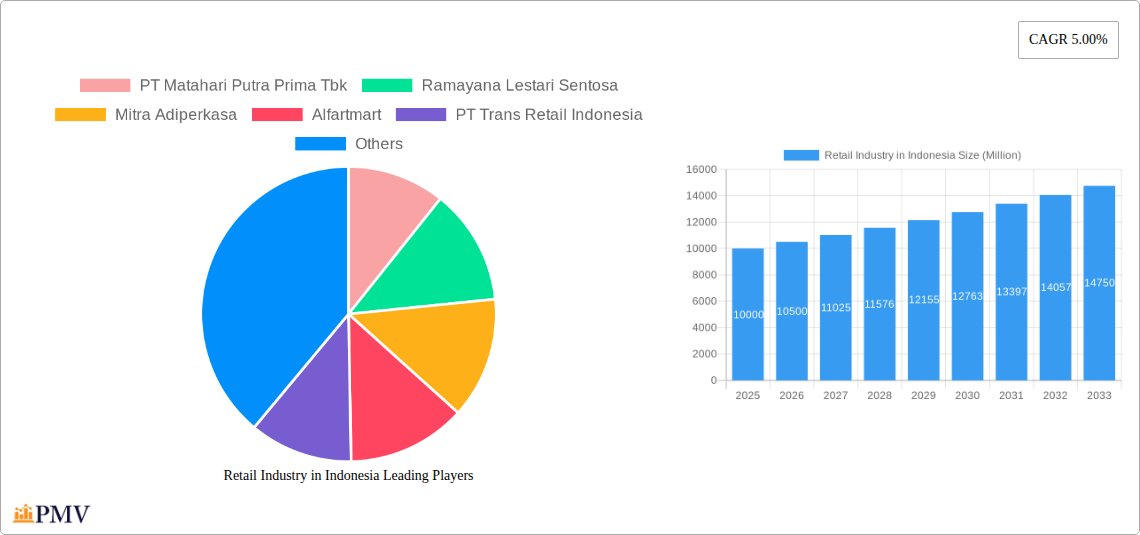
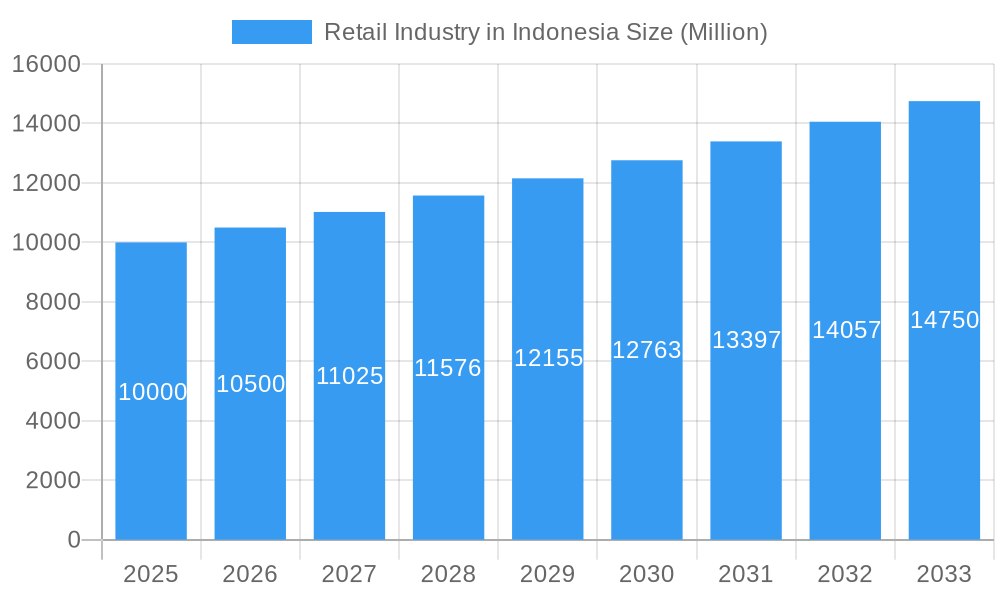
Retail Industry in Indonesia Market Size (In Billion)
The forecast period (2025-2033) indicates substantial evolution in the Indonesian retail landscape, influenced by shifting consumer preferences, technological advancements, and macroeconomic factors. Success will hinge on strategic investments in technology, omnichannel strategies, and supply chain optimization. Delivering superior customer experiences, personalized offerings, and value-added services will be paramount. Understanding regional market nuances is crucial for targeted strategies and maximizing market penetration. A data-driven approach to identify emerging trends and adapt business models will drive sustained growth.
Retail Industry in Indonesia Company Market Share
Indonesian Retail Market Analysis: 2019-2033 Outlook
This comprehensive report delivers an in-depth analysis of the Indonesian retail sector, detailing market structure, competitive landscape, industry trends, and future growth prospects from 2019 to 2033. The analysis includes the historical period (2019-2024), base year (2025), and forecast period (2025-2033). This report is vital for businesses, investors, and policymakers seeking to leverage opportunities in this dynamic market. All market values are presented in Millions (M).
Retail Industry in Indonesia Market Structure & Competitive Dynamics
The Indonesian retail market is characterized by a complex interplay of established players and emerging disruptors. Market concentration is moderate, with a few large players holding significant shares, but a large number of smaller businesses also contributing substantially. The competitive landscape is intensely dynamic, driven by rapid technological advancements, evolving consumer preferences, and ongoing mergers and acquisitions (M&A) activity.
- Market Concentration: While precise market share data for each player fluctuates yearly, major players like PT Matahari Putra Prima Tbk and Mitra Adiperkasa hold significant shares in their respective segments (apparel and luxury goods, respectively). Smaller players collectively contribute a large portion of the overall market share, resulting in a moderately concentrated market.
- Innovation Ecosystems: Indonesia possesses a burgeoning startup ecosystem, fostering innovation in areas such as e-commerce and fintech, significantly impacting the retail landscape. Incubators and accelerators support new business models and technologies within the retail sector.
- Regulatory Frameworks: Government policies, including those related to e-commerce regulations and foreign investment, influence the competitive dynamics. Changes in these frameworks can either ease or restrict market entry and expansion.
- Product Substitutes: The rise of online marketplaces and the growing popularity of direct-to-consumer (DTC) brands pose a significant threat to traditional brick-and-mortar retailers. Consumers increasingly choose convenient alternatives.
- End-User Trends: Shifting consumer preferences towards convenience, value-for-money products, and personalized experiences are reshaping the retail landscape. The rising middle class fuels demand for diverse products and services.
- M&A Activities: The Indonesian retail sector has witnessed considerable M&A activity in recent years, with deal values in the range of xx M USD annually. These activities, while not always publicly disclosed in detail, aim for market consolidation, expansion, and access to new technologies.
Retail Industry in Indonesia Industry Trends & Insights
The Indonesian retail industry is experiencing robust growth, driven by a young and expanding population, increasing disposable incomes, and the rapid expansion of e-commerce. The Compound Annual Growth Rate (CAGR) for the period 2019-2024 was estimated to be xx%, and is projected to be xx% for 2025-2033. Market penetration of e-commerce continues to grow, driven by increased smartphone adoption and improved internet infrastructure.
Technological disruptions, such as the adoption of mobile payment systems, AI-powered personalization, and omnichannel strategies, are significantly altering the retail landscape. Consumers increasingly expect seamless integration between online and offline shopping experiences, pushing retailers to adapt their strategies. Competitive dynamics are intense, with traditional retailers facing competition from both online marketplaces and smaller, more agile businesses. These trends are affecting pricing strategies, inventory management, and customer service expectations. Market growth is also dependent on macroeconomic factors, such as inflation and consumer confidence. Fluctuations in these variables can impact consumer spending habits and overall market performance.
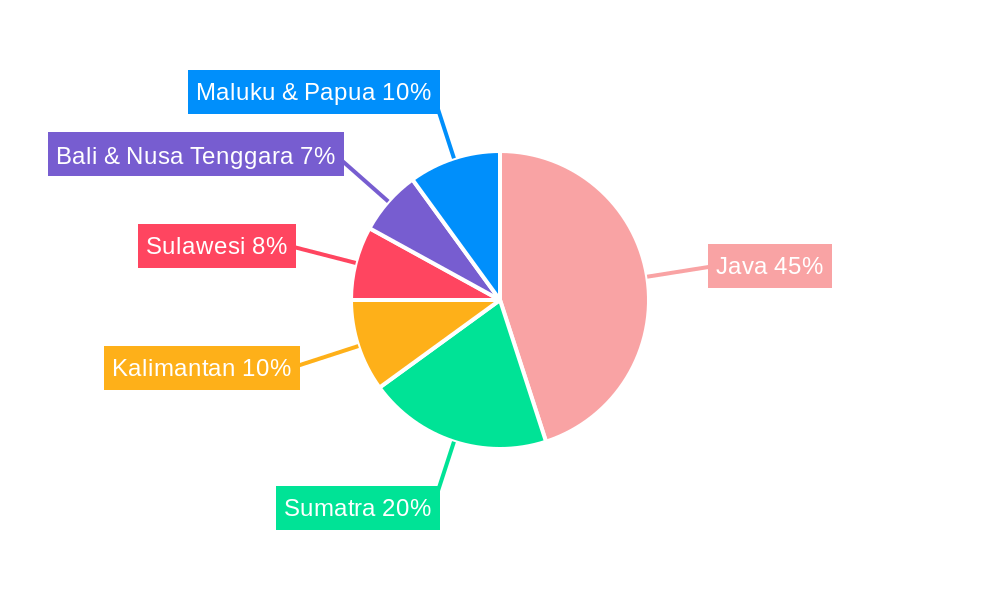
Dominant Markets & Segments in Retail Industry in Indonesia
Java, as the most populous island, holds a dominant position in the Indonesian retail market. Its concentration of population and economic activity makes it a key area for retailers.
- Key Drivers of Java's Dominance:
- High population density
- Strong economic activity
- Developed infrastructure (including transportation and logistics)
- High consumer spending
- Presence of major retail players and distribution hubs
Detailed dominance analysis reveals that Java's dominance extends across various retail segments, including grocery, apparel, electronics, and pharmaceuticals. This is primarily due to its advanced infrastructure, higher purchasing power, and concentration of businesses. Other regions, while experiencing growth, lag behind Java in terms of retail market size and sophistication. Government initiatives aimed at regional development could potentially alter this dominance in the long term, but Java’s current head start remains substantial.
Retail Industry in Indonesia Product Innovations
Recent product innovations in Indonesia's retail sector reflect a strong focus on convenience, personalization, and technological integration. Omnichannel strategies, integrating online and offline shopping experiences, are becoming increasingly prevalent. Mobile payment systems and other fintech solutions are transforming payment processes, while AI-powered personalization tools enable tailored product recommendations and targeted marketing campaigns. This technological convergence allows for improved customer engagement and greater efficiency across the value chain. These innovations are designed to improve market fit by catering to the evolving needs and preferences of Indonesian consumers.
Report Segmentation & Scope
This report segments the Indonesian retail market based on various factors, including product category (e.g., food and grocery, apparel, electronics, cosmetics), retail format (e.g., supermarkets, hypermarkets, convenience stores, e-commerce), and geographic region. Each segment's growth projection, market size (in M USD), and competitive dynamics are detailed within the full report. For instance, the food and grocery segment exhibits substantial growth, driven by rising food consumption, while the e-commerce segment is characterized by intense competition and rapid innovation. The apparel segment is influenced by fashion trends and changing consumer preferences.
Key Drivers of Retail Industry in Indonesia Growth
Several factors drive growth in Indonesia's retail industry:
- Expanding Middle Class: A growing middle class with increasing disposable income fuels consumer spending across various retail segments.
- E-commerce Boom: The rapid expansion of e-commerce platforms provides convenient access to a wider range of goods and services.
- Technological Advancements: Innovations in payment systems, logistics, and marketing enhance efficiency and customer experience.
- Government Initiatives: Policies supporting infrastructure development and ease of doing business contribute to market growth.
Challenges in the Retail Industry in Indonesia Sector
Despite the significant growth potential, challenges remain within the Indonesian retail sector:
- Infrastructure Gaps: Uneven infrastructure development in certain regions limits accessibility and efficient logistics.
- Supply Chain Issues: Maintaining a reliable and cost-effective supply chain can be challenging, especially in more remote areas.
- Intense Competition: The competitive landscape is extremely dynamic, requiring constant adaptation and innovation.
- Regulatory Hurdles: Navigating regulatory frameworks can pose complexities for businesses.
Leading Players in the Retail Industry in Indonesia Market
- PT Matahari Putra Prima Tbk
- Ramayana Lestari Sentosa
- Mitra Adiperkasa
- Alfamart
- PT Trans Retail Indonesia
- Hero Supermarket Group
- Erajaya Swasembada
- AEON Group
- Lotte Mart
- Indomarket
Key Developments in Retail Industry in Indonesia Sector
- February 2021: Apparel retailer Giordano opened a large-scale store in Bumi Raya City Mall, Pontianak. This exemplifies the expansion of international brands into Indonesia's growing retail market. Further expansion by international retailers can be expected as the market matures.
Strategic Retail Industry in Indonesia Market Outlook
The Indonesian retail industry offers substantial growth opportunities for both domestic and international players. Continued expansion of e-commerce, rising consumer spending, and technological advancements will drive market growth in the coming years. Strategic opportunities exist in focusing on omnichannel strategies, leveraging technological innovations, and catering to the specific needs and preferences of diverse consumer segments. The market's dynamism necessitates agility and adaptability to maintain a competitive edge. By understanding and capitalizing on these trends, businesses can achieve significant success within this thriving market.
Retail Industry in Indonesia Segmentation
-
1. Product
- 1.1. Food and Beverages
- 1.2. Personal and Household Care
- 1.3. Apparel, Footwear, and Accessories
- 1.4. Furniture, Toys, and Hobby
- 1.5. Electronic and Household Appliances
- 1.6. Other Products
-
2. Distribution Channel
- 2.1. Supermar
- 2.2. Specialty Stores
- 2.3. Online
- 2.4. Other Distribution Channels
Retail Industry in Indonesia Segmentation By Geography
-
1. North America
- 1.1. United States
- 1.2. Canada
- 1.3. Mexico
-
2. South America
- 2.1. Brazil
- 2.2. Argentina
- 2.3. Rest of South America
-
3. Europe
- 3.1. United Kingdom
- 3.2. Germany
- 3.3. France
- 3.4. Italy
- 3.5. Spain
- 3.6. Russia
- 3.7. Benelux
- 3.8. Nordics
- 3.9. Rest of Europe
-
4. Middle East & Africa
- 4.1. Turkey
- 4.2. Israel
- 4.3. GCC
- 4.4. North Africa
- 4.5. South Africa
- 4.6. Rest of Middle East & Africa
-
5. Asia Pacific
- 5.1. China
- 5.2. India
- 5.3. Japan
- 5.4. South Korea
- 5.5. ASEAN
- 5.6. Oceania
- 5.7. Rest of Asia Pacific
Retail Industry in Indonesia Regional Market Share
Geographic Coverage of Retail Industry in Indonesia
Retail Industry in Indonesia REPORT HIGHLIGHTS
| Aspects | Details |
|---|---|
| Study Period | 2020-2034 |
| Base Year | 2025 |
| Estimated Year | 2026 |
| Forecast Period | 2026-2034 |
| Historical Period | 2020-2025 |
| Growth Rate | CAGR of 5.6% from 2020-2034 |
| Segmentation |
|
Table of Contents
- 1. Introduction
- 1.1. Research Scope
- 1.2. Market Segmentation
- 1.3. Research Objective
- 1.4. Definitions and Assumptions
- 2. Executive Summary
- 2.1. Market Snapshot
- 3. Market Dynamics
- 3.1. Market Drivers
- 3.2. Market Restrains
- 3.3. Market Trends
- 3.4. Market Opportunities
- 4. Market Factor Analysis
- 4.1. Porters Five Forces
- 4.1.1. Bargaining Power of Suppliers
- 4.1.2. Bargaining Power of Buyers
- 4.1.3. Threat of New Entrants
- 4.1.4. Threat of Substitutes
- 4.1.5. Competitive Rivalry
- 4.2. PESTEL analysis
- 4.3. BCG Analysis
- 4.3.1. Stars (High Growth, High Market Share)
- 4.3.2. Cash Cows (Low Growth, High Market Share)
- 4.3.3. Question Mark (High Growth, Low Market Share)
- 4.3.4. Dogs (Low Growth, Low Market Share)
- 4.4. Ansoff Matrix Analysis
- 4.5. Supply Chain Analysis
- 4.6. Regulatory Landscape
- 4.7. Current Market Potential and Opportunity Assessment (TAM–SAM–SOM Framework)
- 4.8. PMV Analyst Note
- 4.1. Porters Five Forces
- 5. Market Analysis, Insights and Forecast 2021-2033
- 5.1. Market Analysis, Insights and Forecast - by Product
- 5.1.1. Food and Beverages
- 5.1.2. Personal and Household Care
- 5.1.3. Apparel, Footwear, and Accessories
- 5.1.4. Furniture, Toys, and Hobby
- 5.1.5. Electronic and Household Appliances
- 5.1.6. Other Products
- 5.2. Market Analysis, Insights and Forecast - by Distribution Channel
- 5.2.1. Supermar
- 5.2.2. Specialty Stores
- 5.2.3. Online
- 5.2.4. Other Distribution Channels
- 5.3. Market Analysis, Insights and Forecast - by Region
- 5.3.1. North America
- 5.3.2. South America
- 5.3.3. Europe
- 5.3.4. Middle East & Africa
- 5.3.5. Asia Pacific
- 5.1. Market Analysis, Insights and Forecast - by Product
- 6. Global Retail Industry in Indonesia Analysis, Insights and Forecast, 2021-2033
- 6.1. Market Analysis, Insights and Forecast - by Product
- 6.1.1. Food and Beverages
- 6.1.2. Personal and Household Care
- 6.1.3. Apparel, Footwear, and Accessories
- 6.1.4. Furniture, Toys, and Hobby
- 6.1.5. Electronic and Household Appliances
- 6.1.6. Other Products
- 6.2. Market Analysis, Insights and Forecast - by Distribution Channel
- 6.2.1. Supermar
- 6.2.2. Specialty Stores
- 6.2.3. Online
- 6.2.4. Other Distribution Channels
- 6.1. Market Analysis, Insights and Forecast - by Product
- 7. North America Retail Industry in Indonesia Analysis, Insights and Forecast, 2020-2032
- 7.1. Market Analysis, Insights and Forecast - by Product
- 7.1.1. Food and Beverages
- 7.1.2. Personal and Household Care
- 7.1.3. Apparel, Footwear, and Accessories
- 7.1.4. Furniture, Toys, and Hobby
- 7.1.5. Electronic and Household Appliances
- 7.1.6. Other Products
- 7.2. Market Analysis, Insights and Forecast - by Distribution Channel
- 7.2.1. Supermar
- 7.2.2. Specialty Stores
- 7.2.3. Online
- 7.2.4. Other Distribution Channels
- 7.1. Market Analysis, Insights and Forecast - by Product
- 8. South America Retail Industry in Indonesia Analysis, Insights and Forecast, 2020-2032
- 8.1. Market Analysis, Insights and Forecast - by Product
- 8.1.1. Food and Beverages
- 8.1.2. Personal and Household Care
- 8.1.3. Apparel, Footwear, and Accessories
- 8.1.4. Furniture, Toys, and Hobby
- 8.1.5. Electronic and Household Appliances
- 8.1.6. Other Products
- 8.2. Market Analysis, Insights and Forecast - by Distribution Channel
- 8.2.1. Supermar
- 8.2.2. Specialty Stores
- 8.2.3. Online
- 8.2.4. Other Distribution Channels
- 8.1. Market Analysis, Insights and Forecast - by Product
- 9. Europe Retail Industry in Indonesia Analysis, Insights and Forecast, 2020-2032
- 9.1. Market Analysis, Insights and Forecast - by Product
- 9.1.1. Food and Beverages
- 9.1.2. Personal and Household Care
- 9.1.3. Apparel, Footwear, and Accessories
- 9.1.4. Furniture, Toys, and Hobby
- 9.1.5. Electronic and Household Appliances
- 9.1.6. Other Products
- 9.2. Market Analysis, Insights and Forecast - by Distribution Channel
- 9.2.1. Supermar
- 9.2.2. Specialty Stores
- 9.2.3. Online
- 9.2.4. Other Distribution Channels
- 9.1. Market Analysis, Insights and Forecast - by Product
- 10. Middle East & Africa Retail Industry in Indonesia Analysis, Insights and Forecast, 2020-2032
- 10.1. Market Analysis, Insights and Forecast - by Product
- 10.1.1. Food and Beverages
- 10.1.2. Personal and Household Care
- 10.1.3. Apparel, Footwear, and Accessories
- 10.1.4. Furniture, Toys, and Hobby
- 10.1.5. Electronic and Household Appliances
- 10.1.6. Other Products
- 10.2. Market Analysis, Insights and Forecast - by Distribution Channel
- 10.2.1. Supermar
- 10.2.2. Specialty Stores
- 10.2.3. Online
- 10.2.4. Other Distribution Channels
- 10.1. Market Analysis, Insights and Forecast - by Product
- 11. Asia Pacific Retail Industry in Indonesia Analysis, Insights and Forecast, 2020-2032
- 11.1. Market Analysis, Insights and Forecast - by Product
- 11.1.1. Food and Beverages
- 11.1.2. Personal and Household Care
- 11.1.3. Apparel, Footwear, and Accessories
- 11.1.4. Furniture, Toys, and Hobby
- 11.1.5. Electronic and Household Appliances
- 11.1.6. Other Products
- 11.2. Market Analysis, Insights and Forecast - by Distribution Channel
- 11.2.1. Supermar
- 11.2.2. Specialty Stores
- 11.2.3. Online
- 11.2.4. Other Distribution Channels
- 11.1. Market Analysis, Insights and Forecast - by Product
- 12. Competitive Analysis
- 12.1. Company Profiles
- 12.1.1 PT Matahari Putra Prima Tbk
- 12.1.1.1. Company Overview
- 12.1.1.2. Products
- 12.1.1.3. Company Financials
- 12.1.1.4. SWOT Analysis
- 12.1.2 Ramayana Lestari Sentosa
- 12.1.2.1. Company Overview
- 12.1.2.2. Products
- 12.1.2.3. Company Financials
- 12.1.2.4. SWOT Analysis
- 12.1.3 Mitra Adiperkasa
- 12.1.3.1. Company Overview
- 12.1.3.2. Products
- 12.1.3.3. Company Financials
- 12.1.3.4. SWOT Analysis
- 12.1.4 Alfartmart
- 12.1.4.1. Company Overview
- 12.1.4.2. Products
- 12.1.4.3. Company Financials
- 12.1.4.4. SWOT Analysis
- 12.1.5 PT Trans Retail Indonesia
- 12.1.5.1. Company Overview
- 12.1.5.2. Products
- 12.1.5.3. Company Financials
- 12.1.5.4. SWOT Analysis
- 12.1.6 Hero Supermarket Group
- 12.1.6.1. Company Overview
- 12.1.6.2. Products
- 12.1.6.3. Company Financials
- 12.1.6.4. SWOT Analysis
- 12.1.7 Erajaya Swasembada
- 12.1.7.1. Company Overview
- 12.1.7.2. Products
- 12.1.7.3. Company Financials
- 12.1.7.4. SWOT Analysis
- 12.1.8 AEON Group
- 12.1.8.1. Company Overview
- 12.1.8.2. Products
- 12.1.8.3. Company Financials
- 12.1.8.4. SWOT Analysis
- 12.1.9 Lotte Mart
- 12.1.9.1. Company Overview
- 12.1.9.2. Products
- 12.1.9.3. Company Financials
- 12.1.9.4. SWOT Analysis
- 12.1.10 Indomarket**List Not Exhaustive
- 12.1.10.1. Company Overview
- 12.1.10.2. Products
- 12.1.10.3. Company Financials
- 12.1.10.4. SWOT Analysis
- 12.1.1 PT Matahari Putra Prima Tbk
- 12.2. Market Entropy
- 12.2.1 Company's Key Areas Served
- 12.2.2 Recent Developments
- 12.3. Company Market Share Analysis 2025
- 12.3.1 Top 5 Companies Market Share Analysis
- 12.3.2 Top 3 Companies Market Share Analysis
- 12.4. List of Potential Customers
- 13. Research Methodology
List of Figures
- Figure 1: Global Retail Industry in Indonesia Revenue Breakdown (billion, %) by Region 2025 & 2033
- Figure 2: North America Retail Industry in Indonesia Revenue (billion), by Product 2025 & 2033
- Figure 3: North America Retail Industry in Indonesia Revenue Share (%), by Product 2025 & 2033
- Figure 4: North America Retail Industry in Indonesia Revenue (billion), by Distribution Channel 2025 & 2033
- Figure 5: North America Retail Industry in Indonesia Revenue Share (%), by Distribution Channel 2025 & 2033
- Figure 6: North America Retail Industry in Indonesia Revenue (billion), by Country 2025 & 2033
- Figure 7: North America Retail Industry in Indonesia Revenue Share (%), by Country 2025 & 2033
- Figure 8: South America Retail Industry in Indonesia Revenue (billion), by Product 2025 & 2033
- Figure 9: South America Retail Industry in Indonesia Revenue Share (%), by Product 2025 & 2033
- Figure 10: South America Retail Industry in Indonesia Revenue (billion), by Distribution Channel 2025 & 2033
- Figure 11: South America Retail Industry in Indonesia Revenue Share (%), by Distribution Channel 2025 & 2033
- Figure 12: South America Retail Industry in Indonesia Revenue (billion), by Country 2025 & 2033
- Figure 13: South America Retail Industry in Indonesia Revenue Share (%), by Country 2025 & 2033
- Figure 14: Europe Retail Industry in Indonesia Revenue (billion), by Product 2025 & 2033
- Figure 15: Europe Retail Industry in Indonesia Revenue Share (%), by Product 2025 & 2033
- Figure 16: Europe Retail Industry in Indonesia Revenue (billion), by Distribution Channel 2025 & 2033
- Figure 17: Europe Retail Industry in Indonesia Revenue Share (%), by Distribution Channel 2025 & 2033
- Figure 18: Europe Retail Industry in Indonesia Revenue (billion), by Country 2025 & 2033
- Figure 19: Europe Retail Industry in Indonesia Revenue Share (%), by Country 2025 & 2033
- Figure 20: Middle East & Africa Retail Industry in Indonesia Revenue (billion), by Product 2025 & 2033
- Figure 21: Middle East & Africa Retail Industry in Indonesia Revenue Share (%), by Product 2025 & 2033
- Figure 22: Middle East & Africa Retail Industry in Indonesia Revenue (billion), by Distribution Channel 2025 & 2033
- Figure 23: Middle East & Africa Retail Industry in Indonesia Revenue Share (%), by Distribution Channel 2025 & 2033
- Figure 24: Middle East & Africa Retail Industry in Indonesia Revenue (billion), by Country 2025 & 2033
- Figure 25: Middle East & Africa Retail Industry in Indonesia Revenue Share (%), by Country 2025 & 2033
- Figure 26: Asia Pacific Retail Industry in Indonesia Revenue (billion), by Product 2025 & 2033
- Figure 27: Asia Pacific Retail Industry in Indonesia Revenue Share (%), by Product 2025 & 2033
- Figure 28: Asia Pacific Retail Industry in Indonesia Revenue (billion), by Distribution Channel 2025 & 2033
- Figure 29: Asia Pacific Retail Industry in Indonesia Revenue Share (%), by Distribution Channel 2025 & 2033
- Figure 30: Asia Pacific Retail Industry in Indonesia Revenue (billion), by Country 2025 & 2033
- Figure 31: Asia Pacific Retail Industry in Indonesia Revenue Share (%), by Country 2025 & 2033
List of Tables
- Table 1: Global Retail Industry in Indonesia Revenue billion Forecast, by Product 2020 & 2033
- Table 2: Global Retail Industry in Indonesia Revenue billion Forecast, by Distribution Channel 2020 & 2033
- Table 3: Global Retail Industry in Indonesia Revenue billion Forecast, by Region 2020 & 2033
- Table 4: Global Retail Industry in Indonesia Revenue billion Forecast, by Product 2020 & 2033
- Table 5: Global Retail Industry in Indonesia Revenue billion Forecast, by Distribution Channel 2020 & 2033
- Table 6: Global Retail Industry in Indonesia Revenue billion Forecast, by Country 2020 & 2033
- Table 7: United States Retail Industry in Indonesia Revenue (billion) Forecast, by Application 2020 & 2033
- Table 8: Canada Retail Industry in Indonesia Revenue (billion) Forecast, by Application 2020 & 2033
- Table 9: Mexico Retail Industry in Indonesia Revenue (billion) Forecast, by Application 2020 & 2033
- Table 10: Global Retail Industry in Indonesia Revenue billion Forecast, by Product 2020 & 2033
- Table 11: Global Retail Industry in Indonesia Revenue billion Forecast, by Distribution Channel 2020 & 2033
- Table 12: Global Retail Industry in Indonesia Revenue billion Forecast, by Country 2020 & 2033
- Table 13: Brazil Retail Industry in Indonesia Revenue (billion) Forecast, by Application 2020 & 2033
- Table 14: Argentina Retail Industry in Indonesia Revenue (billion) Forecast, by Application 2020 & 2033
- Table 15: Rest of South America Retail Industry in Indonesia Revenue (billion) Forecast, by Application 2020 & 2033
- Table 16: Global Retail Industry in Indonesia Revenue billion Forecast, by Product 2020 & 2033
- Table 17: Global Retail Industry in Indonesia Revenue billion Forecast, by Distribution Channel 2020 & 2033
- Table 18: Global Retail Industry in Indonesia Revenue billion Forecast, by Country 2020 & 2033
- Table 19: United Kingdom Retail Industry in Indonesia Revenue (billion) Forecast, by Application 2020 & 2033
- Table 20: Germany Retail Industry in Indonesia Revenue (billion) Forecast, by Application 2020 & 2033
- Table 21: France Retail Industry in Indonesia Revenue (billion) Forecast, by Application 2020 & 2033
- Table 22: Italy Retail Industry in Indonesia Revenue (billion) Forecast, by Application 2020 & 2033
- Table 23: Spain Retail Industry in Indonesia Revenue (billion) Forecast, by Application 2020 & 2033
- Table 24: Russia Retail Industry in Indonesia Revenue (billion) Forecast, by Application 2020 & 2033
- Table 25: Benelux Retail Industry in Indonesia Revenue (billion) Forecast, by Application 2020 & 2033
- Table 26: Nordics Retail Industry in Indonesia Revenue (billion) Forecast, by Application 2020 & 2033
- Table 27: Rest of Europe Retail Industry in Indonesia Revenue (billion) Forecast, by Application 2020 & 2033
- Table 28: Global Retail Industry in Indonesia Revenue billion Forecast, by Product 2020 & 2033
- Table 29: Global Retail Industry in Indonesia Revenue billion Forecast, by Distribution Channel 2020 & 2033
- Table 30: Global Retail Industry in Indonesia Revenue billion Forecast, by Country 2020 & 2033
- Table 31: Turkey Retail Industry in Indonesia Revenue (billion) Forecast, by Application 2020 & 2033
- Table 32: Israel Retail Industry in Indonesia Revenue (billion) Forecast, by Application 2020 & 2033
- Table 33: GCC Retail Industry in Indonesia Revenue (billion) Forecast, by Application 2020 & 2033
- Table 34: North Africa Retail Industry in Indonesia Revenue (billion) Forecast, by Application 2020 & 2033
- Table 35: South Africa Retail Industry in Indonesia Revenue (billion) Forecast, by Application 2020 & 2033
- Table 36: Rest of Middle East & Africa Retail Industry in Indonesia Revenue (billion) Forecast, by Application 2020 & 2033
- Table 37: Global Retail Industry in Indonesia Revenue billion Forecast, by Product 2020 & 2033
- Table 38: Global Retail Industry in Indonesia Revenue billion Forecast, by Distribution Channel 2020 & 2033
- Table 39: Global Retail Industry in Indonesia Revenue billion Forecast, by Country 2020 & 2033
- Table 40: China Retail Industry in Indonesia Revenue (billion) Forecast, by Application 2020 & 2033
- Table 41: India Retail Industry in Indonesia Revenue (billion) Forecast, by Application 2020 & 2033
- Table 42: Japan Retail Industry in Indonesia Revenue (billion) Forecast, by Application 2020 & 2033
- Table 43: South Korea Retail Industry in Indonesia Revenue (billion) Forecast, by Application 2020 & 2033
- Table 44: ASEAN Retail Industry in Indonesia Revenue (billion) Forecast, by Application 2020 & 2033
- Table 45: Oceania Retail Industry in Indonesia Revenue (billion) Forecast, by Application 2020 & 2033
- Table 46: Rest of Asia Pacific Retail Industry in Indonesia Revenue (billion) Forecast, by Application 2020 & 2033
Frequently Asked Questions
1. What is the projected Compound Annual Growth Rate (CAGR) of the Retail Industry in Indonesia?
The projected CAGR is approximately 5.6%.
2. Which companies are prominent players in the Retail Industry in Indonesia?
Key companies in the market include PT Matahari Putra Prima Tbk, Ramayana Lestari Sentosa, Mitra Adiperkasa, Alfartmart, PT Trans Retail Indonesia, Hero Supermarket Group, Erajaya Swasembada, AEON Group, Lotte Mart, Indomarket**List Not Exhaustive.
3. What are the main segments of the Retail Industry in Indonesia?
The market segments include Product, Distribution Channel.
4. Can you provide details about the market size?
The market size is estimated to be USD 56.87 billion as of 2022.
5. What are some drivers contributing to market growth?
N/A
6. What are the notable trends driving market growth?
Online Retailing is Gaining More Traction. Yet Physical Retailing is Dominating the Market.
7. Are there any restraints impacting market growth?
N/A
8. Can you provide examples of recent developments in the market?
In February 2021, Apparel retailer Giordano unveiled a large-scale store in the newly opened Bumi Raya City Mall in Pontianak, Indonesia.
9. What pricing options are available for accessing the report?
Pricing options include single-user, multi-user, and enterprise licenses priced at USD 3800, USD 4500, and USD 5800 respectively.
10. Is the market size provided in terms of value or volume?
The market size is provided in terms of value, measured in billion.
11. Are there any specific market keywords associated with the report?
Yes, the market keyword associated with the report is "Retail Industry in Indonesia," which aids in identifying and referencing the specific market segment covered.
12. How do I determine which pricing option suits my needs best?
The pricing options vary based on user requirements and access needs. Individual users may opt for single-user licenses, while businesses requiring broader access may choose multi-user or enterprise licenses for cost-effective access to the report.
13. Are there any additional resources or data provided in the Retail Industry in Indonesia report?
While the report offers comprehensive insights, it's advisable to review the specific contents or supplementary materials provided to ascertain if additional resources or data are available.
14. How can I stay updated on further developments or reports in the Retail Industry in Indonesia?
To stay informed about further developments, trends, and reports in the Retail Industry in Indonesia, consider subscribing to industry newsletters, following relevant companies and organizations, or regularly checking reputable industry news sources and publications.
Methodology
Step 1 - Identification of Relevant Samples Size from Population Database


Step 2 - Approaches for Defining Global Market Size (Value, Volume* & Price*)

Note*: In applicable scenarios
Step 3 - Data Sources
Primary Research
- Web Analytics
- Survey Reports
- Research Institute
- Latest Research Reports
- Opinion Leaders
Secondary Research
- Annual Reports
- White Paper
- Latest Press Release
- Industry Association
- Paid Database
- Investor Presentations

Step 4 - Data Triangulation
Involves using different sources of information in order to increase the validity of a study
These sources are likely to be stakeholders in a program - participants, other researchers, program staff, other community members, and so on.
Then we put all data in single framework & apply various statistical tools to find out the dynamic on the market.
During the analysis stage, feedback from the stakeholder groups would be compared to determine areas of agreement as well as areas of divergence

