

Key Insights
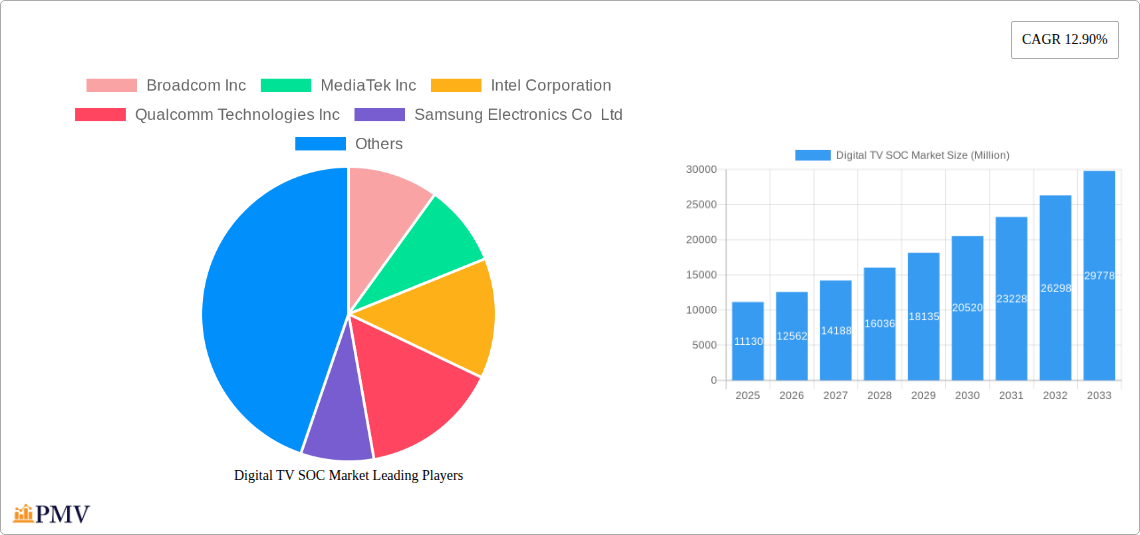
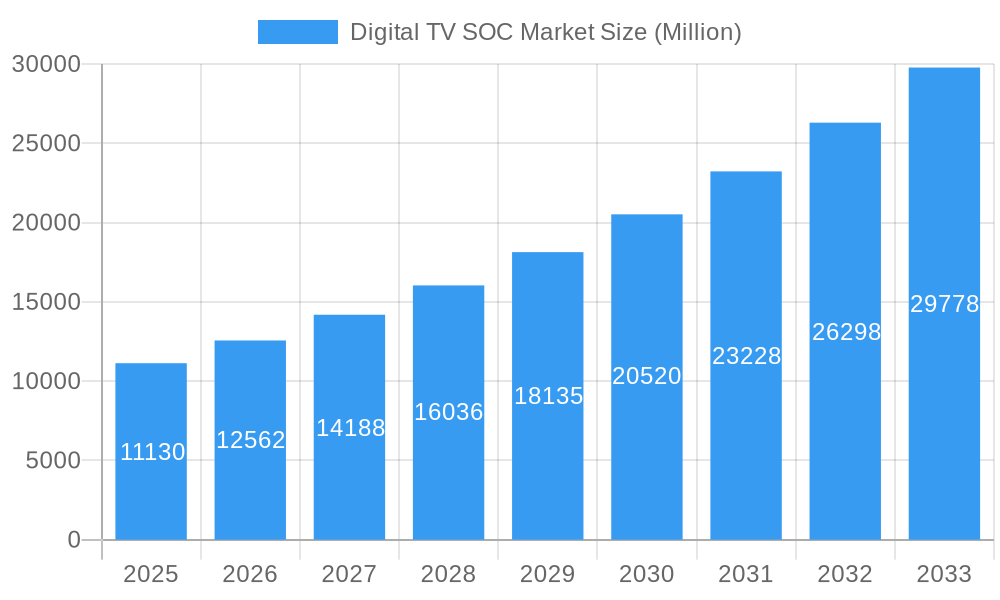
The Digital TV SoC market is experiencing robust growth, projected to reach $11.13 billion in 2025 and maintain a Compound Annual Growth Rate (CAGR) of 12.90% from 2025 to 2033. This expansion is fueled by several key factors. The increasing adoption of smart TVs with advanced features like 4K resolution, HDR, and integrated streaming services is a major driver. Furthermore, the rising demand for higher-quality viewing experiences, coupled with declining prices of Digital TV SoCs, makes them increasingly accessible to consumers globally. The shift towards connected TV ecosystems and the integration of various functionalities within a single chip are further propelling market growth. Leading players such as Broadcom, MediaTek, Intel, Qualcomm, Samsung, and others are heavily investing in R&D to develop cutting-edge SoCs capable of supporting emerging display technologies and enhanced multimedia capabilities. Competition among these companies is driving innovation and affordability, further stimulating market growth.
Digital TV SOC Market Market Size (In Billion)
However, certain restraints are influencing the market trajectory. The maturity of the TV market in developed regions presents a challenge for significant growth in these areas. Additionally, the increasing complexity of SoC designs and the need for specialized expertise can pose barriers to entry for smaller players. Nevertheless, the continuous evolution of display technologies (such as 8K resolution and micro-LED) and the expansion of the smart TV market into developing economies are expected to offset these restraints and maintain a strong growth trajectory throughout the forecast period. Segmentation within the market, although not explicitly detailed, likely includes factors such as resolution (HD, 4K, 8K), integrated features (e.g., voice assistants, AI processing), and target market (e.g., consumer, professional). This segmentation will further impact growth within specific niches.
Digital TV SOC Market Company Market Share
Digital TV SoC Market: A Comprehensive Report (2019-2033)
This detailed report provides a comprehensive analysis of the Digital TV SoC market, offering invaluable insights for stakeholders across the value chain. From market sizing and segmentation to competitive dynamics and future growth projections, this study covers all critical aspects of this dynamic industry. The report leverages extensive data analysis from 2019 to 2024 (Historical Period), establishing a robust base year of 2025 (Base Year) and projecting market trends until 2033 (Forecast Period). The study period encompasses 2019-2033, providing a long-term perspective on market evolution. Key players like Broadcom Inc, MediaTek Inc, Intel Corporation, Qualcomm Technologies Inc, Samsung Electronics Co Ltd, STMicroelectronics NV, Novatek Microelectronics Corp, MStar Semiconductor Inc, LG Electronics Inc, HiSilicon, and NXP Semiconductors are analyzed, although the list is not exhaustive. The report projects a market value of xx Million by 2033.
Digital TV SOC Market Market Structure & Competitive Dynamics
The Digital TV SoC market exhibits a moderately concentrated structure, with a few dominant players holding significant market share. However, a dynamic landscape characterized by ongoing innovation and strategic partnerships ensures continuous evolution. The report analyzes market concentration using the Herfindahl-Hirschman Index (HHI) and assesses the competitive intensity through Porter's Five Forces framework. Innovation ecosystems are crucial, with substantial investments in R&D driving advancements in video processing, energy efficiency, and connectivity features. Regulatory frameworks, particularly those related to broadcasting standards and energy consumption, significantly impact market dynamics. Product substitutes, including streaming services and alternative display technologies, pose a competitive threat. End-user trends, such as the growing preference for 4K and 8K resolution displays and the increasing demand for smart TV functionalities, are shaping market demand. M&A activities, as indicated by the total M&A deal value of xx Million in the last five years, reflect the strategic efforts of major players to consolidate market share and expand their product portfolios. Specific examples of recent acquisitions and their impact on the market are detailed within. Market share data for leading players is provided in Appendix A (xx% Broadcom, xx% MediaTek, etc.).
Digital TV SOC Market Industry Trends & Insights
The Digital TV SoC market is experiencing robust growth, driven by several key factors. The increasing adoption of high-definition and ultra-high-definition televisions is a major catalyst, fueling demand for advanced SoCs capable of processing high-resolution video streams. The expansion of smart TV functionality, including features such as streaming apps, voice control, and interactive gaming, is further boosting market growth. Technological advancements, particularly in areas like high-dynamic range (HDR) imaging, artificial intelligence (AI)-powered image processing, and improved energy efficiency, are revolutionizing the market. The shift towards connected TVs and the increasing penetration of the internet, particularly in developing economies, are creating new opportunities for growth. The rise of over-the-top (OTT) streaming services is also driving market expansion. The market is expected to achieve a Compound Annual Growth Rate (CAGR) of xx% during the forecast period. Market penetration of 4K and 8K TVs is rapidly increasing, from xx% in 2024 to an estimated xx% by 2033. The competitive landscape is marked by intense rivalry among key players, each striving to innovate and differentiate their products.
Dominant Markets & Segments in Digital TV SOC Market
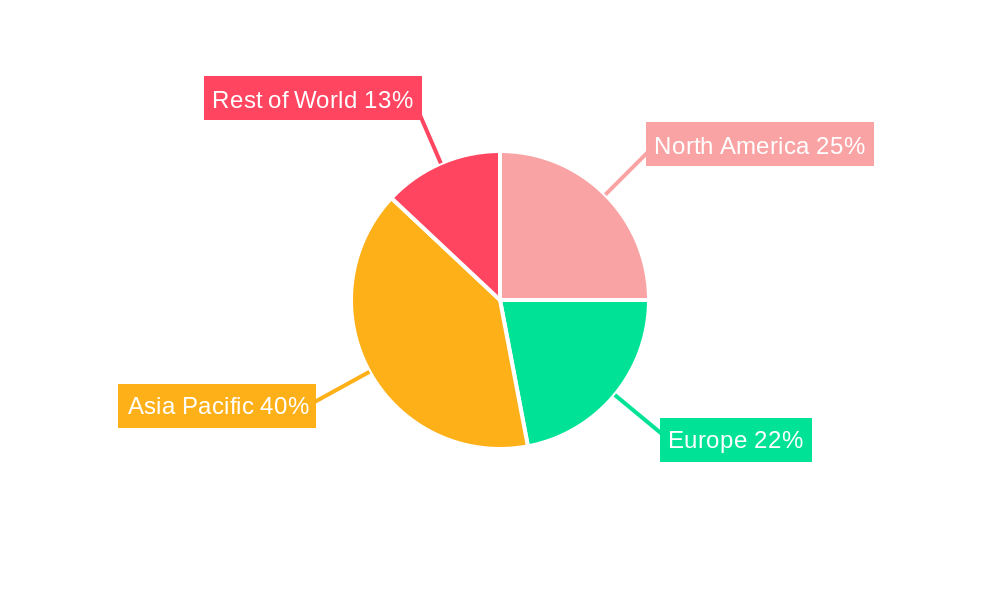
The Asia-Pacific region dominates the Digital TV SoC market, driven by strong economic growth, expanding middle class, and high demand for consumer electronics. China, in particular, holds a significant share due to its large consumer base and robust domestic manufacturing sector.
- Key Drivers in Asia-Pacific:
- Rapid urbanization and rising disposable incomes.
- Favorable government policies promoting technology adoption.
- Extensive infrastructure development supporting broadband access.
- Strong domestic manufacturing base.
The dominance of the Asia-Pacific region can be attributed to several factors. Firstly, the region boasts a large and rapidly growing consumer base with increasing purchasing power. Secondly, the presence of several major electronics manufacturers in countries like China, South Korea, and Japan provides a strong foundation for the market. Government initiatives promoting technological advancement further enhance growth. Finally, the rapid expansion of broadband infrastructure enables the seamless deployment of digital TV services. North America and Europe also hold significant market shares, driven by their established consumer electronics markets and technological advancements.
Digital TV SOC Market Product Innovations
Recent innovations in Digital TV SoCs focus on enhancing video processing capabilities, improving energy efficiency, and integrating advanced features like AI-based image enhancement and voice control. These advancements cater to the growing consumer demand for higher resolution displays, superior picture quality, and seamless user experience. The integration of advanced codecs, such as HEVC and AV1, enables efficient compression and transmission of high-quality video streams, optimizing bandwidth usage. The incorporation of AI-powered features further enhances picture quality and adds new interactive functionalities. The market competitiveness is driven by continuous improvements in power efficiency and the addition of integrated functionalities like Wi-Fi, Bluetooth, and other smart features.
Report Segmentation & Scope
The Digital TV SoC market is segmented by resolution (HD, Full HD, 4K, 8K), by application (Smart TVs, Set-top boxes, Digital signage), and by geography (North America, Europe, Asia-Pacific, Rest of the World). Each segment demonstrates different growth trajectories. The 4K and 8K resolution segments are anticipated to experience the fastest growth, driven by increasing consumer preference for high-resolution visuals. The Smart TV segment is projected to dominate the application market. Growth projections for each segment are detailed in Appendix B, along with market size estimations and competitive analysis.
Key Drivers of Digital TV SOC Market Growth
Several key factors fuel the growth of the Digital TV SoC market. Technological advancements, such as the development of high-resolution displays and efficient video codecs, are pivotal. The increasing affordability of smart TVs and rising disposable incomes are significantly expanding the market's addressable audience. Favorable government regulations promoting digital broadcasting further encourage adoption. The integration of AI-powered features enhances user experience and drives demand. The continued expansion of broadband internet infrastructure globally ensures seamless streaming of high-quality content.
Challenges in the Digital TV SOC Market Sector
The Digital TV SoC market faces challenges, including intense competition, supply chain disruptions, and the emergence of alternative display technologies. The high cost of developing and manufacturing advanced SoCs presents a barrier to entry. Fluctuations in the prices of raw materials and components can impact profitability. Regulatory hurdles in certain markets may hinder growth, and the increasing prevalence of streaming services provides a substitute for traditional television. These challenges are estimated to reduce the overall market growth by approximately xx% during the forecast period.
Leading Players in the Digital TV SOC Market Market
- Broadcom Inc
- MediaTek Inc
- Intel Corporation
- Qualcomm Technologies Inc
- Samsung Electronics Co Ltd
- STMicroelectronics NV
- Novatek Microelectronics Corp
- MStar Semiconductor Inc
- LG Electronics Inc
- HiSilicon
- NXP Semiconductors
Key Developments in Digital TV SOC Market Sector
May 2024: MediaTek announced its Dimensity 9300+ SoC, featuring 18 MB of L3 cache and SLC, supporting LPDDR5T memory (up to 9,600 Mbps) and UFS 4.0 storage. This significantly enhances processing speed and multitasking capabilities for premium mobile applications, indirectly impacting the high-end TV SoC market by setting a technological benchmark.
January 2024: Videocon d2h partnered with MStar Semiconductor for HEVC H.265 SoCs in its HD set-top boxes. This collaboration optimizes bandwidth usage and picture quality, making MStar a competitive player in the STB SoC segment and demonstrating the market demand for efficient video processing technologies.
Strategic Digital TV SOC Market Market Outlook
The Digital TV SoC market holds immense potential for future growth, fueled by continuous technological innovation, expanding consumer demand for high-resolution displays, and the rise of connected TVs. Strategic opportunities lie in developing energy-efficient SoCs, integrating advanced AI-powered features, and expanding into emerging markets. Focus on providing cost-effective solutions while maintaining high performance is crucial for success. The market is poised for further consolidation, with strategic partnerships and acquisitions shaping the competitive landscape. Companies focusing on cutting-edge technologies and effective market penetration strategies are expected to achieve significant growth.
Digital TV SOC Market Segmentation
-
1. Application
- 1.1. LCD
- 1.2. LED
- 1.3. OLED
- 1.4. QLED
-
2. End User
- 2.1. Residential
- 2.2. Commercial
- 2.3. Other End Users
Digital TV SOC Market Segmentation By Geography
- 1. North America
- 2. Europe
- 3. Asia
- 4. Australia and New Zealand
- 5. Latin America
- 6. Middle East and Africa
Digital TV SOC Market Regional Market Share
Geographic Coverage of Digital TV SOC Market
Digital TV SOC Market REPORT HIGHLIGHTS
| Aspects | Details |
|---|---|
| Study Period | 2020-2034 |
| Base Year | 2025 |
| Estimated Year | 2026 |
| Forecast Period | 2026-2034 |
| Historical Period | 2020-2025 |
| Growth Rate | CAGR of 12.90% from 2020-2034 |
| Segmentation |
|
Table of Contents
- 1. Introduction
- 1.1. Research Scope
- 1.2. Market Segmentation
- 1.3. Research Objective
- 1.4. Definitions and Assumptions
- 2. Executive Summary
- 2.1. Market Snapshot
- 3. Market Dynamics
- 3.1. Market Drivers
- 3.2. Market Restrains
- 3.3. Market Trends
- 3.4. Market Opportunities
- 4. Market Factor Analysis
- 4.1. Porters Five Forces
- 4.1.1. Bargaining Power of Suppliers
- 4.1.2. Bargaining Power of Buyers
- 4.1.3. Threat of New Entrants
- 4.1.4. Threat of Substitutes
- 4.1.5. Competitive Rivalry
- 4.2. PESTEL analysis
- 4.3. BCG Analysis
- 4.3.1. Stars (High Growth, High Market Share)
- 4.3.2. Cash Cows (Low Growth, High Market Share)
- 4.3.3. Question Mark (High Growth, Low Market Share)
- 4.3.4. Dogs (Low Growth, Low Market Share)
- 4.4. Ansoff Matrix Analysis
- 4.5. Supply Chain Analysis
- 4.6. Regulatory Landscape
- 4.7. Current Market Potential and Opportunity Assessment (TAM–SAM–SOM Framework)
- 4.8. PMV Analyst Note
- 4.1. Porters Five Forces
- 5. Market Analysis, Insights and Forecast 2021-2033
- 5.1. Market Analysis, Insights and Forecast - by Application
- 5.1.1. LCD
- 5.1.2. LED
- 5.1.3. OLED
- 5.1.4. QLED
- 5.2. Market Analysis, Insights and Forecast - by End User
- 5.2.1. Residential
- 5.2.2. Commercial
- 5.2.3. Other End Users
- 5.3. Market Analysis, Insights and Forecast - by Region
- 5.3.1. North America
- 5.3.2. Europe
- 5.3.3. Asia
- 5.3.4. Australia and New Zealand
- 5.3.5. Latin America
- 5.3.6. Middle East and Africa
- 5.1. Market Analysis, Insights and Forecast - by Application
- 6. Global Digital TV SOC Market Analysis, Insights and Forecast, 2021-2033
- 6.1. Market Analysis, Insights and Forecast - by Application
- 6.1.1. LCD
- 6.1.2. LED
- 6.1.3. OLED
- 6.1.4. QLED
- 6.2. Market Analysis, Insights and Forecast - by End User
- 6.2.1. Residential
- 6.2.2. Commercial
- 6.2.3. Other End Users
- 6.1. Market Analysis, Insights and Forecast - by Application
- 7. North America Digital TV SOC Market Analysis, Insights and Forecast, 2020-2032
- 7.1. Market Analysis, Insights and Forecast - by Application
- 7.1.1. LCD
- 7.1.2. LED
- 7.1.3. OLED
- 7.1.4. QLED
- 7.2. Market Analysis, Insights and Forecast - by End User
- 7.2.1. Residential
- 7.2.2. Commercial
- 7.2.3. Other End Users
- 7.1. Market Analysis, Insights and Forecast - by Application
- 8. Europe Digital TV SOC Market Analysis, Insights and Forecast, 2020-2032
- 8.1. Market Analysis, Insights and Forecast - by Application
- 8.1.1. LCD
- 8.1.2. LED
- 8.1.3. OLED
- 8.1.4. QLED
- 8.2. Market Analysis, Insights and Forecast - by End User
- 8.2.1. Residential
- 8.2.2. Commercial
- 8.2.3. Other End Users
- 8.1. Market Analysis, Insights and Forecast - by Application
- 9. Asia Digital TV SOC Market Analysis, Insights and Forecast, 2020-2032
- 9.1. Market Analysis, Insights and Forecast - by Application
- 9.1.1. LCD
- 9.1.2. LED
- 9.1.3. OLED
- 9.1.4. QLED
- 9.2. Market Analysis, Insights and Forecast - by End User
- 9.2.1. Residential
- 9.2.2. Commercial
- 9.2.3. Other End Users
- 9.1. Market Analysis, Insights and Forecast - by Application
- 10. Australia and New Zealand Digital TV SOC Market Analysis, Insights and Forecast, 2020-2032
- 10.1. Market Analysis, Insights and Forecast - by Application
- 10.1.1. LCD
- 10.1.2. LED
- 10.1.3. OLED
- 10.1.4. QLED
- 10.2. Market Analysis, Insights and Forecast - by End User
- 10.2.1. Residential
- 10.2.2. Commercial
- 10.2.3. Other End Users
- 10.1. Market Analysis, Insights and Forecast - by Application
- 11. Latin America Digital TV SOC Market Analysis, Insights and Forecast, 2020-2032
- 11.1. Market Analysis, Insights and Forecast - by Application
- 11.1.1. LCD
- 11.1.2. LED
- 11.1.3. OLED
- 11.1.4. QLED
- 11.2. Market Analysis, Insights and Forecast - by End User
- 11.2.1. Residential
- 11.2.2. Commercial
- 11.2.3. Other End Users
- 11.1. Market Analysis, Insights and Forecast - by Application
- 12. Middle East and Africa Digital TV SOC Market Analysis, Insights and Forecast, 2020-2032
- 12.1. Market Analysis, Insights and Forecast - by Application
- 12.1.1. LCD
- 12.1.2. LED
- 12.1.3. OLED
- 12.1.4. QLED
- 12.2. Market Analysis, Insights and Forecast - by End User
- 12.2.1. Residential
- 12.2.2. Commercial
- 12.2.3. Other End Users
- 12.1. Market Analysis, Insights and Forecast - by Application
- 13. Competitive Analysis
- 13.1. Company Profiles
- 13.1.1 Broadcom Inc
- 13.1.1.1. Company Overview
- 13.1.1.2. Products
- 13.1.1.3. Company Financials
- 13.1.1.4. SWOT Analysis
- 13.1.2 MediaTek Inc
- 13.1.2.1. Company Overview
- 13.1.2.2. Products
- 13.1.2.3. Company Financials
- 13.1.2.4. SWOT Analysis
- 13.1.3 Intel Corporation
- 13.1.3.1. Company Overview
- 13.1.3.2. Products
- 13.1.3.3. Company Financials
- 13.1.3.4. SWOT Analysis
- 13.1.4 Qualcomm Technologies Inc
- 13.1.4.1. Company Overview
- 13.1.4.2. Products
- 13.1.4.3. Company Financials
- 13.1.4.4. SWOT Analysis
- 13.1.5 Samsung Electronics Co Ltd
- 13.1.5.1. Company Overview
- 13.1.5.2. Products
- 13.1.5.3. Company Financials
- 13.1.5.4. SWOT Analysis
- 13.1.6 STMicroelectronics NV
- 13.1.6.1. Company Overview
- 13.1.6.2. Products
- 13.1.6.3. Company Financials
- 13.1.6.4. SWOT Analysis
- 13.1.7 Novatek Microelectronics Corp
- 13.1.7.1. Company Overview
- 13.1.7.2. Products
- 13.1.7.3. Company Financials
- 13.1.7.4. SWOT Analysis
- 13.1.8 MStar Semiconductor Inc
- 13.1.8.1. Company Overview
- 13.1.8.2. Products
- 13.1.8.3. Company Financials
- 13.1.8.4. SWOT Analysis
- 13.1.9 LG Electronics Inc
- 13.1.9.1. Company Overview
- 13.1.9.2. Products
- 13.1.9.3. Company Financials
- 13.1.9.4. SWOT Analysis
- 13.1.10 HiSilicon
- 13.1.10.1. Company Overview
- 13.1.10.2. Products
- 13.1.10.3. Company Financials
- 13.1.10.4. SWOT Analysis
- 13.1.11 NXP Semiconductors*List Not Exhaustive
- 13.1.11.1. Company Overview
- 13.1.11.2. Products
- 13.1.11.3. Company Financials
- 13.1.11.4. SWOT Analysis
- 13.1.1 Broadcom Inc
- 13.2. Market Entropy
- 13.2.1 Company's Key Areas Served
- 13.2.2 Recent Developments
- 13.3. Company Market Share Analysis 2025
- 13.3.1 Top 5 Companies Market Share Analysis
- 13.3.2 Top 3 Companies Market Share Analysis
- 13.4. List of Potential Customers
- 14. Research Methodology
List of Figures
- Figure 1: Global Digital TV SOC Market Revenue Breakdown (Million, %) by Region 2025 & 2033
- Figure 2: Global Digital TV SOC Market Volume Breakdown (Billion, %) by Region 2025 & 2033
- Figure 3: North America Digital TV SOC Market Revenue (Million), by Application 2025 & 2033
- Figure 4: North America Digital TV SOC Market Volume (Billion), by Application 2025 & 2033
- Figure 5: North America Digital TV SOC Market Revenue Share (%), by Application 2025 & 2033
- Figure 6: North America Digital TV SOC Market Volume Share (%), by Application 2025 & 2033
- Figure 7: North America Digital TV SOC Market Revenue (Million), by End User 2025 & 2033
- Figure 8: North America Digital TV SOC Market Volume (Billion), by End User 2025 & 2033
- Figure 9: North America Digital TV SOC Market Revenue Share (%), by End User 2025 & 2033
- Figure 10: North America Digital TV SOC Market Volume Share (%), by End User 2025 & 2033
- Figure 11: North America Digital TV SOC Market Revenue (Million), by Country 2025 & 2033
- Figure 12: North America Digital TV SOC Market Volume (Billion), by Country 2025 & 2033
- Figure 13: North America Digital TV SOC Market Revenue Share (%), by Country 2025 & 2033
- Figure 14: North America Digital TV SOC Market Volume Share (%), by Country 2025 & 2033
- Figure 15: Europe Digital TV SOC Market Revenue (Million), by Application 2025 & 2033
- Figure 16: Europe Digital TV SOC Market Volume (Billion), by Application 2025 & 2033
- Figure 17: Europe Digital TV SOC Market Revenue Share (%), by Application 2025 & 2033
- Figure 18: Europe Digital TV SOC Market Volume Share (%), by Application 2025 & 2033
- Figure 19: Europe Digital TV SOC Market Revenue (Million), by End User 2025 & 2033
- Figure 20: Europe Digital TV SOC Market Volume (Billion), by End User 2025 & 2033
- Figure 21: Europe Digital TV SOC Market Revenue Share (%), by End User 2025 & 2033
- Figure 22: Europe Digital TV SOC Market Volume Share (%), by End User 2025 & 2033
- Figure 23: Europe Digital TV SOC Market Revenue (Million), by Country 2025 & 2033
- Figure 24: Europe Digital TV SOC Market Volume (Billion), by Country 2025 & 2033
- Figure 25: Europe Digital TV SOC Market Revenue Share (%), by Country 2025 & 2033
- Figure 26: Europe Digital TV SOC Market Volume Share (%), by Country 2025 & 2033
- Figure 27: Asia Digital TV SOC Market Revenue (Million), by Application 2025 & 2033
- Figure 28: Asia Digital TV SOC Market Volume (Billion), by Application 2025 & 2033
- Figure 29: Asia Digital TV SOC Market Revenue Share (%), by Application 2025 & 2033
- Figure 30: Asia Digital TV SOC Market Volume Share (%), by Application 2025 & 2033
- Figure 31: Asia Digital TV SOC Market Revenue (Million), by End User 2025 & 2033
- Figure 32: Asia Digital TV SOC Market Volume (Billion), by End User 2025 & 2033
- Figure 33: Asia Digital TV SOC Market Revenue Share (%), by End User 2025 & 2033
- Figure 34: Asia Digital TV SOC Market Volume Share (%), by End User 2025 & 2033
- Figure 35: Asia Digital TV SOC Market Revenue (Million), by Country 2025 & 2033
- Figure 36: Asia Digital TV SOC Market Volume (Billion), by Country 2025 & 2033
- Figure 37: Asia Digital TV SOC Market Revenue Share (%), by Country 2025 & 2033
- Figure 38: Asia Digital TV SOC Market Volume Share (%), by Country 2025 & 2033
- Figure 39: Australia and New Zealand Digital TV SOC Market Revenue (Million), by Application 2025 & 2033
- Figure 40: Australia and New Zealand Digital TV SOC Market Volume (Billion), by Application 2025 & 2033
- Figure 41: Australia and New Zealand Digital TV SOC Market Revenue Share (%), by Application 2025 & 2033
- Figure 42: Australia and New Zealand Digital TV SOC Market Volume Share (%), by Application 2025 & 2033
- Figure 43: Australia and New Zealand Digital TV SOC Market Revenue (Million), by End User 2025 & 2033
- Figure 44: Australia and New Zealand Digital TV SOC Market Volume (Billion), by End User 2025 & 2033
- Figure 45: Australia and New Zealand Digital TV SOC Market Revenue Share (%), by End User 2025 & 2033
- Figure 46: Australia and New Zealand Digital TV SOC Market Volume Share (%), by End User 2025 & 2033
- Figure 47: Australia and New Zealand Digital TV SOC Market Revenue (Million), by Country 2025 & 2033
- Figure 48: Australia and New Zealand Digital TV SOC Market Volume (Billion), by Country 2025 & 2033
- Figure 49: Australia and New Zealand Digital TV SOC Market Revenue Share (%), by Country 2025 & 2033
- Figure 50: Australia and New Zealand Digital TV SOC Market Volume Share (%), by Country 2025 & 2033
- Figure 51: Latin America Digital TV SOC Market Revenue (Million), by Application 2025 & 2033
- Figure 52: Latin America Digital TV SOC Market Volume (Billion), by Application 2025 & 2033
- Figure 53: Latin America Digital TV SOC Market Revenue Share (%), by Application 2025 & 2033
- Figure 54: Latin America Digital TV SOC Market Volume Share (%), by Application 2025 & 2033
- Figure 55: Latin America Digital TV SOC Market Revenue (Million), by End User 2025 & 2033
- Figure 56: Latin America Digital TV SOC Market Volume (Billion), by End User 2025 & 2033
- Figure 57: Latin America Digital TV SOC Market Revenue Share (%), by End User 2025 & 2033
- Figure 58: Latin America Digital TV SOC Market Volume Share (%), by End User 2025 & 2033
- Figure 59: Latin America Digital TV SOC Market Revenue (Million), by Country 2025 & 2033
- Figure 60: Latin America Digital TV SOC Market Volume (Billion), by Country 2025 & 2033
- Figure 61: Latin America Digital TV SOC Market Revenue Share (%), by Country 2025 & 2033
- Figure 62: Latin America Digital TV SOC Market Volume Share (%), by Country 2025 & 2033
- Figure 63: Middle East and Africa Digital TV SOC Market Revenue (Million), by Application 2025 & 2033
- Figure 64: Middle East and Africa Digital TV SOC Market Volume (Billion), by Application 2025 & 2033
- Figure 65: Middle East and Africa Digital TV SOC Market Revenue Share (%), by Application 2025 & 2033
- Figure 66: Middle East and Africa Digital TV SOC Market Volume Share (%), by Application 2025 & 2033
- Figure 67: Middle East and Africa Digital TV SOC Market Revenue (Million), by End User 2025 & 2033
- Figure 68: Middle East and Africa Digital TV SOC Market Volume (Billion), by End User 2025 & 2033
- Figure 69: Middle East and Africa Digital TV SOC Market Revenue Share (%), by End User 2025 & 2033
- Figure 70: Middle East and Africa Digital TV SOC Market Volume Share (%), by End User 2025 & 2033
- Figure 71: Middle East and Africa Digital TV SOC Market Revenue (Million), by Country 2025 & 2033
- Figure 72: Middle East and Africa Digital TV SOC Market Volume (Billion), by Country 2025 & 2033
- Figure 73: Middle East and Africa Digital TV SOC Market Revenue Share (%), by Country 2025 & 2033
- Figure 74: Middle East and Africa Digital TV SOC Market Volume Share (%), by Country 2025 & 2033
List of Tables
- Table 1: Global Digital TV SOC Market Revenue Million Forecast, by Application 2020 & 2033
- Table 2: Global Digital TV SOC Market Volume Billion Forecast, by Application 2020 & 2033
- Table 3: Global Digital TV SOC Market Revenue Million Forecast, by End User 2020 & 2033
- Table 4: Global Digital TV SOC Market Volume Billion Forecast, by End User 2020 & 2033
- Table 5: Global Digital TV SOC Market Revenue Million Forecast, by Region 2020 & 2033
- Table 6: Global Digital TV SOC Market Volume Billion Forecast, by Region 2020 & 2033
- Table 7: Global Digital TV SOC Market Revenue Million Forecast, by Application 2020 & 2033
- Table 8: Global Digital TV SOC Market Volume Billion Forecast, by Application 2020 & 2033
- Table 9: Global Digital TV SOC Market Revenue Million Forecast, by End User 2020 & 2033
- Table 10: Global Digital TV SOC Market Volume Billion Forecast, by End User 2020 & 2033
- Table 11: Global Digital TV SOC Market Revenue Million Forecast, by Country 2020 & 2033
- Table 12: Global Digital TV SOC Market Volume Billion Forecast, by Country 2020 & 2033
- Table 13: Global Digital TV SOC Market Revenue Million Forecast, by Application 2020 & 2033
- Table 14: Global Digital TV SOC Market Volume Billion Forecast, by Application 2020 & 2033
- Table 15: Global Digital TV SOC Market Revenue Million Forecast, by End User 2020 & 2033
- Table 16: Global Digital TV SOC Market Volume Billion Forecast, by End User 2020 & 2033
- Table 17: Global Digital TV SOC Market Revenue Million Forecast, by Country 2020 & 2033
- Table 18: Global Digital TV SOC Market Volume Billion Forecast, by Country 2020 & 2033
- Table 19: Global Digital TV SOC Market Revenue Million Forecast, by Application 2020 & 2033
- Table 20: Global Digital TV SOC Market Volume Billion Forecast, by Application 2020 & 2033
- Table 21: Global Digital TV SOC Market Revenue Million Forecast, by End User 2020 & 2033
- Table 22: Global Digital TV SOC Market Volume Billion Forecast, by End User 2020 & 2033
- Table 23: Global Digital TV SOC Market Revenue Million Forecast, by Country 2020 & 2033
- Table 24: Global Digital TV SOC Market Volume Billion Forecast, by Country 2020 & 2033
- Table 25: Global Digital TV SOC Market Revenue Million Forecast, by Application 2020 & 2033
- Table 26: Global Digital TV SOC Market Volume Billion Forecast, by Application 2020 & 2033
- Table 27: Global Digital TV SOC Market Revenue Million Forecast, by End User 2020 & 2033
- Table 28: Global Digital TV SOC Market Volume Billion Forecast, by End User 2020 & 2033
- Table 29: Global Digital TV SOC Market Revenue Million Forecast, by Country 2020 & 2033
- Table 30: Global Digital TV SOC Market Volume Billion Forecast, by Country 2020 & 2033
- Table 31: Global Digital TV SOC Market Revenue Million Forecast, by Application 2020 & 2033
- Table 32: Global Digital TV SOC Market Volume Billion Forecast, by Application 2020 & 2033
- Table 33: Global Digital TV SOC Market Revenue Million Forecast, by End User 2020 & 2033
- Table 34: Global Digital TV SOC Market Volume Billion Forecast, by End User 2020 & 2033
- Table 35: Global Digital TV SOC Market Revenue Million Forecast, by Country 2020 & 2033
- Table 36: Global Digital TV SOC Market Volume Billion Forecast, by Country 2020 & 2033
- Table 37: Global Digital TV SOC Market Revenue Million Forecast, by Application 2020 & 2033
- Table 38: Global Digital TV SOC Market Volume Billion Forecast, by Application 2020 & 2033
- Table 39: Global Digital TV SOC Market Revenue Million Forecast, by End User 2020 & 2033
- Table 40: Global Digital TV SOC Market Volume Billion Forecast, by End User 2020 & 2033
- Table 41: Global Digital TV SOC Market Revenue Million Forecast, by Country 2020 & 2033
- Table 42: Global Digital TV SOC Market Volume Billion Forecast, by Country 2020 & 2033
Frequently Asked Questions
1. What is the projected Compound Annual Growth Rate (CAGR) of the Digital TV SOC Market?
The projected CAGR is approximately 12.90%.
2. Which companies are prominent players in the Digital TV SOC Market?
Key companies in the market include Broadcom Inc, MediaTek Inc, Intel Corporation, Qualcomm Technologies Inc, Samsung Electronics Co Ltd, STMicroelectronics NV, Novatek Microelectronics Corp, MStar Semiconductor Inc, LG Electronics Inc, HiSilicon, NXP Semiconductors*List Not Exhaustive.
3. What are the main segments of the Digital TV SOC Market?
The market segments include Application, End User.
4. Can you provide details about the market size?
The market size is estimated to be USD 11.13 Million as of 2022.
5. What are some drivers contributing to market growth?
Increasing Demand for Smart TVs Will Drive the Market Growth; Rising Consumer Demand for High-definition and Ultra-high-definition (UHD) Content.
6. What are the notable trends driving market growth?
The Commercial Segment is Expected to Hold a Significant Market Share.
7. Are there any restraints impacting market growth?
Increasing Demand for Smart TVs Will Drive the Market Growth; Rising Consumer Demand for High-definition and Ultra-high-definition (UHD) Content.
8. Can you provide examples of recent developments in the market?
May 2024: MediaTek announced its Dimensity 9300+ system-on-chip (SoC), representing the company's newest advancement in processors designed for premium mobile applications. This chipset is equipped with 18 MB of L3 cache and system-level cache (SLC), and it is compatible with the latest LPDDR5T memory, achieving speeds of up to 9,600 Mbps, as well as UFS 4.0 storage. These capabilities enable the device to execute high-speed operations and multitask efficiently without sacrificing performance.January 2024: Videocon d2h, a direct-to-home (DTH) service provider, partnered with MStar Semiconductor. Under this collaboration, MStar Semiconductor is expected to supply its high-efficiency video codec (HEVC) H.265 system-on-chip (SoC) for Videocon's high-definition set-top boxes (STBs). MStar Semiconductor effectively integrated HEVC technology into its HD solutions, significantly optimizing bandwidth usage while delivering superior picture quality. This partnership enables operators and STB original equipment manufacturers (OEMs) to lower their development expenses and accelerate their time to market, thereby addressing the demands of the Indian market with the MStar HEVC-capable set-top box SoC solution.
9. What pricing options are available for accessing the report?
Pricing options include single-user, multi-user, and enterprise licenses priced at USD 4750, USD 5250, and USD 8750 respectively.
10. Is the market size provided in terms of value or volume?
The market size is provided in terms of value, measured in Million and volume, measured in Billion.
11. Are there any specific market keywords associated with the report?
Yes, the market keyword associated with the report is "Digital TV SOC Market," which aids in identifying and referencing the specific market segment covered.
12. How do I determine which pricing option suits my needs best?
The pricing options vary based on user requirements and access needs. Individual users may opt for single-user licenses, while businesses requiring broader access may choose multi-user or enterprise licenses for cost-effective access to the report.
13. Are there any additional resources or data provided in the Digital TV SOC Market report?
While the report offers comprehensive insights, it's advisable to review the specific contents or supplementary materials provided to ascertain if additional resources or data are available.
14. How can I stay updated on further developments or reports in the Digital TV SOC Market?
To stay informed about further developments, trends, and reports in the Digital TV SOC Market, consider subscribing to industry newsletters, following relevant companies and organizations, or regularly checking reputable industry news sources and publications.
Methodology
Step 1 - Identification of Relevant Samples Size from Population Database


Step 2 - Approaches for Defining Global Market Size (Value, Volume* & Price*)

Note*: In applicable scenarios
Step 3 - Data Sources
Primary Research
- Web Analytics
- Survey Reports
- Research Institute
- Latest Research Reports
- Opinion Leaders
Secondary Research
- Annual Reports
- White Paper
- Latest Press Release
- Industry Association
- Paid Database
- Investor Presentations

Step 4 - Data Triangulation
Involves using different sources of information in order to increase the validity of a study
These sources are likely to be stakeholders in a program - participants, other researchers, program staff, other community members, and so on.
Then we put all data in single framework & apply various statistical tools to find out the dynamic on the market.
During the analysis stage, feedback from the stakeholder groups would be compared to determine areas of agreement as well as areas of divergence