
Key Insights
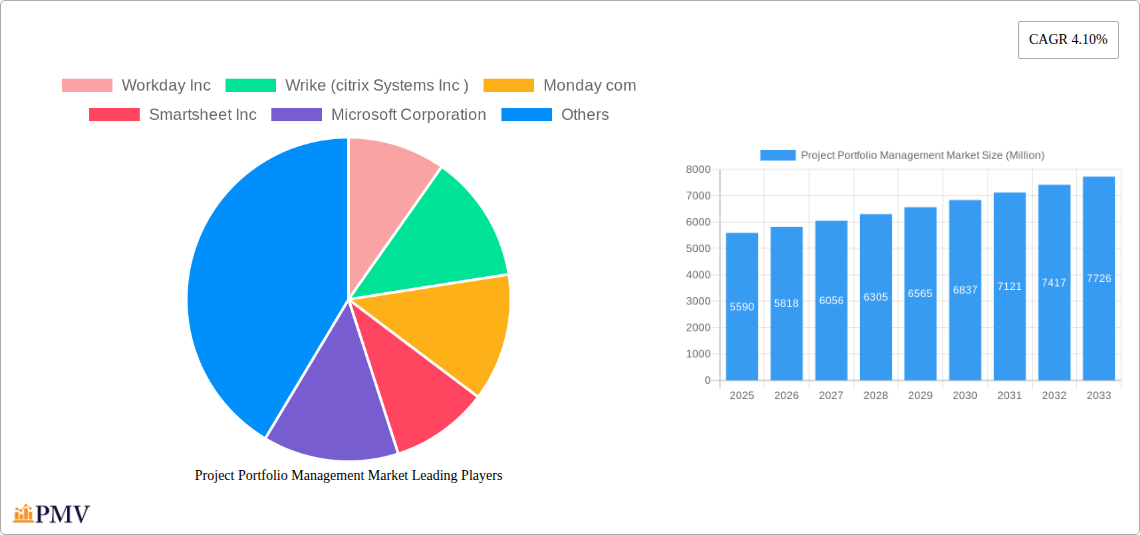
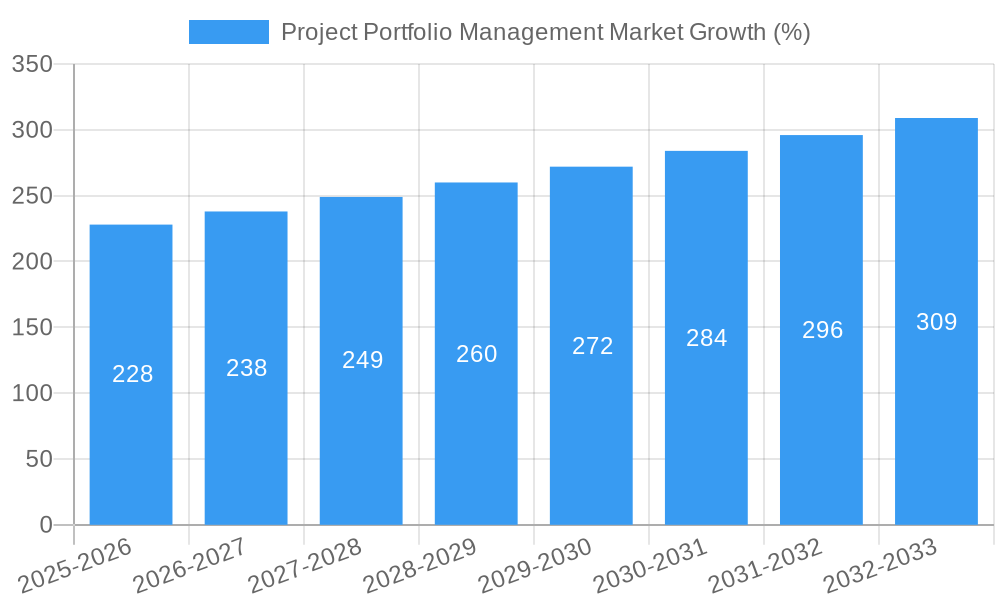
The Project Portfolio Management (PPM) market is experiencing robust growth, projected to reach $5.59 billion in 2025 and maintain a Compound Annual Growth Rate (CAGR) of 4.10% from 2025 to 2033. This expansion is fueled by several key drivers. Increasing organizational complexity necessitates sophisticated tools for managing diverse projects and resources effectively. The rise of cloud-based PPM solutions offers scalability, accessibility, and reduced IT infrastructure costs, driving market adoption across various sectors. Furthermore, the growing emphasis on data-driven decision-making within project management, coupled with the need for enhanced collaboration and real-time visibility, further strengthens market demand. The increasing adoption of agile methodologies and the need for improved project predictability also contributes to the growth. While the market faces some restraints, such as the initial investment costs associated with implementing PPM software and the complexity of integrating with existing systems, these challenges are outweighed by the significant benefits provided by effective project portfolio management.
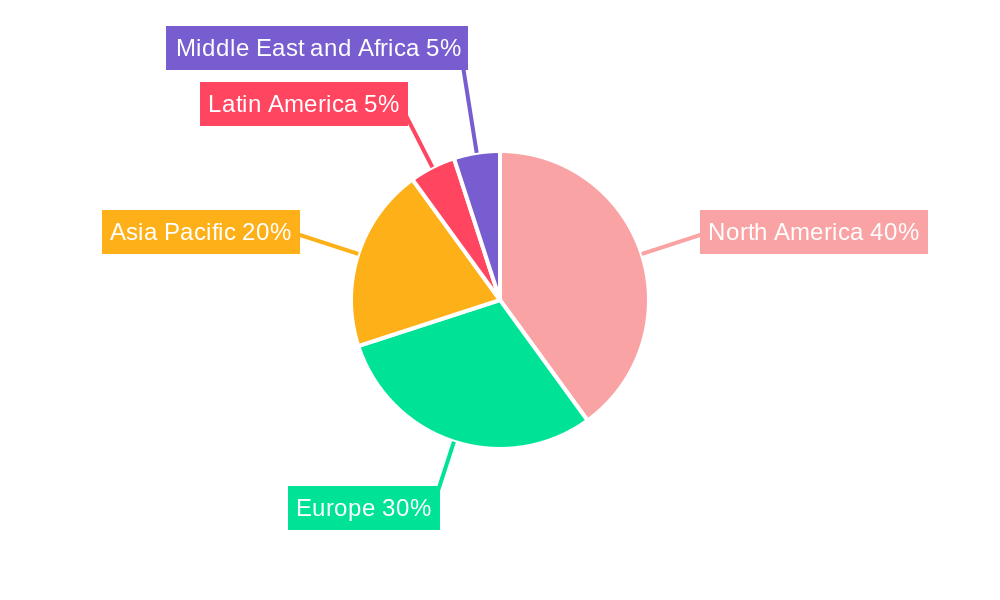
The market is segmented by deployment type (cloud and on-premise), type (solutions and services), and end-user vertical (IT and Telecom, Healthcare and Life Sciences, Manufacturing, Construction, Retail and Consumer Goods, BFSI, and others). The cloud segment is experiencing the fastest growth due to its inherent advantages. Solution providers dominate the market, offering comprehensive platforms for project planning, execution, and tracking. North America currently holds a significant market share, driven by early adoption of PPM technologies and a well-established IT infrastructure. However, regions like Asia-Pacific are experiencing rapid growth due to increasing digitalization and infrastructure development. Key players in the market include Workday, Wrike, Monday.com, Smartsheet, Microsoft, Upland Software, Oracle, Atlassian, Asana, ServiceNow, Planview, and SAP, constantly innovating to improve their offerings and meet evolving market demands. The competitive landscape is dynamic, characterized by mergers, acquisitions, and the emergence of new niche players.
Project Portfolio Management Market: A Comprehensive Report (2019-2033)
This in-depth report provides a comprehensive analysis of the Project Portfolio Management (PPM) market, offering invaluable insights for businesses, investors, and industry stakeholders. With a meticulous examination of market dynamics, competitive landscapes, and future growth projections, this report serves as a crucial resource for navigating the complexities of this rapidly evolving sector. The study period spans from 2019 to 2033, with 2025 serving as both the base and estimated year. The forecast period extends from 2025 to 2033, while the historical period covers 2019-2024.
Project Portfolio Management Market Structure & Competitive Dynamics
The Project Portfolio Management market exhibits a moderately concentrated structure, with several key players vying for market share. The competitive landscape is characterized by a dynamic interplay of established giants like Microsoft Corporation and SAP SE, alongside agile newcomers and specialized providers. Innovation ecosystems are thriving, fueled by continuous advancements in cloud computing, AI, and automation technologies. Regulatory frameworks, particularly regarding data privacy and security, significantly influence market strategies. Product substitutes, such as simpler project management tools, pose a competitive threat, particularly for less comprehensive PPM solutions. End-user trends, such as the growing adoption of agile methodologies and the increasing demand for integrated solutions, are driving market evolution. Mergers and acquisitions (M&A) play a significant role in shaping market consolidation. Recent M&A activity, while not publicly disclosed in full detail, suggests a xx Million in deal value across the market in the last 3 years. Market share data for key players are as follows (estimated 2025):
- Microsoft Corporation: xx%
- Workday Inc: xx%
- Smartsheet Inc: xx%
- Oracle Corporation: xx%
- Other Players: xx%
Project Portfolio Management Market Industry Trends & Insights
The Project Portfolio Management market is experiencing robust growth, driven by the increasing need for organizations to effectively manage complex projects and portfolios. The Compound Annual Growth Rate (CAGR) during the forecast period (2025-2033) is projected to be xx%. This growth is fueled by several key factors: the rising adoption of cloud-based PPM solutions, increasing demand for agile project management methodologies, growing focus on improving resource allocation and utilization, and the need for better risk management and compliance capabilities. Technological disruptions, such as the rise of AI-powered project management tools and the increasing integration of PPM solutions with other enterprise applications, are reshaping the market landscape. Consumer preferences are shifting towards user-friendly, intuitive, and highly customizable PPM solutions. Market penetration of cloud-based PPM solutions is rapidly increasing, driven by their scalability, cost-effectiveness, and accessibility. Competitive dynamics remain intense, with companies continuously innovating to offer superior products and services.
Dominant Markets & Segments in Project Portfolio Management Market
The North American region currently holds the largest market share in the Project Portfolio Management market, driven by high technological adoption, robust economic growth, and a strong presence of major technology companies. However, the Asia-Pacific region is projected to witness the fastest growth during the forecast period due to rapid digital transformation and increasing infrastructure investments.
Key Drivers for Regional Dominance:
- North America: Mature IT infrastructure, high adoption of cloud technologies, strong regulatory frameworks.
- Asia-Pacific: Rapid economic growth, increasing government investments in digital infrastructure, growing adoption of agile methodologies.
- Europe: Growing adoption of cloud-based solutions, strong emphasis on data privacy and security regulations.
Segment Dominance Analysis:
- By Deployment Type: The cloud segment dominates the market due to its scalability, flexibility, and cost-effectiveness. On-premise deployments still hold a significant share, particularly in industries with stringent data security requirements.
- By Type: The solutions segment holds the larger market share, reflecting the increasing demand for comprehensive PPM platforms. The services segment is also experiencing considerable growth driven by the need for customized implementations, integration support, and ongoing maintenance.
- By End-user Verticals: The IT and Telecom sector is currently the largest end-user vertical due to high project complexity and the need for efficient resource management. However, strong growth is expected in other sectors like Healthcare & Lifesciences, Manufacturing and BFSI due to growing adoption of PPM for streamlined operations and better outcomes.
Project Portfolio Management Market Product Innovations
Recent product innovations in the PPM market emphasize integration with AI and machine learning for improved predictive analytics, enhanced automation capabilities for streamlined workflows, and improved user interfaces for a more intuitive experience. New applications are emerging in areas like risk management, portfolio optimization, and resource allocation. The key competitive advantage lies in offering solutions that seamlessly integrate with existing enterprise systems, providing a holistic view of project performance and enabling data-driven decision-making.
Report Segmentation & Scope
This report segments the Project Portfolio Management market across various parameters:
- By Deployment Type: Cloud and On-premise – providing market size and growth projections for each segment, along with an analysis of competitive dynamics.
- By Type: Solutions and Services – detailing the market size and growth forecasts for each segment, considering the competitive intensity.
- By End-user Verticals: IT and Telecom, Healthcare and Lifesciences, Manufacturing, Construction, Retail and Consumer Goods, BFSI, and Other End-user Verticals – this segment outlines the market size and growth projections for each sector. The competitive landscape within each vertical is also assessed.
Key Drivers of Project Portfolio Management Market Growth
The Project Portfolio Management market is propelled by several key factors: the rising complexity of projects, the need for better resource allocation, increased demand for real-time project visibility, and the growing adoption of agile methodologies. Technological advancements, particularly in cloud computing and AI, are further accelerating market growth. Favorable government regulations promoting digital transformation in various sectors also contribute to the market's expansion.
Challenges in the Project Portfolio Management Market Sector
The Project Portfolio Management market faces several challenges including the high initial investment costs associated with implementing comprehensive PPM solutions, the complexity of integrating PPM software with existing enterprise systems, and the need for specialized skills to effectively manage and utilize these systems. Competition from simpler, less comprehensive project management tools also poses a challenge for some PPM vendors. Data security and privacy concerns in some regulated industries also create adoption barriers.
Leading Players in the Project Portfolio Management Market Market
- Workday Inc
- Wrike (Citrix Systems Inc)
- Monday.com
- Smartsheet Inc
- Microsoft Corporation
- Upland Software Inc
- Oracle Corporation
- Atlassian Corporation Plc
- Asana Inc
- Servicenow Inc
- Planview Inc (changepoint)
- SAP SE
Key Developments in Project Portfolio Management Market Sector
- May 2022: Proggio secured $7 Million in Series A funding to expand its US operations and enhance its enterprise solution.
- May 2022: Onepoint Projects GmbH launched a new version of ONEPOINT Projects, integrating support for the Scaled Agile Framework.
- March 2022: ServiceNow released its Now Platform San Diego, featuring improved visual design and enhanced RPA capabilities.
Strategic Project Portfolio Management Market Outlook
The Project Portfolio Management market is poised for continued growth, driven by increasing adoption of cloud-based solutions, the rising demand for agile methodologies, and the growing need for better resource management. Strategic opportunities lie in developing AI-powered PPM solutions, integrating with other enterprise applications, and focusing on specific industry verticals. The market's future is bright, with significant potential for innovation and expansion.
Project Portfolio Management Market Segmentation
-
1. Deployment Type
- 1.1. Cloud
- 1.2. On-premise
-
2. Type
- 2.1. Solution
- 2.2. Services
-
3. End-user Verticals
- 3.1. IT And Telecom
- 3.2. Healthcare And Lifesciences
- 3.3. Manufacturing
- 3.4. Construction
- 3.5. Retail And Consumer Goods
- 3.6. BFSI
- 3.7. Other End-user Verticals
Project Portfolio Management Market Segmentation By Geography
- 1. North America
- 2. Europe
- 3. Asia
- 4. Latin America
- 5. Middle East and Africa
- 6. Australia and New Zealand
Project Portfolio Management Market REPORT HIGHLIGHTS
| Aspects | Details |
|---|---|
| Study Period | 2019-2033 |
| Base Year | 2024 |
| Estimated Year | 2025 |
| Forecast Period | 2025-2033 |
| Historical Period | 2019-2024 |
| Growth Rate | CAGR of 4.10% from 2019-2033 |
| Segmentation |
|
Table of Contents
- 1. Introduction
- 1.1. Research Scope
- 1.2. Market Segmentation
- 1.3. Research Methodology
- 1.4. Definitions and Assumptions
- 2. Executive Summary
- 2.1. Introduction
- 3. Market Dynamics
- 3.1. Introduction
- 3.2. Market Drivers
- 3.2.1 Recent Changes In Work Culture and Move toward Remote Teams has Made It Imperative to Develop A Centralized View of Task Management and Resource Utilization; Long-term Cost Benefits Enabled By Timely Use of Planning & Scheduling Tools
- 3.2.2 Coupled With Growing Demand For Cloud-based Ppm; Integration Of Several Allied Modules And Collaborations Have Increased The Span of PPM to Cover The Entire Workspace Related Tasks
- 3.3. Market Restrains
- 3.3.1. Evolving Market Regulations
- 3.4. Market Trends
- 3.4.1. Recent Changes In Work Culture And Move Towards Remote Teams to Drive the Market
- 4. Market Factor Analysis
- 4.1. Porters Five Forces
- 4.2. Supply/Value Chain
- 4.3. PESTEL analysis
- 4.4. Market Entropy
- 4.5. Patent/Trademark Analysis
- 5. Global Project Portfolio Management Market Analysis, Insights and Forecast, 2019-2031
- 5.1. Market Analysis, Insights and Forecast - by Deployment Type
- 5.1.1. Cloud
- 5.1.2. On-premise
- 5.2. Market Analysis, Insights and Forecast - by Type
- 5.2.1. Solution
- 5.2.2. Services
- 5.3. Market Analysis, Insights and Forecast - by End-user Verticals
- 5.3.1. IT And Telecom
- 5.3.2. Healthcare And Lifesciences
- 5.3.3. Manufacturing
- 5.3.4. Construction
- 5.3.5. Retail And Consumer Goods
- 5.3.6. BFSI
- 5.3.7. Other End-user Verticals
- 5.4. Market Analysis, Insights and Forecast - by Region
- 5.4.1. North America
- 5.4.2. Europe
- 5.4.3. Asia
- 5.4.4. Latin America
- 5.4.5. Middle East and Africa
- 5.4.6. Australia and New Zealand
- 5.1. Market Analysis, Insights and Forecast - by Deployment Type
- 6. North America Project Portfolio Management Market Analysis, Insights and Forecast, 2019-2031
- 6.1. Market Analysis, Insights and Forecast - by Deployment Type
- 6.1.1. Cloud
- 6.1.2. On-premise
- 6.2. Market Analysis, Insights and Forecast - by Type
- 6.2.1. Solution
- 6.2.2. Services
- 6.3. Market Analysis, Insights and Forecast - by End-user Verticals
- 6.3.1. IT And Telecom
- 6.3.2. Healthcare And Lifesciences
- 6.3.3. Manufacturing
- 6.3.4. Construction
- 6.3.5. Retail And Consumer Goods
- 6.3.6. BFSI
- 6.3.7. Other End-user Verticals
- 6.1. Market Analysis, Insights and Forecast - by Deployment Type
- 7. Europe Project Portfolio Management Market Analysis, Insights and Forecast, 2019-2031
- 7.1. Market Analysis, Insights and Forecast - by Deployment Type
- 7.1.1. Cloud
- 7.1.2. On-premise
- 7.2. Market Analysis, Insights and Forecast - by Type
- 7.2.1. Solution
- 7.2.2. Services
- 7.3. Market Analysis, Insights and Forecast - by End-user Verticals
- 7.3.1. IT And Telecom
- 7.3.2. Healthcare And Lifesciences
- 7.3.3. Manufacturing
- 7.3.4. Construction
- 7.3.5. Retail And Consumer Goods
- 7.3.6. BFSI
- 7.3.7. Other End-user Verticals
- 7.1. Market Analysis, Insights and Forecast - by Deployment Type
- 8. Asia Project Portfolio Management Market Analysis, Insights and Forecast, 2019-2031
- 8.1. Market Analysis, Insights and Forecast - by Deployment Type
- 8.1.1. Cloud
- 8.1.2. On-premise
- 8.2. Market Analysis, Insights and Forecast - by Type
- 8.2.1. Solution
- 8.2.2. Services
- 8.3. Market Analysis, Insights and Forecast - by End-user Verticals
- 8.3.1. IT And Telecom
- 8.3.2. Healthcare And Lifesciences
- 8.3.3. Manufacturing
- 8.3.4. Construction
- 8.3.5. Retail And Consumer Goods
- 8.3.6. BFSI
- 8.3.7. Other End-user Verticals
- 8.1. Market Analysis, Insights and Forecast - by Deployment Type
- 9. Latin America Project Portfolio Management Market Analysis, Insights and Forecast, 2019-2031
- 9.1. Market Analysis, Insights and Forecast - by Deployment Type
- 9.1.1. Cloud
- 9.1.2. On-premise
- 9.2. Market Analysis, Insights and Forecast - by Type
- 9.2.1. Solution
- 9.2.2. Services
- 9.3. Market Analysis, Insights and Forecast - by End-user Verticals
- 9.3.1. IT And Telecom
- 9.3.2. Healthcare And Lifesciences
- 9.3.3. Manufacturing
- 9.3.4. Construction
- 9.3.5. Retail And Consumer Goods
- 9.3.6. BFSI
- 9.3.7. Other End-user Verticals
- 9.1. Market Analysis, Insights and Forecast - by Deployment Type
- 10. Middle East and Africa Project Portfolio Management Market Analysis, Insights and Forecast, 2019-2031
- 10.1. Market Analysis, Insights and Forecast - by Deployment Type
- 10.1.1. Cloud
- 10.1.2. On-premise
- 10.2. Market Analysis, Insights and Forecast - by Type
- 10.2.1. Solution
- 10.2.2. Services
- 10.3. Market Analysis, Insights and Forecast - by End-user Verticals
- 10.3.1. IT And Telecom
- 10.3.2. Healthcare And Lifesciences
- 10.3.3. Manufacturing
- 10.3.4. Construction
- 10.3.5. Retail And Consumer Goods
- 10.3.6. BFSI
- 10.3.7. Other End-user Verticals
- 10.1. Market Analysis, Insights and Forecast - by Deployment Type
- 11. Australia and New Zealand Project Portfolio Management Market Analysis, Insights and Forecast, 2019-2031
- 11.1. Market Analysis, Insights and Forecast - by Deployment Type
- 11.1.1. Cloud
- 11.1.2. On-premise
- 11.2. Market Analysis, Insights and Forecast - by Type
- 11.2.1. Solution
- 11.2.2. Services
- 11.3. Market Analysis, Insights and Forecast - by End-user Verticals
- 11.3.1. IT And Telecom
- 11.3.2. Healthcare And Lifesciences
- 11.3.3. Manufacturing
- 11.3.4. Construction
- 11.3.5. Retail And Consumer Goods
- 11.3.6. BFSI
- 11.3.7. Other End-user Verticals
- 11.1. Market Analysis, Insights and Forecast - by Deployment Type
- 12. North America Project Portfolio Management Market Analysis, Insights and Forecast, 2019-2031
- 12.1. Market Analysis, Insights and Forecast - By Country/Sub-region
- 12.1.1.
- 13. Europe Project Portfolio Management Market Analysis, Insights and Forecast, 2019-2031
- 13.1. Market Analysis, Insights and Forecast - By Country/Sub-region
- 13.1.1.
- 14. Asia Pacific Project Portfolio Management Market Analysis, Insights and Forecast, 2019-2031
- 14.1. Market Analysis, Insights and Forecast - By Country/Sub-region
- 14.1.1.
- 15. Latin America Project Portfolio Management Market Analysis, Insights and Forecast, 2019-2031
- 15.1. Market Analysis, Insights and Forecast - By Country/Sub-region
- 15.1.1.
- 16. Middle East and Africa Project Portfolio Management Market Analysis, Insights and Forecast, 2019-2031
- 16.1. Market Analysis, Insights and Forecast - By Country/Sub-region
- 16.1.1.
- 17. Competitive Analysis
- 17.1. Global Market Share Analysis 2024
- 17.2. Company Profiles
- 17.2.1 Workday Inc
- 17.2.1.1. Overview
- 17.2.1.2. Products
- 17.2.1.3. SWOT Analysis
- 17.2.1.4. Recent Developments
- 17.2.1.5. Financials (Based on Availability)
- 17.2.2 Wrike (citrix Systems Inc )
- 17.2.2.1. Overview
- 17.2.2.2. Products
- 17.2.2.3. SWOT Analysis
- 17.2.2.4. Recent Developments
- 17.2.2.5. Financials (Based on Availability)
- 17.2.3 Monday com
- 17.2.3.1. Overview
- 17.2.3.2. Products
- 17.2.3.3. SWOT Analysis
- 17.2.3.4. Recent Developments
- 17.2.3.5. Financials (Based on Availability)
- 17.2.4 Smartsheet Inc
- 17.2.4.1. Overview
- 17.2.4.2. Products
- 17.2.4.3. SWOT Analysis
- 17.2.4.4. Recent Developments
- 17.2.4.5. Financials (Based on Availability)
- 17.2.5 Microsoft Corporation
- 17.2.5.1. Overview
- 17.2.5.2. Products
- 17.2.5.3. SWOT Analysis
- 17.2.5.4. Recent Developments
- 17.2.5.5. Financials (Based on Availability)
- 17.2.6 Upland Software Inc *List Not Exhaustive
- 17.2.6.1. Overview
- 17.2.6.2. Products
- 17.2.6.3. SWOT Analysis
- 17.2.6.4. Recent Developments
- 17.2.6.5. Financials (Based on Availability)
- 17.2.7 Oracle Corporation
- 17.2.7.1. Overview
- 17.2.7.2. Products
- 17.2.7.3. SWOT Analysis
- 17.2.7.4. Recent Developments
- 17.2.7.5. Financials (Based on Availability)
- 17.2.8 Atlassian Corporation Plc
- 17.2.8.1. Overview
- 17.2.8.2. Products
- 17.2.8.3. SWOT Analysis
- 17.2.8.4. Recent Developments
- 17.2.8.5. Financials (Based on Availability)
- 17.2.9 Asana Inc
- 17.2.9.1. Overview
- 17.2.9.2. Products
- 17.2.9.3. SWOT Analysis
- 17.2.9.4. Recent Developments
- 17.2.9.5. Financials (Based on Availability)
- 17.2.10 Servicenow Inc
- 17.2.10.1. Overview
- 17.2.10.2. Products
- 17.2.10.3. SWOT Analysis
- 17.2.10.4. Recent Developments
- 17.2.10.5. Financials (Based on Availability)
- 17.2.11 Planview Inc (changepoint)
- 17.2.11.1. Overview
- 17.2.11.2. Products
- 17.2.11.3. SWOT Analysis
- 17.2.11.4. Recent Developments
- 17.2.11.5. Financials (Based on Availability)
- 17.2.12 SAP SE
- 17.2.12.1. Overview
- 17.2.12.2. Products
- 17.2.12.3. SWOT Analysis
- 17.2.12.4. Recent Developments
- 17.2.12.5. Financials (Based on Availability)
- 17.2.1 Workday Inc
List of Figures
- Figure 1: Global Project Portfolio Management Market Revenue Breakdown (Million, %) by Region 2024 & 2032
- Figure 2: North America Project Portfolio Management Market Revenue (Million), by Country 2024 & 2032
- Figure 3: North America Project Portfolio Management Market Revenue Share (%), by Country 2024 & 2032
- Figure 4: Europe Project Portfolio Management Market Revenue (Million), by Country 2024 & 2032
- Figure 5: Europe Project Portfolio Management Market Revenue Share (%), by Country 2024 & 2032
- Figure 6: Asia Pacific Project Portfolio Management Market Revenue (Million), by Country 2024 & 2032
- Figure 7: Asia Pacific Project Portfolio Management Market Revenue Share (%), by Country 2024 & 2032
- Figure 8: Latin America Project Portfolio Management Market Revenue (Million), by Country 2024 & 2032
- Figure 9: Latin America Project Portfolio Management Market Revenue Share (%), by Country 2024 & 2032
- Figure 10: Middle East and Africa Project Portfolio Management Market Revenue (Million), by Country 2024 & 2032
- Figure 11: Middle East and Africa Project Portfolio Management Market Revenue Share (%), by Country 2024 & 2032
- Figure 12: North America Project Portfolio Management Market Revenue (Million), by Deployment Type 2024 & 2032
- Figure 13: North America Project Portfolio Management Market Revenue Share (%), by Deployment Type 2024 & 2032
- Figure 14: North America Project Portfolio Management Market Revenue (Million), by Type 2024 & 2032
- Figure 15: North America Project Portfolio Management Market Revenue Share (%), by Type 2024 & 2032
- Figure 16: North America Project Portfolio Management Market Revenue (Million), by End-user Verticals 2024 & 2032
- Figure 17: North America Project Portfolio Management Market Revenue Share (%), by End-user Verticals 2024 & 2032
- Figure 18: North America Project Portfolio Management Market Revenue (Million), by Country 2024 & 2032
- Figure 19: North America Project Portfolio Management Market Revenue Share (%), by Country 2024 & 2032
- Figure 20: Europe Project Portfolio Management Market Revenue (Million), by Deployment Type 2024 & 2032
- Figure 21: Europe Project Portfolio Management Market Revenue Share (%), by Deployment Type 2024 & 2032
- Figure 22: Europe Project Portfolio Management Market Revenue (Million), by Type 2024 & 2032
- Figure 23: Europe Project Portfolio Management Market Revenue Share (%), by Type 2024 & 2032
- Figure 24: Europe Project Portfolio Management Market Revenue (Million), by End-user Verticals 2024 & 2032
- Figure 25: Europe Project Portfolio Management Market Revenue Share (%), by End-user Verticals 2024 & 2032
- Figure 26: Europe Project Portfolio Management Market Revenue (Million), by Country 2024 & 2032
- Figure 27: Europe Project Portfolio Management Market Revenue Share (%), by Country 2024 & 2032
- Figure 28: Asia Project Portfolio Management Market Revenue (Million), by Deployment Type 2024 & 2032
- Figure 29: Asia Project Portfolio Management Market Revenue Share (%), by Deployment Type 2024 & 2032
- Figure 30: Asia Project Portfolio Management Market Revenue (Million), by Type 2024 & 2032
- Figure 31: Asia Project Portfolio Management Market Revenue Share (%), by Type 2024 & 2032
- Figure 32: Asia Project Portfolio Management Market Revenue (Million), by End-user Verticals 2024 & 2032
- Figure 33: Asia Project Portfolio Management Market Revenue Share (%), by End-user Verticals 2024 & 2032
- Figure 34: Asia Project Portfolio Management Market Revenue (Million), by Country 2024 & 2032
- Figure 35: Asia Project Portfolio Management Market Revenue Share (%), by Country 2024 & 2032
- Figure 36: Latin America Project Portfolio Management Market Revenue (Million), by Deployment Type 2024 & 2032
- Figure 37: Latin America Project Portfolio Management Market Revenue Share (%), by Deployment Type 2024 & 2032
- Figure 38: Latin America Project Portfolio Management Market Revenue (Million), by Type 2024 & 2032
- Figure 39: Latin America Project Portfolio Management Market Revenue Share (%), by Type 2024 & 2032
- Figure 40: Latin America Project Portfolio Management Market Revenue (Million), by End-user Verticals 2024 & 2032
- Figure 41: Latin America Project Portfolio Management Market Revenue Share (%), by End-user Verticals 2024 & 2032
- Figure 42: Latin America Project Portfolio Management Market Revenue (Million), by Country 2024 & 2032
- Figure 43: Latin America Project Portfolio Management Market Revenue Share (%), by Country 2024 & 2032
- Figure 44: Middle East and Africa Project Portfolio Management Market Revenue (Million), by Deployment Type 2024 & 2032
- Figure 45: Middle East and Africa Project Portfolio Management Market Revenue Share (%), by Deployment Type 2024 & 2032
- Figure 46: Middle East and Africa Project Portfolio Management Market Revenue (Million), by Type 2024 & 2032
- Figure 47: Middle East and Africa Project Portfolio Management Market Revenue Share (%), by Type 2024 & 2032
- Figure 48: Middle East and Africa Project Portfolio Management Market Revenue (Million), by End-user Verticals 2024 & 2032
- Figure 49: Middle East and Africa Project Portfolio Management Market Revenue Share (%), by End-user Verticals 2024 & 2032
- Figure 50: Middle East and Africa Project Portfolio Management Market Revenue (Million), by Country 2024 & 2032
- Figure 51: Middle East and Africa Project Portfolio Management Market Revenue Share (%), by Country 2024 & 2032
- Figure 52: Australia and New Zealand Project Portfolio Management Market Revenue (Million), by Deployment Type 2024 & 2032
- Figure 53: Australia and New Zealand Project Portfolio Management Market Revenue Share (%), by Deployment Type 2024 & 2032
- Figure 54: Australia and New Zealand Project Portfolio Management Market Revenue (Million), by Type 2024 & 2032
- Figure 55: Australia and New Zealand Project Portfolio Management Market Revenue Share (%), by Type 2024 & 2032
- Figure 56: Australia and New Zealand Project Portfolio Management Market Revenue (Million), by End-user Verticals 2024 & 2032
- Figure 57: Australia and New Zealand Project Portfolio Management Market Revenue Share (%), by End-user Verticals 2024 & 2032
- Figure 58: Australia and New Zealand Project Portfolio Management Market Revenue (Million), by Country 2024 & 2032
- Figure 59: Australia and New Zealand Project Portfolio Management Market Revenue Share (%), by Country 2024 & 2032
List of Tables
- Table 1: Global Project Portfolio Management Market Revenue Million Forecast, by Region 2019 & 2032
- Table 2: Global Project Portfolio Management Market Revenue Million Forecast, by Deployment Type 2019 & 2032
- Table 3: Global Project Portfolio Management Market Revenue Million Forecast, by Type 2019 & 2032
- Table 4: Global Project Portfolio Management Market Revenue Million Forecast, by End-user Verticals 2019 & 2032
- Table 5: Global Project Portfolio Management Market Revenue Million Forecast, by Region 2019 & 2032
- Table 6: Global Project Portfolio Management Market Revenue Million Forecast, by Country 2019 & 2032
- Table 7: Project Portfolio Management Market Revenue (Million) Forecast, by Application 2019 & 2032
- Table 8: Global Project Portfolio Management Market Revenue Million Forecast, by Country 2019 & 2032
- Table 9: Project Portfolio Management Market Revenue (Million) Forecast, by Application 2019 & 2032
- Table 10: Global Project Portfolio Management Market Revenue Million Forecast, by Country 2019 & 2032
- Table 11: Project Portfolio Management Market Revenue (Million) Forecast, by Application 2019 & 2032
- Table 12: Global Project Portfolio Management Market Revenue Million Forecast, by Country 2019 & 2032
- Table 13: Project Portfolio Management Market Revenue (Million) Forecast, by Application 2019 & 2032
- Table 14: Global Project Portfolio Management Market Revenue Million Forecast, by Country 2019 & 2032
- Table 15: Project Portfolio Management Market Revenue (Million) Forecast, by Application 2019 & 2032
- Table 16: Global Project Portfolio Management Market Revenue Million Forecast, by Deployment Type 2019 & 2032
- Table 17: Global Project Portfolio Management Market Revenue Million Forecast, by Type 2019 & 2032
- Table 18: Global Project Portfolio Management Market Revenue Million Forecast, by End-user Verticals 2019 & 2032
- Table 19: Global Project Portfolio Management Market Revenue Million Forecast, by Country 2019 & 2032
- Table 20: Global Project Portfolio Management Market Revenue Million Forecast, by Deployment Type 2019 & 2032
- Table 21: Global Project Portfolio Management Market Revenue Million Forecast, by Type 2019 & 2032
- Table 22: Global Project Portfolio Management Market Revenue Million Forecast, by End-user Verticals 2019 & 2032
- Table 23: Global Project Portfolio Management Market Revenue Million Forecast, by Country 2019 & 2032
- Table 24: Global Project Portfolio Management Market Revenue Million Forecast, by Deployment Type 2019 & 2032
- Table 25: Global Project Portfolio Management Market Revenue Million Forecast, by Type 2019 & 2032
- Table 26: Global Project Portfolio Management Market Revenue Million Forecast, by End-user Verticals 2019 & 2032
- Table 27: Global Project Portfolio Management Market Revenue Million Forecast, by Country 2019 & 2032
- Table 28: Global Project Portfolio Management Market Revenue Million Forecast, by Deployment Type 2019 & 2032
- Table 29: Global Project Portfolio Management Market Revenue Million Forecast, by Type 2019 & 2032
- Table 30: Global Project Portfolio Management Market Revenue Million Forecast, by End-user Verticals 2019 & 2032
- Table 31: Global Project Portfolio Management Market Revenue Million Forecast, by Country 2019 & 2032
- Table 32: Global Project Portfolio Management Market Revenue Million Forecast, by Deployment Type 2019 & 2032
- Table 33: Global Project Portfolio Management Market Revenue Million Forecast, by Type 2019 & 2032
- Table 34: Global Project Portfolio Management Market Revenue Million Forecast, by End-user Verticals 2019 & 2032
- Table 35: Global Project Portfolio Management Market Revenue Million Forecast, by Country 2019 & 2032
- Table 36: Global Project Portfolio Management Market Revenue Million Forecast, by Deployment Type 2019 & 2032
- Table 37: Global Project Portfolio Management Market Revenue Million Forecast, by Type 2019 & 2032
- Table 38: Global Project Portfolio Management Market Revenue Million Forecast, by End-user Verticals 2019 & 2032
- Table 39: Global Project Portfolio Management Market Revenue Million Forecast, by Country 2019 & 2032
Frequently Asked Questions
1. What is the projected Compound Annual Growth Rate (CAGR) of the Project Portfolio Management Market?
The projected CAGR is approximately 4.10%.
2. Which companies are prominent players in the Project Portfolio Management Market?
Key companies in the market include Workday Inc, Wrike (citrix Systems Inc ), Monday com, Smartsheet Inc, Microsoft Corporation, Upland Software Inc *List Not Exhaustive, Oracle Corporation, Atlassian Corporation Plc, Asana Inc, Servicenow Inc, Planview Inc (changepoint), SAP SE.
3. What are the main segments of the Project Portfolio Management Market?
The market segments include Deployment Type, Type, End-user Verticals.
4. Can you provide details about the market size?
The market size is estimated to be USD 5.59 Million as of 2022.
5. What are some drivers contributing to market growth?
Recent Changes In Work Culture and Move toward Remote Teams has Made It Imperative to Develop A Centralized View of Task Management and Resource Utilization; Long-term Cost Benefits Enabled By Timely Use of Planning & Scheduling Tools. Coupled With Growing Demand For Cloud-based Ppm; Integration Of Several Allied Modules And Collaborations Have Increased The Span of PPM to Cover The Entire Workspace Related Tasks.
6. What are the notable trends driving market growth?
Recent Changes In Work Culture And Move Towards Remote Teams to Drive the Market.
7. Are there any restraints impacting market growth?
Evolving Market Regulations.
8. Can you provide examples of recent developments in the market?
May 2022 - Proggio, a next-generation Project Portfolio Management solution based in Tel Aviv with offices in Salt Lake City, closed a $ 7 million Series A round led by 2.0 Ventures (Salt Lake City) with participation from both existing investors Mangrove Capital Partners (Luxembourg) and Cresson Management (Israel) and use the funding to accelerate its operations and growth in the United States and continue to strengthen its enterprise solution.
9. What pricing options are available for accessing the report?
Pricing options include single-user, multi-user, and enterprise licenses priced at USD 4750, USD 5250, and USD 8750 respectively.
10. Is the market size provided in terms of value or volume?
The market size is provided in terms of value, measured in Million.
11. Are there any specific market keywords associated with the report?
Yes, the market keyword associated with the report is "Project Portfolio Management Market," which aids in identifying and referencing the specific market segment covered.
12. How do I determine which pricing option suits my needs best?
The pricing options vary based on user requirements and access needs. Individual users may opt for single-user licenses, while businesses requiring broader access may choose multi-user or enterprise licenses for cost-effective access to the report.
13. Are there any additional resources or data provided in the Project Portfolio Management Market report?
While the report offers comprehensive insights, it's advisable to review the specific contents or supplementary materials provided to ascertain if additional resources or data are available.
14. How can I stay updated on further developments or reports in the Project Portfolio Management Market?
To stay informed about further developments, trends, and reports in the Project Portfolio Management Market, consider subscribing to industry newsletters, following relevant companies and organizations, or regularly checking reputable industry news sources and publications.
Methodology
Step 1 - Identification of Relevant Samples Size from Population Database


Step 2 - Approaches for Defining Global Market Size (Value, Volume* & Price*)

Note*: In applicable scenarios
Step 3 - Data Sources
Primary Research
- Web Analytics
- Survey Reports
- Research Institute
- Latest Research Reports
- Opinion Leaders
Secondary Research
- Annual Reports
- White Paper
- Latest Press Release
- Industry Association
- Paid Database
- Investor Presentations

Step 4 - Data Triangulation
Involves using different sources of information in order to increase the validity of a study
These sources are likely to be stakeholders in a program - participants, other researchers, program staff, other community members, and so on.
Then we put all data in single framework & apply various statistical tools to find out the dynamic on the market.
During the analysis stage, feedback from the stakeholder groups would be compared to determine areas of agreement as well as areas of divergence


