
Key Insights
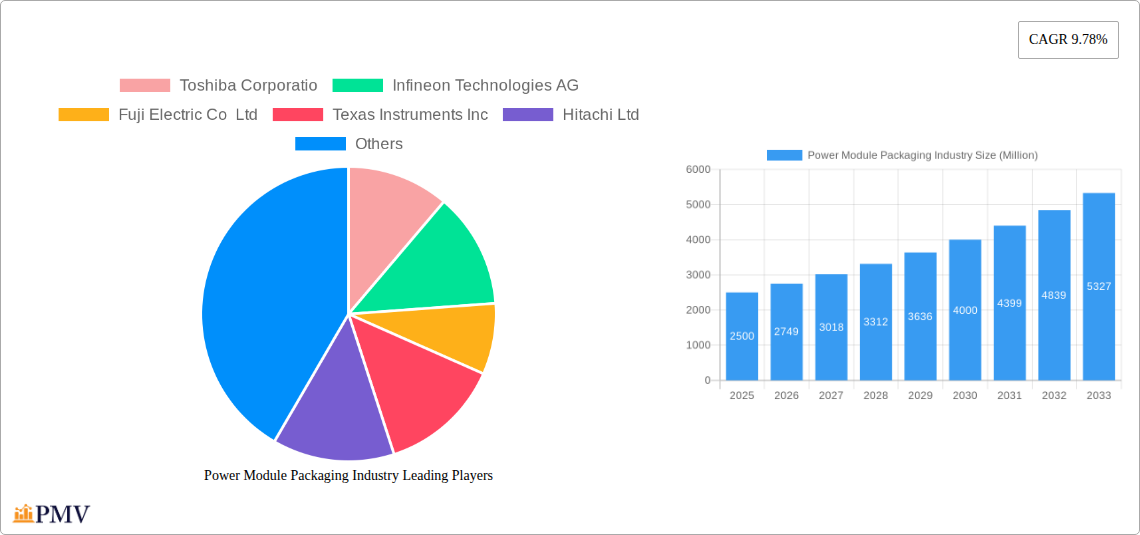
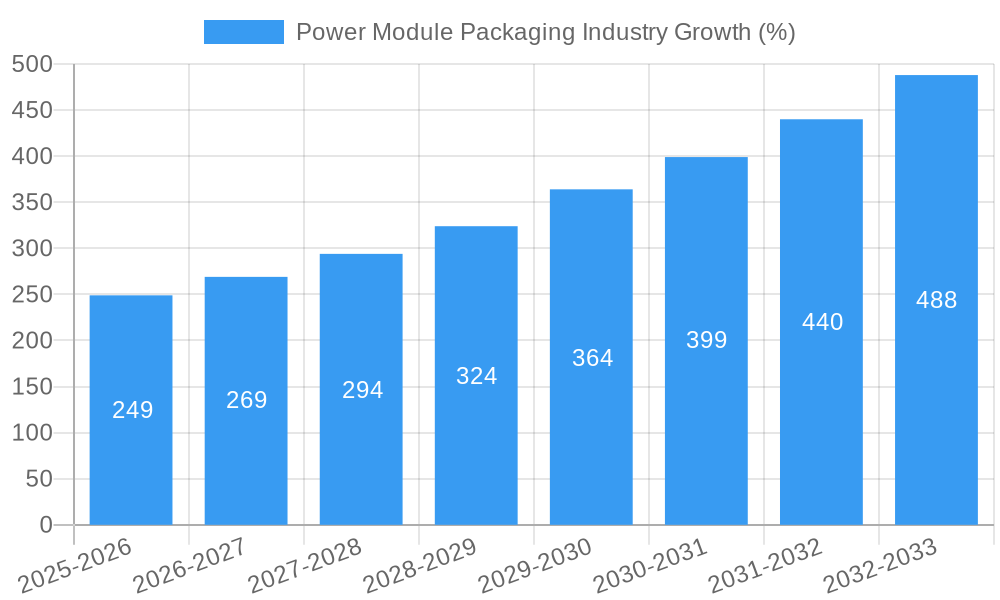
The power module packaging market is experiencing robust growth, projected to reach \$2.5 billion in 2025 and maintain a Compound Annual Growth Rate (CAGR) of 9.78% from 2025 to 2033. This expansion is fueled by several key drivers. The increasing demand for electric vehicles (EVs) and hybrid electric vehicles (HEVs) is a significant factor, as power modules are crucial components in their powertrain systems. Furthermore, the growing adoption of renewable energy sources, particularly solar and wind power, necessitates efficient power conversion and control, boosting demand for advanced power module packaging solutions. The trend towards miniaturization and higher power density in electronic devices further contributes to market growth, driving innovation in packaging technologies like substrate, baseplate, and die-attach methods. While supply chain disruptions and material cost fluctuations could pose some challenges, the long-term outlook remains positive, driven by technological advancements and the increasing electrification of various industries.
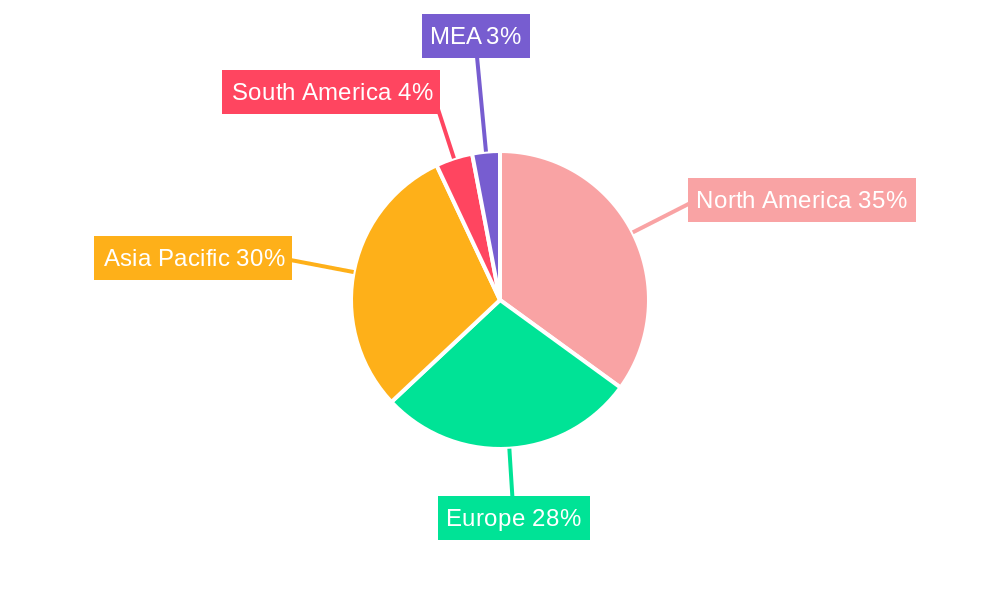
Market segmentation reveals a diverse landscape. Substrate and baseplate technologies dominate the market share, due to their widespread application in various power electronic systems. However, advancements in die-attach and substrate-attach techniques are expected to gain momentum, driven by the need for improved thermal management and higher power density. Encapsulation and interconnection technologies also contribute significantly, playing crucial roles in protecting and connecting power modules within complex systems. Geographically, North America and Asia-Pacific are key markets, with the latter experiencing particularly strong growth due to the rapid expansion of the electronics manufacturing industry in China, Japan, and other Asian countries. Europe also represents a substantial market, with a focus on high-efficiency and sustainable energy solutions. Key players like Toshiba, Infineon, and Texas Instruments are actively driving innovation and competition within this dynamic market.
Power Module Packaging Industry Market Report: 2019-2033
This comprehensive report provides a detailed analysis of the Power Module Packaging industry, offering valuable insights for stakeholders across the value chain. With a study period spanning 2019-2033, a base year of 2025, and a forecast period of 2025-2033, this report is crucial for understanding current market dynamics and predicting future trends. The global market size is estimated to be xx Million in 2025, showcasing significant growth potential.
Power Module Packaging Industry Market Structure & Competitive Dynamics
The Power Module Packaging market exhibits a moderately concentrated structure, with key players vying for market share. The industry is characterized by intense competition, driven by continuous technological advancements and the increasing demand for high-efficiency power modules across various sectors. Market share is largely influenced by factors such as technological innovation, manufacturing capabilities, and established customer relationships. Several key players hold a substantial share of the market, with smaller niche players catering to specific application segments. The innovation ecosystem is dynamic, with ongoing R&D efforts focused on improving packaging technologies, materials, and thermal management solutions. Regulatory frameworks, particularly those related to environmental compliance and safety standards, are increasingly shaping the competitive landscape. Product substitutes, such as alternative power module designs, pose a threat, while the growing adoption of electric vehicles and renewable energy systems significantly boosts demand. Mergers and acquisitions (M&A) activities are relatively common, with larger players acquiring smaller companies to enhance their technological capabilities and expand their market reach. In the last 5 years, the total value of M&A deals in the Power Module Packaging market is estimated to be around xx Million, with an average deal size of xx Million.
Power Module Packaging Industry Industry Trends & Insights
The Power Module Packaging market is experiencing robust growth, driven primarily by the increasing demand for high-power density and efficient power electronic systems across diverse sectors, including automotive, renewable energy, industrial automation, and data centers. The Compound Annual Growth Rate (CAGR) during the forecast period (2025-2033) is projected to be xx%, reflecting strong market expansion. Technological disruptions, such as the adoption of wide bandgap semiconductors (SiC and GaN), are significantly impacting the market, enabling the development of more compact, efficient, and reliable power modules. Consumer preferences are shifting towards environmentally friendly and sustainable power solutions, further driving the demand for energy-efficient power module packaging. The competitive dynamics are intense, with companies focusing on innovation, cost optimization, and strategic partnerships to maintain their market positions. Market penetration of advanced packaging technologies, such as 3D packaging and system-in-package (SiP), is steadily increasing, driven by the need for enhanced performance and miniaturization.
Dominant Markets & Segments in Power Module Packaging Industry
The Asia Pacific region dominates the Power Module Packaging market, driven by robust economic growth, increasing industrialization, and a burgeoning automotive sector. China and Japan are particularly significant markets within this region. Within the technology segments, the Substrate and Baseplate segments currently hold the largest market share due to their widespread use in various power module applications.
- Key Drivers in Asia Pacific:
- Strong economic growth and industrialization
- Growing automotive and renewable energy sectors
- Favorable government policies and incentives
- Expanding infrastructure development
- Increasing adoption of advanced packaging technologies
Dominance Analysis: The dominance of Asia Pacific stems from a combination of high demand, strong manufacturing capabilities, and favorable government support for the electronics industry. The Substrate and Baseplate segments benefit from their established role in existing power module designs and high volume production capabilities. However, other segments like Encapsulations and Interconnections are poised for significant growth driven by advancements in packaging technologies and increasing adoption of high-power density modules.
Power Module Packaging Industry Product Innovations
Recent product developments focus on miniaturization, higher power density, improved thermal management, and enhanced reliability. This includes advancements in materials, processes, and designs. New applications are emerging in electric vehicles (EVs), renewable energy systems, and data centers, driving innovation and creating opportunities for specialized power module packages. The competitive advantage hinges on delivering superior performance, reliability, and cost-effectiveness. Technological trends point toward the continued adoption of wide-bandgap semiconductors and advanced packaging techniques such as 3D integration and heterogeneous integration.
Report Segmentation & Scope
This report segments the Power Module Packaging market by technology:
- Substrate: This segment comprises substrates used to support and interconnect various components within a power module. Market growth is projected at xx% CAGR due to continued demand for traditional power modules.
- Baseplate: Baseplates provide mechanical support and thermal management for power modules. Market growth is expected at xx% CAGR driven by need for improved heat dissipation in high-power applications.
- Die Attach: Techniques and materials used to attach semiconductor dies to substrates. This is expected to grow at xx% CAGR due to increasing demand for high-power density modules.
- Substrate Attach: Methods of attaching substrates to other components, such as heat sinks. Expected CAGR of xx%.
- Encapsulations: Protective coatings to protect power modules from environmental factors. This segment has a projected CAGR of xx% driven by advancements in material science.
- Interconnections: Methods of connecting internal components within power modules. This segment's growth is pegged at xx% CAGR due to growing complexity of power modules.
- Others: This segment includes other related technologies and materials used in power module packaging. Projected to grow at xx% CAGR.
Key Drivers of Power Module Packaging Industry Growth
The growth of the Power Module Packaging industry is propelled by several key factors: the increasing demand for high-power density and energy-efficient power electronic systems across various sectors (automotive, renewable energy, industrial automation); technological advancements in wide bandgap semiconductors (SiC, GaN) leading to enhanced power module performance and miniaturization; government regulations and incentives aimed at promoting energy efficiency and reducing carbon emissions; and the ongoing adoption of electric vehicles and the expansion of renewable energy infrastructure.
Challenges in the Power Module Packaging Industry Sector
The Power Module Packaging industry faces challenges such as stringent regulatory compliance requirements, potential supply chain disruptions impacting the availability of critical raw materials, and intense competition among established players and new entrants. These factors can impact profitability and overall market growth. Furthermore, the need for continuous innovation and adaptation to rapidly evolving technological advancements presents an ongoing challenge for industry participants.
Leading Players in the Power Module Packaging Industry Market
- Toshiba Corporation
- Infineon Technologies AG
- Fuji Electric Co Ltd
- Texas Instruments Inc
- Hitachi Ltd
- Mitsubishi Electric Corporation
- Starpower Semiconductor Ltd
- STMicroelectronics NV
- Macmic Science & Technology Co Ltd
- Semikron Danfoss Holding A/S (Danfoss A/S)
- Amkor Technology Inc
Key Developments in Power Module Packaging Industry Sector
- December 2023: STMicroelectronics signed a long-term silicon carbide (SiC) supply agreement with Li Auto, boosting SiC MOSFET demand for electric vehicles.
- November 2023: Mitsubishi Electric Corporation partnered with Nexperia B.V. to jointly develop silicon carbide (SiC) power semiconductors, strengthening the SiC power semiconductor market.
Strategic Power Module Packaging Industry Market Outlook
The Power Module Packaging market presents significant growth opportunities driven by the expanding adoption of electric vehicles, renewable energy systems, and high-power electronic devices. Strategic partnerships, technological innovation, and a focus on delivering efficient and reliable solutions will be crucial for success in this dynamic market. Companies focusing on advanced packaging technologies and expanding into emerging markets will be well-positioned to capitalize on the substantial growth potential.
Power Module Packaging Industry Segmentation
-
1. Technology
- 1.1. Substrate
- 1.2. Baseplate
- 1.3. Die Attach
- 1.4. Substrate Attach
- 1.5. Encapsulations
- 1.6. Interconnections
- 1.7. Other Technologies
Power Module Packaging Industry Segmentation By Geography
- 1. North America
- 2. Europe
- 3. Asia
- 4. Australia and New Zealand
- 5. Latin America
- 6. Middle East and Africa
Power Module Packaging Industry REPORT HIGHLIGHTS
| Aspects | Details |
|---|---|
| Study Period | 2019-2033 |
| Base Year | 2024 |
| Estimated Year | 2025 |
| Forecast Period | 2025-2033 |
| Historical Period | 2019-2024 |
| Growth Rate | CAGR of 9.78% from 2019-2033 |
| Segmentation |
|
Table of Contents
- 1. Introduction
- 1.1. Research Scope
- 1.2. Market Segmentation
- 1.3. Research Methodology
- 1.4. Definitions and Assumptions
- 2. Executive Summary
- 2.1. Introduction
- 3. Market Dynamics
- 3.1. Introduction
- 3.2. Market Drivers
- 3.2.1. Increasing Demand from the Industrial and Consumer Electronics Segment; Rising Demand for Energy-efficient Devices
- 3.3. Market Restrains
- 3.3.1. Market Consolidation Affecting Overall Profitability
- 3.4. Market Trends
- 3.4.1. Increasing Demand from the Industrial and Consumer Electronics Segment to Drive the Market
- 4. Market Factor Analysis
- 4.1. Porters Five Forces
- 4.2. Supply/Value Chain
- 4.3. PESTEL analysis
- 4.4. Market Entropy
- 4.5. Patent/Trademark Analysis
- 5. Global Power Module Packaging Industry Analysis, Insights and Forecast, 2019-2031
- 5.1. Market Analysis, Insights and Forecast - by Technology
- 5.1.1. Substrate
- 5.1.2. Baseplate
- 5.1.3. Die Attach
- 5.1.4. Substrate Attach
- 5.1.5. Encapsulations
- 5.1.6. Interconnections
- 5.1.7. Other Technologies
- 5.2. Market Analysis, Insights and Forecast - by Region
- 5.2.1. North America
- 5.2.2. Europe
- 5.2.3. Asia
- 5.2.4. Australia and New Zealand
- 5.2.5. Latin America
- 5.2.6. Middle East and Africa
- 5.1. Market Analysis, Insights and Forecast - by Technology
- 6. North America Power Module Packaging Industry Analysis, Insights and Forecast, 2019-2031
- 6.1. Market Analysis, Insights and Forecast - by Technology
- 6.1.1. Substrate
- 6.1.2. Baseplate
- 6.1.3. Die Attach
- 6.1.4. Substrate Attach
- 6.1.5. Encapsulations
- 6.1.6. Interconnections
- 6.1.7. Other Technologies
- 6.1. Market Analysis, Insights and Forecast - by Technology
- 7. Europe Power Module Packaging Industry Analysis, Insights and Forecast, 2019-2031
- 7.1. Market Analysis, Insights and Forecast - by Technology
- 7.1.1. Substrate
- 7.1.2. Baseplate
- 7.1.3. Die Attach
- 7.1.4. Substrate Attach
- 7.1.5. Encapsulations
- 7.1.6. Interconnections
- 7.1.7. Other Technologies
- 7.1. Market Analysis, Insights and Forecast - by Technology
- 8. Asia Power Module Packaging Industry Analysis, Insights and Forecast, 2019-2031
- 8.1. Market Analysis, Insights and Forecast - by Technology
- 8.1.1. Substrate
- 8.1.2. Baseplate
- 8.1.3. Die Attach
- 8.1.4. Substrate Attach
- 8.1.5. Encapsulations
- 8.1.6. Interconnections
- 8.1.7. Other Technologies
- 8.1. Market Analysis, Insights and Forecast - by Technology
- 9. Australia and New Zealand Power Module Packaging Industry Analysis, Insights and Forecast, 2019-2031
- 9.1. Market Analysis, Insights and Forecast - by Technology
- 9.1.1. Substrate
- 9.1.2. Baseplate
- 9.1.3. Die Attach
- 9.1.4. Substrate Attach
- 9.1.5. Encapsulations
- 9.1.6. Interconnections
- 9.1.7. Other Technologies
- 9.1. Market Analysis, Insights and Forecast - by Technology
- 10. Latin America Power Module Packaging Industry Analysis, Insights and Forecast, 2019-2031
- 10.1. Market Analysis, Insights and Forecast - by Technology
- 10.1.1. Substrate
- 10.1.2. Baseplate
- 10.1.3. Die Attach
- 10.1.4. Substrate Attach
- 10.1.5. Encapsulations
- 10.1.6. Interconnections
- 10.1.7. Other Technologies
- 10.1. Market Analysis, Insights and Forecast - by Technology
- 11. Middle East and Africa Power Module Packaging Industry Analysis, Insights and Forecast, 2019-2031
- 11.1. Market Analysis, Insights and Forecast - by Technology
- 11.1.1. Substrate
- 11.1.2. Baseplate
- 11.1.3. Die Attach
- 11.1.4. Substrate Attach
- 11.1.5. Encapsulations
- 11.1.6. Interconnections
- 11.1.7. Other Technologies
- 11.1. Market Analysis, Insights and Forecast - by Technology
- 12. North America Power Module Packaging Industry Analysis, Insights and Forecast, 2019-2031
- 12.1. Market Analysis, Insights and Forecast - By Country/Sub-region
- 12.1.1 United States
- 12.1.2 Canada
- 12.1.3 Mexico
- 13. Europe Power Module Packaging Industry Analysis, Insights and Forecast, 2019-2031
- 13.1. Market Analysis, Insights and Forecast - By Country/Sub-region
- 13.1.1 Germany
- 13.1.2 United Kingdom
- 13.1.3 France
- 13.1.4 Spain
- 13.1.5 Italy
- 13.1.6 Spain
- 13.1.7 Belgium
- 13.1.8 Netherland
- 13.1.9 Nordics
- 13.1.10 Rest of Europe
- 14. Asia Pacific Power Module Packaging Industry Analysis, Insights and Forecast, 2019-2031
- 14.1. Market Analysis, Insights and Forecast - By Country/Sub-region
- 14.1.1 China
- 14.1.2 Japan
- 14.1.3 India
- 14.1.4 South Korea
- 14.1.5 Southeast Asia
- 14.1.6 Australia
- 14.1.7 Indonesia
- 14.1.8 Phillipes
- 14.1.9 Singapore
- 14.1.10 Thailandc
- 14.1.11 Rest of Asia Pacific
- 15. South America Power Module Packaging Industry Analysis, Insights and Forecast, 2019-2031
- 15.1. Market Analysis, Insights and Forecast - By Country/Sub-region
- 15.1.1 Brazil
- 15.1.2 Argentina
- 15.1.3 Peru
- 15.1.4 Chile
- 15.1.5 Colombia
- 15.1.6 Ecuador
- 15.1.7 Venezuela
- 15.1.8 Rest of South America
- 16. North America Power Module Packaging Industry Analysis, Insights and Forecast, 2019-2031
- 16.1. Market Analysis, Insights and Forecast - By Country/Sub-region
- 16.1.1 United States
- 16.1.2 Canada
- 16.1.3 Mexico
- 17. MEA Power Module Packaging Industry Analysis, Insights and Forecast, 2019-2031
- 17.1. Market Analysis, Insights and Forecast - By Country/Sub-region
- 17.1.1 United Arab Emirates
- 17.1.2 Saudi Arabia
- 17.1.3 South Africa
- 17.1.4 Rest of Middle East and Africa
- 18. Competitive Analysis
- 18.1. Global Market Share Analysis 2024
- 18.2. Company Profiles
- 18.2.1 Toshiba Corporatio
- 18.2.1.1. Overview
- 18.2.1.2. Products
- 18.2.1.3. SWOT Analysis
- 18.2.1.4. Recent Developments
- 18.2.1.5. Financials (Based on Availability)
- 18.2.2 Infineon Technologies AG
- 18.2.2.1. Overview
- 18.2.2.2. Products
- 18.2.2.3. SWOT Analysis
- 18.2.2.4. Recent Developments
- 18.2.2.5. Financials (Based on Availability)
- 18.2.3 Fuji Electric Co Ltd
- 18.2.3.1. Overview
- 18.2.3.2. Products
- 18.2.3.3. SWOT Analysis
- 18.2.3.4. Recent Developments
- 18.2.3.5. Financials (Based on Availability)
- 18.2.4 Texas Instruments Inc
- 18.2.4.1. Overview
- 18.2.4.2. Products
- 18.2.4.3. SWOT Analysis
- 18.2.4.4. Recent Developments
- 18.2.4.5. Financials (Based on Availability)
- 18.2.5 Hitachi Ltd
- 18.2.5.1. Overview
- 18.2.5.2. Products
- 18.2.5.3. SWOT Analysis
- 18.2.5.4. Recent Developments
- 18.2.5.5. Financials (Based on Availability)
- 18.2.6 Mitsubishi Electric Corporation
- 18.2.6.1. Overview
- 18.2.6.2. Products
- 18.2.6.3. SWOT Analysis
- 18.2.6.4. Recent Developments
- 18.2.6.5. Financials (Based on Availability)
- 18.2.7 Starpower Semiconductor Ltd
- 18.2.7.1. Overview
- 18.2.7.2. Products
- 18.2.7.3. SWOT Analysis
- 18.2.7.4. Recent Developments
- 18.2.7.5. Financials (Based on Availability)
- 18.2.8 STMicroelectronics NV
- 18.2.8.1. Overview
- 18.2.8.2. Products
- 18.2.8.3. SWOT Analysis
- 18.2.8.4. Recent Developments
- 18.2.8.5. Financials (Based on Availability)
- 18.2.9 Macmic Science & Technology Co Ltd
- 18.2.9.1. Overview
- 18.2.9.2. Products
- 18.2.9.3. SWOT Analysis
- 18.2.9.4. Recent Developments
- 18.2.9.5. Financials (Based on Availability)
- 18.2.10 Semikron Danfoss Holding A/S (Danfoss A/S)
- 18.2.10.1. Overview
- 18.2.10.2. Products
- 18.2.10.3. SWOT Analysis
- 18.2.10.4. Recent Developments
- 18.2.10.5. Financials (Based on Availability)
- 18.2.11 Amkor Technology Inc
- 18.2.11.1. Overview
- 18.2.11.2. Products
- 18.2.11.3. SWOT Analysis
- 18.2.11.4. Recent Developments
- 18.2.11.5. Financials (Based on Availability)
- 18.2.1 Toshiba Corporatio
List of Figures
- Figure 1: Global Power Module Packaging Industry Revenue Breakdown (Million, %) by Region 2024 & 2032
- Figure 2: North America Power Module Packaging Industry Revenue (Million), by Country 2024 & 2032
- Figure 3: North America Power Module Packaging Industry Revenue Share (%), by Country 2024 & 2032
- Figure 4: Europe Power Module Packaging Industry Revenue (Million), by Country 2024 & 2032
- Figure 5: Europe Power Module Packaging Industry Revenue Share (%), by Country 2024 & 2032
- Figure 6: Asia Pacific Power Module Packaging Industry Revenue (Million), by Country 2024 & 2032
- Figure 7: Asia Pacific Power Module Packaging Industry Revenue Share (%), by Country 2024 & 2032
- Figure 8: South America Power Module Packaging Industry Revenue (Million), by Country 2024 & 2032
- Figure 9: South America Power Module Packaging Industry Revenue Share (%), by Country 2024 & 2032
- Figure 10: North America Power Module Packaging Industry Revenue (Million), by Country 2024 & 2032
- Figure 11: North America Power Module Packaging Industry Revenue Share (%), by Country 2024 & 2032
- Figure 12: MEA Power Module Packaging Industry Revenue (Million), by Country 2024 & 2032
- Figure 13: MEA Power Module Packaging Industry Revenue Share (%), by Country 2024 & 2032
- Figure 14: North America Power Module Packaging Industry Revenue (Million), by Technology 2024 & 2032
- Figure 15: North America Power Module Packaging Industry Revenue Share (%), by Technology 2024 & 2032
- Figure 16: North America Power Module Packaging Industry Revenue (Million), by Country 2024 & 2032
- Figure 17: North America Power Module Packaging Industry Revenue Share (%), by Country 2024 & 2032
- Figure 18: Europe Power Module Packaging Industry Revenue (Million), by Technology 2024 & 2032
- Figure 19: Europe Power Module Packaging Industry Revenue Share (%), by Technology 2024 & 2032
- Figure 20: Europe Power Module Packaging Industry Revenue (Million), by Country 2024 & 2032
- Figure 21: Europe Power Module Packaging Industry Revenue Share (%), by Country 2024 & 2032
- Figure 22: Asia Power Module Packaging Industry Revenue (Million), by Technology 2024 & 2032
- Figure 23: Asia Power Module Packaging Industry Revenue Share (%), by Technology 2024 & 2032
- Figure 24: Asia Power Module Packaging Industry Revenue (Million), by Country 2024 & 2032
- Figure 25: Asia Power Module Packaging Industry Revenue Share (%), by Country 2024 & 2032
- Figure 26: Australia and New Zealand Power Module Packaging Industry Revenue (Million), by Technology 2024 & 2032
- Figure 27: Australia and New Zealand Power Module Packaging Industry Revenue Share (%), by Technology 2024 & 2032
- Figure 28: Australia and New Zealand Power Module Packaging Industry Revenue (Million), by Country 2024 & 2032
- Figure 29: Australia and New Zealand Power Module Packaging Industry Revenue Share (%), by Country 2024 & 2032
- Figure 30: Latin America Power Module Packaging Industry Revenue (Million), by Technology 2024 & 2032
- Figure 31: Latin America Power Module Packaging Industry Revenue Share (%), by Technology 2024 & 2032
- Figure 32: Latin America Power Module Packaging Industry Revenue (Million), by Country 2024 & 2032
- Figure 33: Latin America Power Module Packaging Industry Revenue Share (%), by Country 2024 & 2032
- Figure 34: Middle East and Africa Power Module Packaging Industry Revenue (Million), by Technology 2024 & 2032
- Figure 35: Middle East and Africa Power Module Packaging Industry Revenue Share (%), by Technology 2024 & 2032
- Figure 36: Middle East and Africa Power Module Packaging Industry Revenue (Million), by Country 2024 & 2032
- Figure 37: Middle East and Africa Power Module Packaging Industry Revenue Share (%), by Country 2024 & 2032
List of Tables
- Table 1: Global Power Module Packaging Industry Revenue Million Forecast, by Region 2019 & 2032
- Table 2: Global Power Module Packaging Industry Revenue Million Forecast, by Technology 2019 & 2032
- Table 3: Global Power Module Packaging Industry Revenue Million Forecast, by Region 2019 & 2032
- Table 4: Global Power Module Packaging Industry Revenue Million Forecast, by Country 2019 & 2032
- Table 5: United States Power Module Packaging Industry Revenue (Million) Forecast, by Application 2019 & 2032
- Table 6: Canada Power Module Packaging Industry Revenue (Million) Forecast, by Application 2019 & 2032
- Table 7: Mexico Power Module Packaging Industry Revenue (Million) Forecast, by Application 2019 & 2032
- Table 8: Global Power Module Packaging Industry Revenue Million Forecast, by Country 2019 & 2032
- Table 9: Germany Power Module Packaging Industry Revenue (Million) Forecast, by Application 2019 & 2032
- Table 10: United Kingdom Power Module Packaging Industry Revenue (Million) Forecast, by Application 2019 & 2032
- Table 11: France Power Module Packaging Industry Revenue (Million) Forecast, by Application 2019 & 2032
- Table 12: Spain Power Module Packaging Industry Revenue (Million) Forecast, by Application 2019 & 2032
- Table 13: Italy Power Module Packaging Industry Revenue (Million) Forecast, by Application 2019 & 2032
- Table 14: Spain Power Module Packaging Industry Revenue (Million) Forecast, by Application 2019 & 2032
- Table 15: Belgium Power Module Packaging Industry Revenue (Million) Forecast, by Application 2019 & 2032
- Table 16: Netherland Power Module Packaging Industry Revenue (Million) Forecast, by Application 2019 & 2032
- Table 17: Nordics Power Module Packaging Industry Revenue (Million) Forecast, by Application 2019 & 2032
- Table 18: Rest of Europe Power Module Packaging Industry Revenue (Million) Forecast, by Application 2019 & 2032
- Table 19: Global Power Module Packaging Industry Revenue Million Forecast, by Country 2019 & 2032
- Table 20: China Power Module Packaging Industry Revenue (Million) Forecast, by Application 2019 & 2032
- Table 21: Japan Power Module Packaging Industry Revenue (Million) Forecast, by Application 2019 & 2032
- Table 22: India Power Module Packaging Industry Revenue (Million) Forecast, by Application 2019 & 2032
- Table 23: South Korea Power Module Packaging Industry Revenue (Million) Forecast, by Application 2019 & 2032
- Table 24: Southeast Asia Power Module Packaging Industry Revenue (Million) Forecast, by Application 2019 & 2032
- Table 25: Australia Power Module Packaging Industry Revenue (Million) Forecast, by Application 2019 & 2032
- Table 26: Indonesia Power Module Packaging Industry Revenue (Million) Forecast, by Application 2019 & 2032
- Table 27: Phillipes Power Module Packaging Industry Revenue (Million) Forecast, by Application 2019 & 2032
- Table 28: Singapore Power Module Packaging Industry Revenue (Million) Forecast, by Application 2019 & 2032
- Table 29: Thailandc Power Module Packaging Industry Revenue (Million) Forecast, by Application 2019 & 2032
- Table 30: Rest of Asia Pacific Power Module Packaging Industry Revenue (Million) Forecast, by Application 2019 & 2032
- Table 31: Global Power Module Packaging Industry Revenue Million Forecast, by Country 2019 & 2032
- Table 32: Brazil Power Module Packaging Industry Revenue (Million) Forecast, by Application 2019 & 2032
- Table 33: Argentina Power Module Packaging Industry Revenue (Million) Forecast, by Application 2019 & 2032
- Table 34: Peru Power Module Packaging Industry Revenue (Million) Forecast, by Application 2019 & 2032
- Table 35: Chile Power Module Packaging Industry Revenue (Million) Forecast, by Application 2019 & 2032
- Table 36: Colombia Power Module Packaging Industry Revenue (Million) Forecast, by Application 2019 & 2032
- Table 37: Ecuador Power Module Packaging Industry Revenue (Million) Forecast, by Application 2019 & 2032
- Table 38: Venezuela Power Module Packaging Industry Revenue (Million) Forecast, by Application 2019 & 2032
- Table 39: Rest of South America Power Module Packaging Industry Revenue (Million) Forecast, by Application 2019 & 2032
- Table 40: Global Power Module Packaging Industry Revenue Million Forecast, by Country 2019 & 2032
- Table 41: United States Power Module Packaging Industry Revenue (Million) Forecast, by Application 2019 & 2032
- Table 42: Canada Power Module Packaging Industry Revenue (Million) Forecast, by Application 2019 & 2032
- Table 43: Mexico Power Module Packaging Industry Revenue (Million) Forecast, by Application 2019 & 2032
- Table 44: Global Power Module Packaging Industry Revenue Million Forecast, by Country 2019 & 2032
- Table 45: United Arab Emirates Power Module Packaging Industry Revenue (Million) Forecast, by Application 2019 & 2032
- Table 46: Saudi Arabia Power Module Packaging Industry Revenue (Million) Forecast, by Application 2019 & 2032
- Table 47: South Africa Power Module Packaging Industry Revenue (Million) Forecast, by Application 2019 & 2032
- Table 48: Rest of Middle East and Africa Power Module Packaging Industry Revenue (Million) Forecast, by Application 2019 & 2032
- Table 49: Global Power Module Packaging Industry Revenue Million Forecast, by Technology 2019 & 2032
- Table 50: Global Power Module Packaging Industry Revenue Million Forecast, by Country 2019 & 2032
- Table 51: Global Power Module Packaging Industry Revenue Million Forecast, by Technology 2019 & 2032
- Table 52: Global Power Module Packaging Industry Revenue Million Forecast, by Country 2019 & 2032
- Table 53: Global Power Module Packaging Industry Revenue Million Forecast, by Technology 2019 & 2032
- Table 54: Global Power Module Packaging Industry Revenue Million Forecast, by Country 2019 & 2032
- Table 55: Global Power Module Packaging Industry Revenue Million Forecast, by Technology 2019 & 2032
- Table 56: Global Power Module Packaging Industry Revenue Million Forecast, by Country 2019 & 2032
- Table 57: Global Power Module Packaging Industry Revenue Million Forecast, by Technology 2019 & 2032
- Table 58: Global Power Module Packaging Industry Revenue Million Forecast, by Country 2019 & 2032
- Table 59: Global Power Module Packaging Industry Revenue Million Forecast, by Technology 2019 & 2032
- Table 60: Global Power Module Packaging Industry Revenue Million Forecast, by Country 2019 & 2032
Frequently Asked Questions
1. What is the projected Compound Annual Growth Rate (CAGR) of the Power Module Packaging Industry?
The projected CAGR is approximately 9.78%.
2. Which companies are prominent players in the Power Module Packaging Industry?
Key companies in the market include Toshiba Corporatio, Infineon Technologies AG, Fuji Electric Co Ltd, Texas Instruments Inc, Hitachi Ltd, Mitsubishi Electric Corporation, Starpower Semiconductor Ltd, STMicroelectronics NV, Macmic Science & Technology Co Ltd, Semikron Danfoss Holding A/S (Danfoss A/S), Amkor Technology Inc.
3. What are the main segments of the Power Module Packaging Industry?
The market segments include Technology.
4. Can you provide details about the market size?
The market size is estimated to be USD 2.5 Million as of 2022.
5. What are some drivers contributing to market growth?
Increasing Demand from the Industrial and Consumer Electronics Segment; Rising Demand for Energy-efficient Devices.
6. What are the notable trends driving market growth?
Increasing Demand from the Industrial and Consumer Electronics Segment to Drive the Market.
7. Are there any restraints impacting market growth?
Market Consolidation Affecting Overall Profitability.
8. Can you provide examples of recent developments in the market?
December 2023 - STMicroelectronics announced that it signed a long-term silicon carbide (SiC) supply agreement with Li Auto. Under this agreement, STMicroelectronics will provide Li Auto with SiC MOSFET devices to support Li Auto’s strategy around high-voltage battery electric vehicles (BEVs) in various market segments.
9. What pricing options are available for accessing the report?
Pricing options include single-user, multi-user, and enterprise licenses priced at USD 4750, USD 5250, and USD 8750 respectively.
10. Is the market size provided in terms of value or volume?
The market size is provided in terms of value, measured in Million.
11. Are there any specific market keywords associated with the report?
Yes, the market keyword associated with the report is "Power Module Packaging Industry," which aids in identifying and referencing the specific market segment covered.
12. How do I determine which pricing option suits my needs best?
The pricing options vary based on user requirements and access needs. Individual users may opt for single-user licenses, while businesses requiring broader access may choose multi-user or enterprise licenses for cost-effective access to the report.
13. Are there any additional resources or data provided in the Power Module Packaging Industry report?
While the report offers comprehensive insights, it's advisable to review the specific contents or supplementary materials provided to ascertain if additional resources or data are available.
14. How can I stay updated on further developments or reports in the Power Module Packaging Industry?
To stay informed about further developments, trends, and reports in the Power Module Packaging Industry, consider subscribing to industry newsletters, following relevant companies and organizations, or regularly checking reputable industry news sources and publications.
Methodology
Step 1 - Identification of Relevant Samples Size from Population Database


Step 2 - Approaches for Defining Global Market Size (Value, Volume* & Price*)

Note*: In applicable scenarios
Step 3 - Data Sources
Primary Research
- Web Analytics
- Survey Reports
- Research Institute
- Latest Research Reports
- Opinion Leaders
Secondary Research
- Annual Reports
- White Paper
- Latest Press Release
- Industry Association
- Paid Database
- Investor Presentations

Step 4 - Data Triangulation
Involves using different sources of information in order to increase the validity of a study
These sources are likely to be stakeholders in a program - participants, other researchers, program staff, other community members, and so on.
Then we put all data in single framework & apply various statistical tools to find out the dynamic on the market.
During the analysis stage, feedback from the stakeholder groups would be compared to determine areas of agreement as well as areas of divergence


