
Key Insights
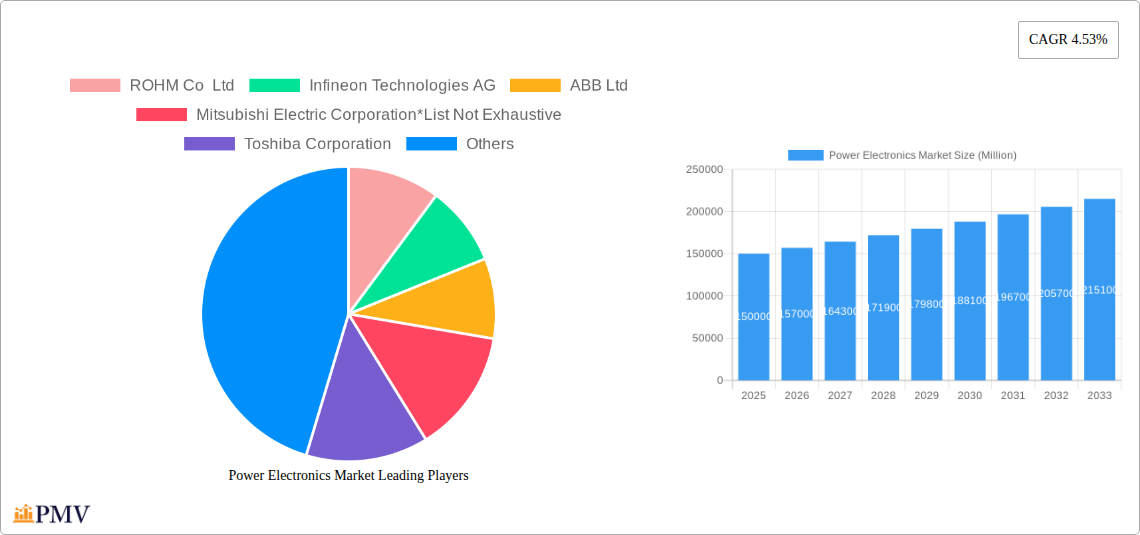
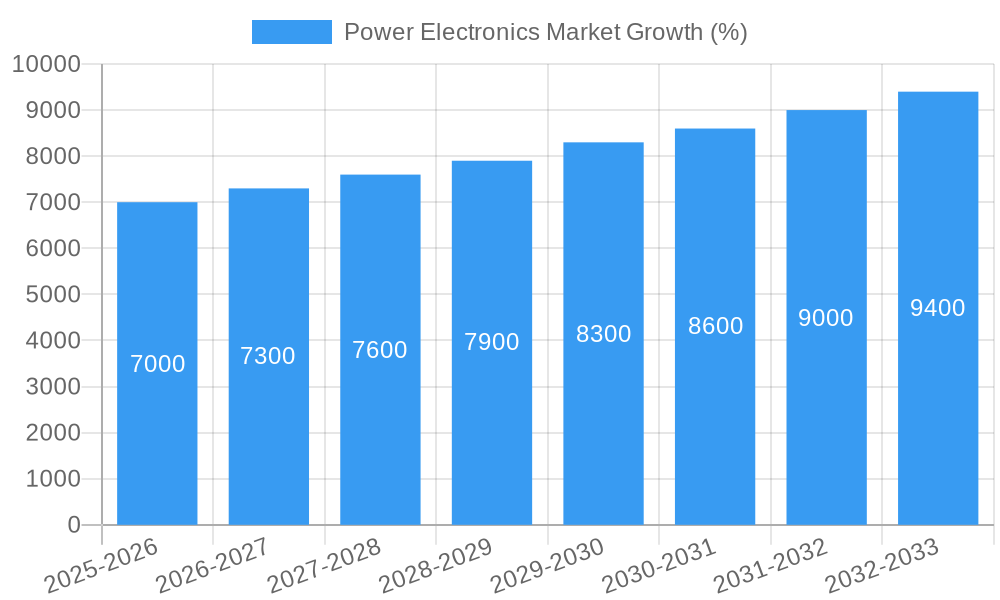
The power electronics market is experiencing robust growth, driven by the increasing demand for energy-efficient solutions across diverse sectors. A compound annual growth rate (CAGR) of 4.53% from 2019 to 2024 suggests a significant expansion, and this trajectory is expected to continue throughout the forecast period (2025-2033). Key drivers include the burgeoning electric vehicle (EV) market, the proliferation of renewable energy sources requiring efficient power conversion, and the continuous miniaturization and improved performance of electronic devices in consumer electronics and industrial applications. The market segmentation reveals a strong preference for silicon-based components, although silicon carbide (SiC) and gallium nitride (GaN) are gaining traction due to their superior performance characteristics, particularly in high-power applications like EVs and fast chargers. The automotive and consumer electronics sectors are currently the largest end-user industries, but significant growth is anticipated in renewable energy and industrial automation, fueled by global decarbonization efforts. While material costs and supply chain complexities could pose challenges, the overall outlook for the power electronics market remains optimistic, projecting substantial growth over the next decade. Competition is fierce among major players such as ROHM, Infineon, ABB, and others, leading to continuous innovation and cost optimization within the industry.
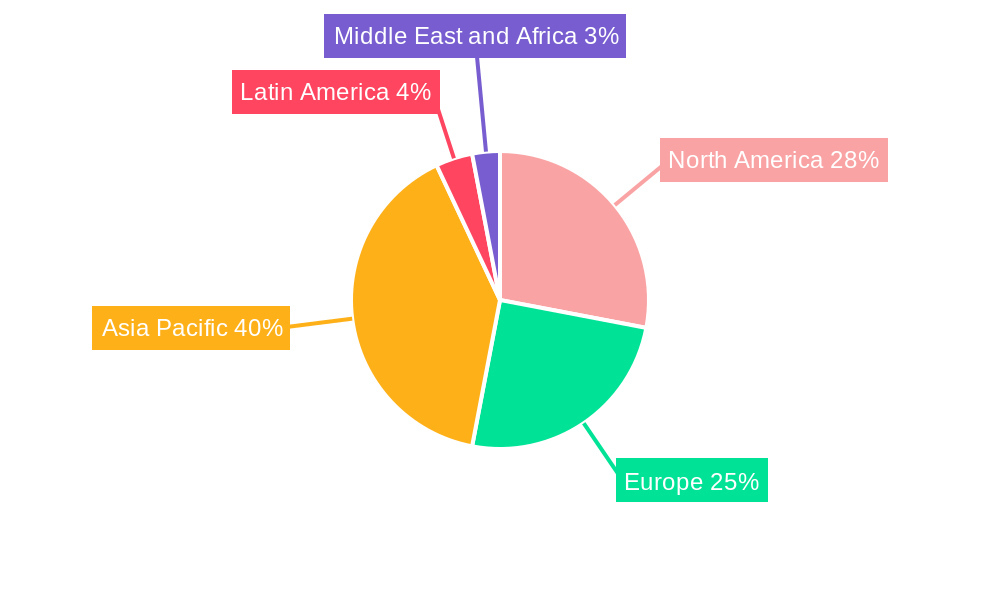
The regional distribution of the market is likely to see continued dominance by Asia Pacific, driven by substantial manufacturing capabilities and a high concentration of consumer electronics and automotive production. North America and Europe are also expected to contribute significantly, driven by advancements in renewable energy integration and strong demand in various end-user sectors. However, emerging economies in Latin America, the Middle East, and Africa are likely to exhibit faster growth rates in the coming years, driven by increasing infrastructure development and rising disposable incomes. This growth will likely be fuelled by government initiatives supporting renewable energy deployment and the development of electric vehicle infrastructure. The market is undergoing a continuous transformation, with a shift towards more efficient and sustainable power electronics solutions, which will shape the competitive landscape in the years to come.
Power Electronics Market: A Comprehensive Report (2019-2033)
This comprehensive report provides an in-depth analysis of the Power Electronics Market, covering the period 2019-2033. It offers valuable insights into market dynamics, key players, technological advancements, and future growth prospects. With a focus on actionable data and strategic recommendations, this report is an essential resource for industry professionals, investors, and anyone seeking a deep understanding of this rapidly evolving market. The report includes a detailed analysis of market segmentation by component (discrete, module), material (Silicon/Germanium, Silicon Carbide (SiC), Gallium Nitride (GaN)), and end-user industry (automotive, consumer electronics, IT & telecommunication, military & aerospace, industrial, energy & power, other). The base year for this report is 2025, with estimations for 2025 and forecasts extending to 2033. The historical period covered is 2019-2024.
Power Electronics Market Market Structure & Competitive Dynamics
The Power Electronics Market is characterized by a moderately concentrated structure with several major players commanding significant market share. Key players include ROHM Co Ltd, Infineon Technologies AG, ABB Ltd, Mitsubishi Electric Corporation, Toshiba Corporation, STMicroelectronics NV, Texas Instruments Inc, ON Semiconductor Corporation, Vishay Intertechnologies Inc, and Renesas Electronic Corporation. However, the market also accommodates numerous smaller players, fostering a dynamic competitive landscape. The market share of the top 5 companies is estimated to be xx% in 2025.
Innovation ecosystems play a crucial role, driving the development of new materials like SiC and GaN, leading to improved efficiency and power density. Regulatory frameworks, particularly concerning energy efficiency and environmental standards, influence market growth and product development. Product substitutes, such as alternative energy solutions, represent a potential challenge, while end-user trends towards miniaturization and increased power density shape product demand. M&A activities have been relatively frequent, with deal values exceeding xx Million in recent years, indicating consolidation and strategic expansion within the sector. The average deal size was approximately xx Million in the period 2021-2023.
- Market Concentration: Moderately concentrated, with top 5 players holding xx% market share in 2025.
- Innovation: Strong focus on SiC and GaN technologies, improving efficiency.
- Regulatory Environment: Growing emphasis on energy efficiency and environmental standards.
- M&A Activity: Significant M&A activity with deal values exceeding xx Million in recent years.
Power Electronics Market Industry Trends & Insights
The Power Electronics Market is experiencing robust growth, driven by the increasing demand for energy-efficient solutions across various end-user industries. The market is projected to witness a Compound Annual Growth Rate (CAGR) of xx% during the forecast period (2025-2033). Key growth drivers include the proliferation of electric vehicles (EVs), the expansion of renewable energy sources, and the increasing adoption of power electronics in consumer electronics, IT & telecommunication, and industrial automation. Technological disruptions, such as advancements in wide bandgap semiconductor materials (SiC and GaN), are further accelerating market growth. Market penetration of SiC-based power modules in the automotive industry is expected to reach xx% by 2030. Consumer preference for smaller, lighter, and more efficient electronic devices is bolstering demand for advanced power electronics solutions. Intense competition among key players stimulates innovation and drives down prices, benefiting end-users.
Dominant Markets & Segments in Power Electronics Market
The Automotive sector is the dominant end-user industry for power electronics, driven by the rapid growth of electric and hybrid vehicles. The Asia-Pacific region, particularly China and Japan, holds a leading position in the market due to large-scale manufacturing and robust demand.
- By Component: The module segment is expected to witness faster growth compared to the discrete segment.
- By Material: SiC and GaN are experiencing significant growth, driven by their superior performance characteristics. Silicon/Germanium continues to dominate, but its share is gradually declining.
- By End-user Industry:
- Automotive: Driven by the growth of EVs and hybrid vehicles. Key drivers include stringent emission regulations and government incentives.
- Consumer Electronics: Fueled by the demand for smaller, more efficient devices.
- IT and Telecommunication: Driven by the increasing adoption of 5G technology and data centers.
- Industrial: Growth is driven by the increasing automation and demand for energy-efficient industrial equipment.
Power Electronics Market Product Innovations
Recent product launches highlight the market's focus on improving efficiency, power density, and reliability. Infineon's OptiMOS 740 V MOSFET family, Vishay's third-generation 650 V SiC Schottky diodes, and Toshiba's 150V N-channel power MOSFET exemplify this trend. These innovations cater to the growing demand for high-performance power electronics in various applications, such as automotive, industrial, and renewable energy sectors. The adoption of wider bandgap materials like SiC and GaN is a significant trend, enhancing efficiency and enabling the development of smaller, more powerful devices.
Report Segmentation & Scope
This report segments the Power Electronics Market based on component (discrete, module), material (Silicon/Germanium, Silicon Carbide (SiC), Gallium Nitride (GaN)), and end-user industry (automotive, consumer electronics, IT and telecommunication, military and aerospace, industrial, energy and power, other end-user industries). Each segment's growth projections, market sizes, and competitive dynamics are analyzed in detail. The automotive segment is expected to remain the dominant segment throughout the forecast period. SiC and GaN materials are projected to experience the highest growth rates, driven by their superior performance characteristics compared to traditional Silicon/Germanium.
Key Drivers of Power Electronics Market Growth
The market's growth is primarily driven by the increasing demand for energy-efficient solutions, the proliferation of electric vehicles, the expansion of renewable energy, and technological advancements in SiC and GaN semiconductors. Government regulations promoting energy efficiency and emission reduction also play a significant role. The rising adoption of power electronics in various applications across diverse end-user sectors further accelerates market growth.
Challenges in the Power Electronics Market Sector
Challenges include the high cost of SiC and GaN materials, supply chain disruptions impacting the availability of raw materials, and intense competition from established and emerging players. Stringent regulatory compliance requirements also pose challenges for manufacturers. These factors can influence the overall market growth and profitability.
Leading Players in the Power Electronics Market Market
- ROHM Co Ltd
- Infineon Technologies AG (Infineon Technologies AG)
- ABB Ltd (ABB Ltd)
- Mitsubishi Electric Corporation (Mitsubishi Electric Corporation)
- Toshiba Corporation (Toshiba Corporation)
- STMicroelectronics NV (STMicroelectronics NV)
- Texas Instruments Inc (Texas Instruments Inc)
- ON Semiconductor Corporation (ON Semiconductor Corporation)
- Vishay Intertechnologies Inc (Vishay Intertechnologies Inc)
- Renesas electronic corporation (Renesas Electronic Corporation)
Key Developments in Power Electronics Market Sector
- May 2023: Infineon Technologies AG launched its OptiMOS 740 V MOSFET family for automotive applications. This launch expands Infineon's product portfolio in the high-growth automotive sector and strengthens its competitive position.
- May 2023: Vishay Intertechnology, Inc. introduced 17 new third-generation 650 V silicon carbide Schottky diodes. This enhances Vishay's product offerings in the high-efficiency power electronics market, focusing on reliability and efficiency.
- May 2023: Toshiba Electronics Europe launched a new 150V N-channel power MOSFET. This reinforces Toshiba's presence in the high-performance power supply market, targeting communication base stations and industrial applications.
Strategic Power Electronics Market Market Outlook
The Power Electronics Market is poised for continued strong growth, driven by sustained demand from key sectors, including automotive, renewable energy, and industrial automation. Strategic opportunities exist in the development and adoption of advanced materials, such as SiC and GaN, as well as in the expansion into emerging markets. Companies adopting innovative strategies to improve efficiency, enhance product performance, and manage supply chain complexities will be better positioned to capitalize on future growth opportunities.
Power Electronics Market Segmentation
-
1. Component
- 1.1. Discrete
- 1.2. Module
-
2. Material
- 2.1. Silicon/Germanium
- 2.2. Silicon Carbide (SiC)
- 2.3. Gallium Nitride (GaN)
-
3. End-user Industry
- 3.1. Automotive
- 3.2. Consumer Electronics
- 3.3. IT and Telecommunication
- 3.4. Military and Aerospace
- 3.5. Industrial
- 3.6. Energy and Power
- 3.7. Other End-user Industries
Power Electronics Market Segmentation By Geography
- 1. North America
- 2. Europe
- 3. Asia Pacific
- 4. Latin America
- 5. Middle East and Africa
Power Electronics Market REPORT HIGHLIGHTS
| Aspects | Details |
|---|---|
| Study Period | 2019-2033 |
| Base Year | 2024 |
| Estimated Year | 2025 |
| Forecast Period | 2025-2033 |
| Historical Period | 2019-2024 |
| Growth Rate | CAGR of 4.53% from 2019-2033 |
| Segmentation |
|
Table of Contents
- 1. Introduction
- 1.1. Research Scope
- 1.2. Market Segmentation
- 1.3. Research Methodology
- 1.4. Definitions and Assumptions
- 2. Executive Summary
- 2.1. Introduction
- 3. Market Dynamics
- 3.1. Introduction
- 3.2. Market Drivers
- 3.2.1. Rising Demand for High-energy and Power-efficient Devices in the Electronics Segment; Demand for Green Energy Power Generation Drives
- 3.3. Market Restrains
- 3.3.1. Rising Demand for Integrated Circuits
- 3.4. Market Trends
- 3.4.1. Rising Demand for High-energy and Power-efficient Devices in the Electronics Segment is Expected to Drive the Market Growth
- 4. Market Factor Analysis
- 4.1. Porters Five Forces
- 4.2. Supply/Value Chain
- 4.3. PESTEL analysis
- 4.4. Market Entropy
- 4.5. Patent/Trademark Analysis
- 5. Global Power Electronics Market Analysis, Insights and Forecast, 2019-2031
- 5.1. Market Analysis, Insights and Forecast - by Component
- 5.1.1. Discrete
- 5.1.2. Module
- 5.2. Market Analysis, Insights and Forecast - by Material
- 5.2.1. Silicon/Germanium
- 5.2.2. Silicon Carbide (SiC)
- 5.2.3. Gallium Nitride (GaN)
- 5.3. Market Analysis, Insights and Forecast - by End-user Industry
- 5.3.1. Automotive
- 5.3.2. Consumer Electronics
- 5.3.3. IT and Telecommunication
- 5.3.4. Military and Aerospace
- 5.3.5. Industrial
- 5.3.6. Energy and Power
- 5.3.7. Other End-user Industries
- 5.4. Market Analysis, Insights and Forecast - by Region
- 5.4.1. North America
- 5.4.2. Europe
- 5.4.3. Asia Pacific
- 5.4.4. Latin America
- 5.4.5. Middle East and Africa
- 5.1. Market Analysis, Insights and Forecast - by Component
- 6. North America Power Electronics Market Analysis, Insights and Forecast, 2019-2031
- 6.1. Market Analysis, Insights and Forecast - by Component
- 6.1.1. Discrete
- 6.1.2. Module
- 6.2. Market Analysis, Insights and Forecast - by Material
- 6.2.1. Silicon/Germanium
- 6.2.2. Silicon Carbide (SiC)
- 6.2.3. Gallium Nitride (GaN)
- 6.3. Market Analysis, Insights and Forecast - by End-user Industry
- 6.3.1. Automotive
- 6.3.2. Consumer Electronics
- 6.3.3. IT and Telecommunication
- 6.3.4. Military and Aerospace
- 6.3.5. Industrial
- 6.3.6. Energy and Power
- 6.3.7. Other End-user Industries
- 6.1. Market Analysis, Insights and Forecast - by Component
- 7. Europe Power Electronics Market Analysis, Insights and Forecast, 2019-2031
- 7.1. Market Analysis, Insights and Forecast - by Component
- 7.1.1. Discrete
- 7.1.2. Module
- 7.2. Market Analysis, Insights and Forecast - by Material
- 7.2.1. Silicon/Germanium
- 7.2.2. Silicon Carbide (SiC)
- 7.2.3. Gallium Nitride (GaN)
- 7.3. Market Analysis, Insights and Forecast - by End-user Industry
- 7.3.1. Automotive
- 7.3.2. Consumer Electronics
- 7.3.3. IT and Telecommunication
- 7.3.4. Military and Aerospace
- 7.3.5. Industrial
- 7.3.6. Energy and Power
- 7.3.7. Other End-user Industries
- 7.1. Market Analysis, Insights and Forecast - by Component
- 8. Asia Pacific Power Electronics Market Analysis, Insights and Forecast, 2019-2031
- 8.1. Market Analysis, Insights and Forecast - by Component
- 8.1.1. Discrete
- 8.1.2. Module
- 8.2. Market Analysis, Insights and Forecast - by Material
- 8.2.1. Silicon/Germanium
- 8.2.2. Silicon Carbide (SiC)
- 8.2.3. Gallium Nitride (GaN)
- 8.3. Market Analysis, Insights and Forecast - by End-user Industry
- 8.3.1. Automotive
- 8.3.2. Consumer Electronics
- 8.3.3. IT and Telecommunication
- 8.3.4. Military and Aerospace
- 8.3.5. Industrial
- 8.3.6. Energy and Power
- 8.3.7. Other End-user Industries
- 8.1. Market Analysis, Insights and Forecast - by Component
- 9. Latin America Power Electronics Market Analysis, Insights and Forecast, 2019-2031
- 9.1. Market Analysis, Insights and Forecast - by Component
- 9.1.1. Discrete
- 9.1.2. Module
- 9.2. Market Analysis, Insights and Forecast - by Material
- 9.2.1. Silicon/Germanium
- 9.2.2. Silicon Carbide (SiC)
- 9.2.3. Gallium Nitride (GaN)
- 9.3. Market Analysis, Insights and Forecast - by End-user Industry
- 9.3.1. Automotive
- 9.3.2. Consumer Electronics
- 9.3.3. IT and Telecommunication
- 9.3.4. Military and Aerospace
- 9.3.5. Industrial
- 9.3.6. Energy and Power
- 9.3.7. Other End-user Industries
- 9.1. Market Analysis, Insights and Forecast - by Component
- 10. Middle East and Africa Power Electronics Market Analysis, Insights and Forecast, 2019-2031
- 10.1. Market Analysis, Insights and Forecast - by Component
- 10.1.1. Discrete
- 10.1.2. Module
- 10.2. Market Analysis, Insights and Forecast - by Material
- 10.2.1. Silicon/Germanium
- 10.2.2. Silicon Carbide (SiC)
- 10.2.3. Gallium Nitride (GaN)
- 10.3. Market Analysis, Insights and Forecast - by End-user Industry
- 10.3.1. Automotive
- 10.3.2. Consumer Electronics
- 10.3.3. IT and Telecommunication
- 10.3.4. Military and Aerospace
- 10.3.5. Industrial
- 10.3.6. Energy and Power
- 10.3.7. Other End-user Industries
- 10.1. Market Analysis, Insights and Forecast - by Component
- 11. North America Power Electronics Market Analysis, Insights and Forecast, 2019-2031
- 11.1. Market Analysis, Insights and Forecast - By Country/Sub-region
- 11.1.1.
- 12. Europe Power Electronics Market Analysis, Insights and Forecast, 2019-2031
- 12.1. Market Analysis, Insights and Forecast - By Country/Sub-region
- 12.1.1.
- 13. Asia Pacific Power Electronics Market Analysis, Insights and Forecast, 2019-2031
- 13.1. Market Analysis, Insights and Forecast - By Country/Sub-region
- 13.1.1.
- 14. Latin America Power Electronics Market Analysis, Insights and Forecast, 2019-2031
- 14.1. Market Analysis, Insights and Forecast - By Country/Sub-region
- 14.1.1.
- 15. Middle East and Africa Power Electronics Market Analysis, Insights and Forecast, 2019-2031
- 15.1. Market Analysis, Insights and Forecast - By Country/Sub-region
- 15.1.1.
- 16. Competitive Analysis
- 16.1. Global Market Share Analysis 2024
- 16.2. Company Profiles
- 16.2.1 ROHM Co Ltd
- 16.2.1.1. Overview
- 16.2.1.2. Products
- 16.2.1.3. SWOT Analysis
- 16.2.1.4. Recent Developments
- 16.2.1.5. Financials (Based on Availability)
- 16.2.2 Infineon Technologies AG
- 16.2.2.1. Overview
- 16.2.2.2. Products
- 16.2.2.3. SWOT Analysis
- 16.2.2.4. Recent Developments
- 16.2.2.5. Financials (Based on Availability)
- 16.2.3 ABB Ltd
- 16.2.3.1. Overview
- 16.2.3.2. Products
- 16.2.3.3. SWOT Analysis
- 16.2.3.4. Recent Developments
- 16.2.3.5. Financials (Based on Availability)
- 16.2.4 Mitsubishi Electric Corporation*List Not Exhaustive
- 16.2.4.1. Overview
- 16.2.4.2. Products
- 16.2.4.3. SWOT Analysis
- 16.2.4.4. Recent Developments
- 16.2.4.5. Financials (Based on Availability)
- 16.2.5 Toshiba Corporation
- 16.2.5.1. Overview
- 16.2.5.2. Products
- 16.2.5.3. SWOT Analysis
- 16.2.5.4. Recent Developments
- 16.2.5.5. Financials (Based on Availability)
- 16.2.6 STMicroelectronics NV
- 16.2.6.1. Overview
- 16.2.6.2. Products
- 16.2.6.3. SWOT Analysis
- 16.2.6.4. Recent Developments
- 16.2.6.5. Financials (Based on Availability)
- 16.2.7 Texas instruments Inc
- 16.2.7.1. Overview
- 16.2.7.2. Products
- 16.2.7.3. SWOT Analysis
- 16.2.7.4. Recent Developments
- 16.2.7.5. Financials (Based on Availability)
- 16.2.8 ON Semiconductor Corporation
- 16.2.8.1. Overview
- 16.2.8.2. Products
- 16.2.8.3. SWOT Analysis
- 16.2.8.4. Recent Developments
- 16.2.8.5. Financials (Based on Availability)
- 16.2.9 Vishay Intertechnologies Inc
- 16.2.9.1. Overview
- 16.2.9.2. Products
- 16.2.9.3. SWOT Analysis
- 16.2.9.4. Recent Developments
- 16.2.9.5. Financials (Based on Availability)
- 16.2.10 Renesas electronic corporation
- 16.2.10.1. Overview
- 16.2.10.2. Products
- 16.2.10.3. SWOT Analysis
- 16.2.10.4. Recent Developments
- 16.2.10.5. Financials (Based on Availability)
- 16.2.1 ROHM Co Ltd
List of Figures
- Figure 1: Global Power Electronics Market Revenue Breakdown (Million, %) by Region 2024 & 2032
- Figure 2: North America Power Electronics Market Revenue (Million), by Country 2024 & 2032
- Figure 3: North America Power Electronics Market Revenue Share (%), by Country 2024 & 2032
- Figure 4: Europe Power Electronics Market Revenue (Million), by Country 2024 & 2032
- Figure 5: Europe Power Electronics Market Revenue Share (%), by Country 2024 & 2032
- Figure 6: Asia Pacific Power Electronics Market Revenue (Million), by Country 2024 & 2032
- Figure 7: Asia Pacific Power Electronics Market Revenue Share (%), by Country 2024 & 2032
- Figure 8: Latin America Power Electronics Market Revenue (Million), by Country 2024 & 2032
- Figure 9: Latin America Power Electronics Market Revenue Share (%), by Country 2024 & 2032
- Figure 10: Middle East and Africa Power Electronics Market Revenue (Million), by Country 2024 & 2032
- Figure 11: Middle East and Africa Power Electronics Market Revenue Share (%), by Country 2024 & 2032
- Figure 12: North America Power Electronics Market Revenue (Million), by Component 2024 & 2032
- Figure 13: North America Power Electronics Market Revenue Share (%), by Component 2024 & 2032
- Figure 14: North America Power Electronics Market Revenue (Million), by Material 2024 & 2032
- Figure 15: North America Power Electronics Market Revenue Share (%), by Material 2024 & 2032
- Figure 16: North America Power Electronics Market Revenue (Million), by End-user Industry 2024 & 2032
- Figure 17: North America Power Electronics Market Revenue Share (%), by End-user Industry 2024 & 2032
- Figure 18: North America Power Electronics Market Revenue (Million), by Country 2024 & 2032
- Figure 19: North America Power Electronics Market Revenue Share (%), by Country 2024 & 2032
- Figure 20: Europe Power Electronics Market Revenue (Million), by Component 2024 & 2032
- Figure 21: Europe Power Electronics Market Revenue Share (%), by Component 2024 & 2032
- Figure 22: Europe Power Electronics Market Revenue (Million), by Material 2024 & 2032
- Figure 23: Europe Power Electronics Market Revenue Share (%), by Material 2024 & 2032
- Figure 24: Europe Power Electronics Market Revenue (Million), by End-user Industry 2024 & 2032
- Figure 25: Europe Power Electronics Market Revenue Share (%), by End-user Industry 2024 & 2032
- Figure 26: Europe Power Electronics Market Revenue (Million), by Country 2024 & 2032
- Figure 27: Europe Power Electronics Market Revenue Share (%), by Country 2024 & 2032
- Figure 28: Asia Pacific Power Electronics Market Revenue (Million), by Component 2024 & 2032
- Figure 29: Asia Pacific Power Electronics Market Revenue Share (%), by Component 2024 & 2032
- Figure 30: Asia Pacific Power Electronics Market Revenue (Million), by Material 2024 & 2032
- Figure 31: Asia Pacific Power Electronics Market Revenue Share (%), by Material 2024 & 2032
- Figure 32: Asia Pacific Power Electronics Market Revenue (Million), by End-user Industry 2024 & 2032
- Figure 33: Asia Pacific Power Electronics Market Revenue Share (%), by End-user Industry 2024 & 2032
- Figure 34: Asia Pacific Power Electronics Market Revenue (Million), by Country 2024 & 2032
- Figure 35: Asia Pacific Power Electronics Market Revenue Share (%), by Country 2024 & 2032
- Figure 36: Latin America Power Electronics Market Revenue (Million), by Component 2024 & 2032
- Figure 37: Latin America Power Electronics Market Revenue Share (%), by Component 2024 & 2032
- Figure 38: Latin America Power Electronics Market Revenue (Million), by Material 2024 & 2032
- Figure 39: Latin America Power Electronics Market Revenue Share (%), by Material 2024 & 2032
- Figure 40: Latin America Power Electronics Market Revenue (Million), by End-user Industry 2024 & 2032
- Figure 41: Latin America Power Electronics Market Revenue Share (%), by End-user Industry 2024 & 2032
- Figure 42: Latin America Power Electronics Market Revenue (Million), by Country 2024 & 2032
- Figure 43: Latin America Power Electronics Market Revenue Share (%), by Country 2024 & 2032
- Figure 44: Middle East and Africa Power Electronics Market Revenue (Million), by Component 2024 & 2032
- Figure 45: Middle East and Africa Power Electronics Market Revenue Share (%), by Component 2024 & 2032
- Figure 46: Middle East and Africa Power Electronics Market Revenue (Million), by Material 2024 & 2032
- Figure 47: Middle East and Africa Power Electronics Market Revenue Share (%), by Material 2024 & 2032
- Figure 48: Middle East and Africa Power Electronics Market Revenue (Million), by End-user Industry 2024 & 2032
- Figure 49: Middle East and Africa Power Electronics Market Revenue Share (%), by End-user Industry 2024 & 2032
- Figure 50: Middle East and Africa Power Electronics Market Revenue (Million), by Country 2024 & 2032
- Figure 51: Middle East and Africa Power Electronics Market Revenue Share (%), by Country 2024 & 2032
List of Tables
- Table 1: Global Power Electronics Market Revenue Million Forecast, by Region 2019 & 2032
- Table 2: Global Power Electronics Market Revenue Million Forecast, by Component 2019 & 2032
- Table 3: Global Power Electronics Market Revenue Million Forecast, by Material 2019 & 2032
- Table 4: Global Power Electronics Market Revenue Million Forecast, by End-user Industry 2019 & 2032
- Table 5: Global Power Electronics Market Revenue Million Forecast, by Region 2019 & 2032
- Table 6: Global Power Electronics Market Revenue Million Forecast, by Country 2019 & 2032
- Table 7: Power Electronics Market Revenue (Million) Forecast, by Application 2019 & 2032
- Table 8: Global Power Electronics Market Revenue Million Forecast, by Country 2019 & 2032
- Table 9: Power Electronics Market Revenue (Million) Forecast, by Application 2019 & 2032
- Table 10: Global Power Electronics Market Revenue Million Forecast, by Country 2019 & 2032
- Table 11: Power Electronics Market Revenue (Million) Forecast, by Application 2019 & 2032
- Table 12: Global Power Electronics Market Revenue Million Forecast, by Country 2019 & 2032
- Table 13: Power Electronics Market Revenue (Million) Forecast, by Application 2019 & 2032
- Table 14: Global Power Electronics Market Revenue Million Forecast, by Country 2019 & 2032
- Table 15: Power Electronics Market Revenue (Million) Forecast, by Application 2019 & 2032
- Table 16: Global Power Electronics Market Revenue Million Forecast, by Component 2019 & 2032
- Table 17: Global Power Electronics Market Revenue Million Forecast, by Material 2019 & 2032
- Table 18: Global Power Electronics Market Revenue Million Forecast, by End-user Industry 2019 & 2032
- Table 19: Global Power Electronics Market Revenue Million Forecast, by Country 2019 & 2032
- Table 20: Global Power Electronics Market Revenue Million Forecast, by Component 2019 & 2032
- Table 21: Global Power Electronics Market Revenue Million Forecast, by Material 2019 & 2032
- Table 22: Global Power Electronics Market Revenue Million Forecast, by End-user Industry 2019 & 2032
- Table 23: Global Power Electronics Market Revenue Million Forecast, by Country 2019 & 2032
- Table 24: Global Power Electronics Market Revenue Million Forecast, by Component 2019 & 2032
- Table 25: Global Power Electronics Market Revenue Million Forecast, by Material 2019 & 2032
- Table 26: Global Power Electronics Market Revenue Million Forecast, by End-user Industry 2019 & 2032
- Table 27: Global Power Electronics Market Revenue Million Forecast, by Country 2019 & 2032
- Table 28: Global Power Electronics Market Revenue Million Forecast, by Component 2019 & 2032
- Table 29: Global Power Electronics Market Revenue Million Forecast, by Material 2019 & 2032
- Table 30: Global Power Electronics Market Revenue Million Forecast, by End-user Industry 2019 & 2032
- Table 31: Global Power Electronics Market Revenue Million Forecast, by Country 2019 & 2032
- Table 32: Global Power Electronics Market Revenue Million Forecast, by Component 2019 & 2032
- Table 33: Global Power Electronics Market Revenue Million Forecast, by Material 2019 & 2032
- Table 34: Global Power Electronics Market Revenue Million Forecast, by End-user Industry 2019 & 2032
- Table 35: Global Power Electronics Market Revenue Million Forecast, by Country 2019 & 2032
Frequently Asked Questions
1. What is the projected Compound Annual Growth Rate (CAGR) of the Power Electronics Market?
The projected CAGR is approximately 4.53%.
2. Which companies are prominent players in the Power Electronics Market?
Key companies in the market include ROHM Co Ltd, Infineon Technologies AG, ABB Ltd, Mitsubishi Electric Corporation*List Not Exhaustive, Toshiba Corporation, STMicroelectronics NV, Texas instruments Inc, ON Semiconductor Corporation, Vishay Intertechnologies Inc, Renesas electronic corporation.
3. What are the main segments of the Power Electronics Market?
The market segments include Component, Material, End-user Industry.
4. Can you provide details about the market size?
The market size is estimated to be USD XX Million as of 2022.
5. What are some drivers contributing to market growth?
Rising Demand for High-energy and Power-efficient Devices in the Electronics Segment; Demand for Green Energy Power Generation Drives.
6. What are the notable trends driving market growth?
Rising Demand for High-energy and Power-efficient Devices in the Electronics Segment is Expected to Drive the Market Growth.
7. Are there any restraints impacting market growth?
Rising Demand for Integrated Circuits.
8. Can you provide examples of recent developments in the market?
May 2023: Infineon Technologies AG has launched its latest generation of power MOSFETs for automotive applications, the OptiMOS 740 V MOSFET family, in a variety of lead-free and rugged performance packages. The new family combines 300 mm thin wafer technology with innovative packaging to offer significant performance benefits in a small package. This makes this MOSFET ideal for all standard and future 40 V automotive MOSFET applications, such as braking systems, electric power steering, circuit breakers, and new zone architectures.
9. What pricing options are available for accessing the report?
Pricing options include single-user, multi-user, and enterprise licenses priced at USD 4750, USD 5250, and USD 8750 respectively.
10. Is the market size provided in terms of value or volume?
The market size is provided in terms of value, measured in Million.
11. Are there any specific market keywords associated with the report?
Yes, the market keyword associated with the report is "Power Electronics Market," which aids in identifying and referencing the specific market segment covered.
12. How do I determine which pricing option suits my needs best?
The pricing options vary based on user requirements and access needs. Individual users may opt for single-user licenses, while businesses requiring broader access may choose multi-user or enterprise licenses for cost-effective access to the report.
13. Are there any additional resources or data provided in the Power Electronics Market report?
While the report offers comprehensive insights, it's advisable to review the specific contents or supplementary materials provided to ascertain if additional resources or data are available.
14. How can I stay updated on further developments or reports in the Power Electronics Market?
To stay informed about further developments, trends, and reports in the Power Electronics Market, consider subscribing to industry newsletters, following relevant companies and organizations, or regularly checking reputable industry news sources and publications.
Methodology
Step 1 - Identification of Relevant Samples Size from Population Database


Step 2 - Approaches for Defining Global Market Size (Value, Volume* & Price*)

Note*: In applicable scenarios
Step 3 - Data Sources
Primary Research
- Web Analytics
- Survey Reports
- Research Institute
- Latest Research Reports
- Opinion Leaders
Secondary Research
- Annual Reports
- White Paper
- Latest Press Release
- Industry Association
- Paid Database
- Investor Presentations

Step 4 - Data Triangulation
Involves using different sources of information in order to increase the validity of a study
These sources are likely to be stakeholders in a program - participants, other researchers, program staff, other community members, and so on.
Then we put all data in single framework & apply various statistical tools to find out the dynamic on the market.
During the analysis stage, feedback from the stakeholder groups would be compared to determine areas of agreement as well as areas of divergence


