
Key Insights
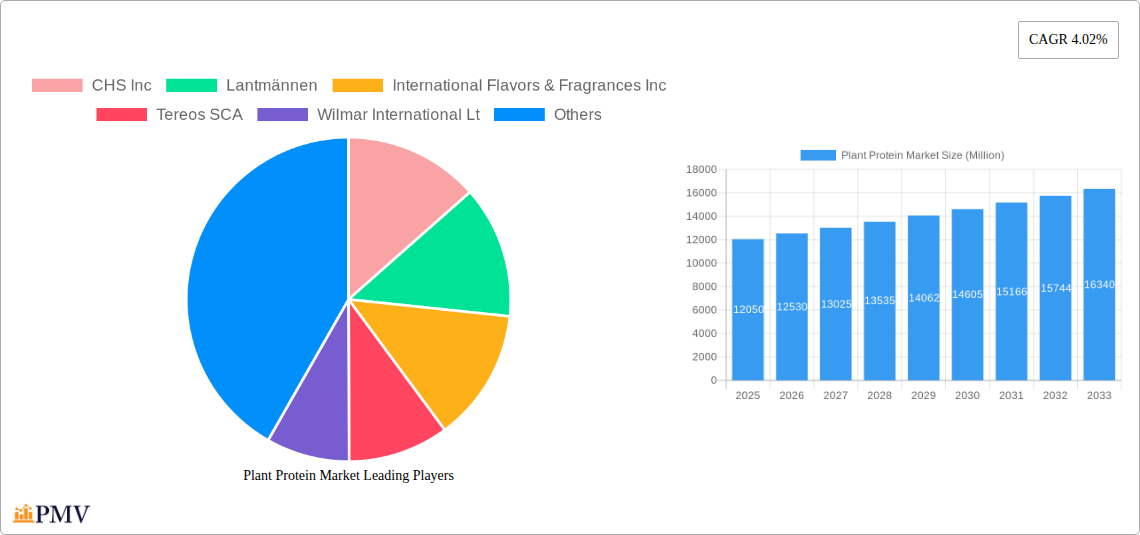
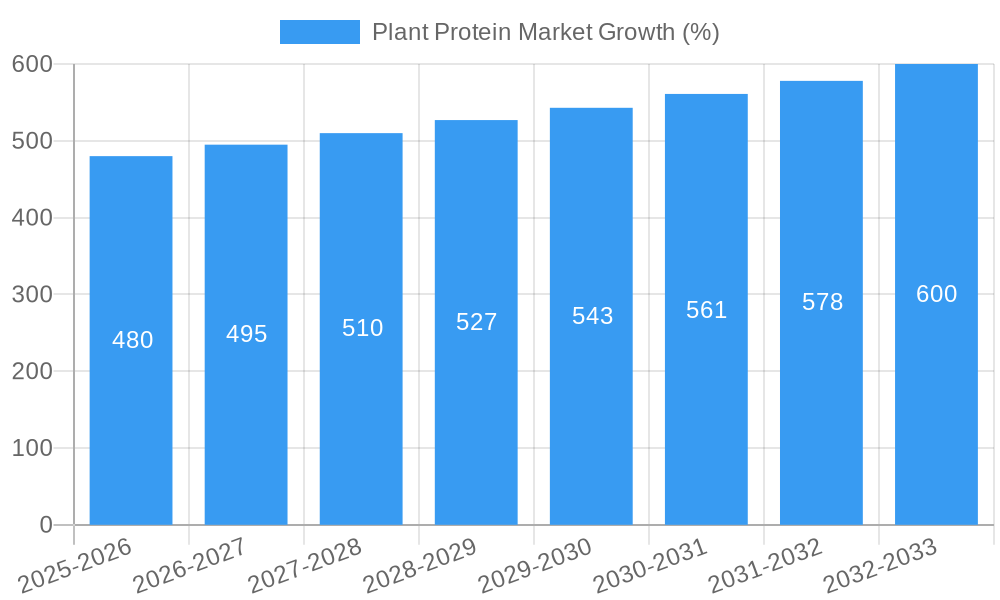
The plant-based protein market, currently valued at $12,050 million in 2025, is projected to experience robust growth, driven by several key factors. Increasing consumer awareness of health and wellness, coupled with the rising popularity of vegan and vegetarian diets, is fueling demand for plant-based protein sources. The shift towards sustainable and ethical food choices is further bolstering market expansion. Growth is also being propelled by the increasing use of plant proteins in diverse applications, including food and beverages, animal feed, and sports nutrition. The functional properties of plant proteins, such as their high protein content, fiber, and essential amino acids, make them attractive alternatives to traditional animal-based proteins. Soy protein and pea protein currently dominate the market, however, other segments like hemp and potato protein are experiencing significant growth due to their unique nutritional profiles and perceived health benefits. While the market faces some restraints, such as fluctuating raw material prices and the need for improved processing technologies to enhance taste and texture, the overall growth trajectory remains positive.
The market is segmented by protein type (hemp, pea, potato, rice, soy, wheat, and others) and end-user (animal feed, food and beverages, and sports/performance nutrition). North America and Europe currently hold significant market share, but the Asia-Pacific region is anticipated to witness substantial growth in the coming years, driven by rising disposable incomes and changing dietary habits. Major players in the market, including CHS Inc., Lantmännen, and Archer Daniels Midland Company, are investing heavily in research and development to improve plant protein quality and expand their product portfolio. This competitive landscape drives innovation and ensures a steady supply of diverse plant-based protein products to meet growing global demand. The projected CAGR of 4.02% indicates a steady and substantial expansion of the market through 2033, with significant opportunities for both established players and new entrants.
Plant Protein Market: A Comprehensive Report (2019-2033)
This in-depth report provides a comprehensive analysis of the global Plant Protein Market, offering invaluable insights for stakeholders across the food and beverage, animal feed, and sports nutrition industries. Covering the period from 2019 to 2033, with a focus on 2025, this report meticulously examines market dynamics, competitive landscapes, and future growth trajectories. The global Plant Protein Market is estimated to reach xx Million by 2025 and is projected to witness significant growth during the forecast period (2025-2033).
Plant Protein Market Market Structure & Competitive Dynamics
The Plant Protein Market exhibits a moderately concentrated structure, with several large multinational corporations holding significant market share. Key players such as Archer Daniels Midland Company, Bunge Limited, and Cargill (not explicitly listed but a major player) compete intensely, driving innovation and consolidation. The market is characterized by a dynamic innovation ecosystem, with continuous development of new plant-based protein sources and formulations to meet evolving consumer demands. Regulatory frameworks vary across regions, impacting product approvals and labeling requirements. Substitute products, such as traditional animal proteins, pose a significant competitive challenge, though the market for plant-based alternatives is rapidly expanding.
Mergers and acquisitions (M&A) activities are frequent, reflecting the industry's ongoing consolidation and expansion. Recent deals, such as BENEO's acquisition of Meatless BV, highlight the strategic importance of expanding product portfolios and technological capabilities. The average M&A deal value in the last 5 years was approximately xx Million, further indicating the robust investment in the sector.
- Market Concentration: Moderately concentrated, with top 5 players holding approximately xx% market share.
- Innovation: Focus on novel protein sources (e.g., pea, rice, hemp), improved functionalities (e.g., texture, solubility), and sustainable production methods.
- Regulatory Landscape: Varied across regions, requiring careful navigation of labeling and approval processes.
- Product Substitutes: Traditional animal proteins remain a key competitor.
- M&A Activity: High, driven by expansion strategies and technological acquisitions.
Plant Protein Market Industry Trends & Insights
The Plant Protein Market is experiencing robust growth, driven by several key factors. Increasing consumer awareness of the health benefits of plant-based diets, coupled with rising demand for sustainable and ethical food choices, is fueling market expansion. Technological advancements in protein extraction and processing are improving the functionality and taste of plant-based proteins, making them increasingly appealing to consumers. The growing popularity of veganism and vegetarianism further contributes to the market's expansion. The shift toward plant-based diets is particularly prominent in developed regions, though developing countries are also witnessing increasing adoption. The compound annual growth rate (CAGR) for the market during the historical period (2019-2024) was approximately xx%, and it's projected to reach xx% during the forecast period (2025-2033). Market penetration of plant-based proteins in the food and beverage sector is gradually increasing, with xx% estimated market penetration in 2025.
Dominant Markets & Segments in Plant Protein Market
The Plant Protein Market is experiencing significant growth across various regions, with North America and Europe currently leading the market. However, Asia-Pacific is expected to demonstrate substantial growth in the coming years, fueled by rising disposable incomes and increasing adoption of plant-based diets.
Dominant Segments:
- Protein Type: Soy protein maintains a dominant position, owing to its established market presence and affordability. However, pea protein is witnessing rapid growth due to its excellent nutritional profile and functional properties.
- End User: The Food and Beverages segment currently holds the largest market share, driven by increasing demand for plant-based meat alternatives, dairy products, and other food applications. The Sports/Performance Nutrition segment is exhibiting strong growth, driven by the rising popularity of plant-based protein supplements.
Key Drivers:
- Economic Policies: Government initiatives promoting plant-based diets and sustainable agriculture are driving market growth.
- Infrastructure: Improved infrastructure for food processing and distribution networks supports market expansion.
- Consumer Preferences: Growing preference for healthy, sustainable, and ethical food choices is a significant driver.
Plant Protein Market Product Innovations
Recent years have witnessed significant product innovations in the plant protein market. Manufacturers are focusing on developing plant-based proteins with improved functionalities, such as enhanced texture, solubility, and flavor profiles. This has led to the creation of novel meat substitutes, dairy alternatives, and protein supplements that closely mimic the sensory experience of traditional animal-based products. Technological advancements in protein extraction, modification, and formulation are critical in enhancing the overall quality and appeal of plant-based proteins. These innovations are crucial for expanding market penetration and capturing a larger share of the consumer market.
Report Segmentation & Scope
This report segments the Plant Protein Market based on protein type and end-user application.
Protein Type: Hemp Protein, Pea Protein, Potato Protein, Rice Protein, Soy Protein, Wheat Protein, Other Plant Protein. Each segment’s market size, growth rate, and competitive landscape are analyzed in detail, providing valuable insights into market dynamics. For instance, the soy protein segment is projected to maintain its dominance, but pea protein is expected to show the highest growth rate.
End User: Animal Feed, Food and Beverages, Sport/Performance Nutrition. Each segment’s market size, growth potential, and key trends are discussed, focusing on factors driving consumption and specific applications.
Key Drivers of Plant Protein Market Growth
The Plant Protein Market's growth is driven by several factors:
- Health and Wellness: Growing awareness of the health benefits of plant-based diets.
- Sustainability Concerns: Increasing demand for environmentally friendly food choices.
- Technological Advancements: Improved protein extraction and processing techniques.
- Regulatory Support: Government policies supporting plant-based food production.
- Rising Vegan and Vegetarian Population: A significant rise in consumers adopting plant-based diets.
Challenges in the Plant Protein Market Sector
Despite significant growth potential, the Plant Protein Market faces several challenges:
- Cost Competitiveness: Plant-based proteins can be more expensive than traditional animal proteins.
- Allergenicity: Certain plant proteins can cause allergic reactions in some individuals.
- Functional Limitations: Some plant proteins may not possess the same functional properties as animal proteins.
- Supply Chain Fluctuations: Variations in crop yields can impact the availability and cost of plant-based proteins.
Leading Players in the Plant Protein Market Market
- CHS Inc
- Lantmännen
- International Flavors & Fragrances Inc
- Tereos SCA
- Wilmar International Lt
- Archer Daniels Midland Company
- Bunge Limited
- Fuji Oil Group
- Kerry Group PLC
- Südzucker AG
- Roquette Frère
Key Developments in Plant Protein Market Sector
- June 2022: Roquette launched its Nutralys rice protein line, targeting meat substitute applications.
- May 2022: BENEO (a Südzucker subsidiary) acquired Meatless BV, expanding its texturizing solutions for meat alternatives.
- January 2022: Kerry opened a new facility in Jeddah, Saudi Arabia, boosting its production capacity in the Middle East.
Strategic Plant Protein Market Market Outlook
The Plant Protein Market is poised for significant expansion, driven by continued consumer demand for healthy and sustainable food choices. Strategic opportunities exist for companies to innovate in product development, improve supply chain efficiency, and expand into new geographic markets. Investing in research and development to enhance the functionality and cost-effectiveness of plant-based proteins is crucial for long-term success. Furthermore, exploring partnerships and collaborations across the value chain can significantly enhance market penetration and profitability.
Plant Protein Market Segmentation
-
1. Protein Type
- 1.1. Hemp Protein
- 1.2. Pea Protein
- 1.3. Potato Protein
- 1.4. Rice Protein
- 1.5. Soy Protein
- 1.6. Wheat Protein
- 1.7. Other Plant Protein
-
2. End User
- 2.1. Animal Feed
-
2.2. Food and Beverages
-
2.2.1. By Sub End User
- 2.2.1.1. Bakery
- 2.2.1.2. Breakfast Cereals
- 2.2.1.3. Condiments/Sauces
- 2.2.1.4. Confectionery
- 2.2.1.5. Dairy and Dairy Alternative Products
- 2.2.1.6. Meat/Poultry/Seafood and Meat Alternative Products
- 2.2.1.7. RTE/RTC Food Products
- 2.2.1.8. Snacks
-
2.2.1. By Sub End User
- 2.3. Personal Care and Cosmetics
-
2.4. Supplements
- 2.4.1. Baby Food and Infant Formula
- 2.4.2. Elderly Nutrition and Medical Nutrition
- 2.4.3. Sport/Performance Nutrition
Plant Protein Market Segmentation By Geography
-
1. North America
- 1.1. United States
- 1.2. Canada
- 1.3. Mexico
-
2. South America
- 2.1. Brazil
- 2.2. Argentina
- 2.3. Rest of South America
-
3. Europe
- 3.1. United Kingdom
- 3.2. Germany
- 3.3. France
- 3.4. Italy
- 3.5. Spain
- 3.6. Russia
- 3.7. Benelux
- 3.8. Nordics
- 3.9. Rest of Europe
-
4. Middle East & Africa
- 4.1. Turkey
- 4.2. Israel
- 4.3. GCC
- 4.4. North Africa
- 4.5. South Africa
- 4.6. Rest of Middle East & Africa
-
5. Asia Pacific
- 5.1. China
- 5.2. India
- 5.3. Japan
- 5.4. South Korea
- 5.5. ASEAN
- 5.6. Oceania
- 5.7. Rest of Asia Pacific

Plant Protein Market REPORT HIGHLIGHTS
| Aspects | Details |
|---|---|
| Study Period | 2019-2033 |
| Base Year | 2024 |
| Estimated Year | 2025 |
| Forecast Period | 2025-2033 |
| Historical Period | 2019-2024 |
| Growth Rate | CAGR of 4.02% from 2019-2033 |
| Segmentation |
|
Table of Contents
- 1. Introduction
- 1.1. Research Scope
- 1.2. Market Segmentation
- 1.3. Research Methodology
- 1.4. Definitions and Assumptions
- 2. Executive Summary
- 2.1. Introduction
- 3. Market Dynamics
- 3.1. Introduction
- 3.2. Market Drivers
- 3.2.1. Increasing awareness towards fitness among consumers; Demand for convenient fortified foods
- 3.3. Market Restrains
- 3.3.1. Prevalence of allergen intolerance among the consumers
- 3.4. Market Trends
- 3.4.1. OTHER KEY INDUSTRY TRENDS COVERED IN THE REPORT
- 4. Market Factor Analysis
- 4.1. Porters Five Forces
- 4.2. Supply/Value Chain
- 4.3. PESTEL analysis
- 4.4. Market Entropy
- 4.5. Patent/Trademark Analysis
- 5. Global Plant Protein Market Analysis, Insights and Forecast, 2019-2031
- 5.1. Market Analysis, Insights and Forecast - by Protein Type
- 5.1.1. Hemp Protein
- 5.1.2. Pea Protein
- 5.1.3. Potato Protein
- 5.1.4. Rice Protein
- 5.1.5. Soy Protein
- 5.1.6. Wheat Protein
- 5.1.7. Other Plant Protein
- 5.2. Market Analysis, Insights and Forecast - by End User
- 5.2.1. Animal Feed
- 5.2.2. Food and Beverages
- 5.2.2.1. By Sub End User
- 5.2.2.1.1. Bakery
- 5.2.2.1.2. Breakfast Cereals
- 5.2.2.1.3. Condiments/Sauces
- 5.2.2.1.4. Confectionery
- 5.2.2.1.5. Dairy and Dairy Alternative Products
- 5.2.2.1.6. Meat/Poultry/Seafood and Meat Alternative Products
- 5.2.2.1.7. RTE/RTC Food Products
- 5.2.2.1.8. Snacks
- 5.2.2.1. By Sub End User
- 5.2.3. Personal Care and Cosmetics
- 5.2.4. Supplements
- 5.2.4.1. Baby Food and Infant Formula
- 5.2.4.2. Elderly Nutrition and Medical Nutrition
- 5.2.4.3. Sport/Performance Nutrition
- 5.3. Market Analysis, Insights and Forecast - by Region
- 5.3.1. North America
- 5.3.2. South America
- 5.3.3. Europe
- 5.3.4. Middle East & Africa
- 5.3.5. Asia Pacific
- 5.1. Market Analysis, Insights and Forecast - by Protein Type
- 6. North America Plant Protein Market Analysis, Insights and Forecast, 2019-2031
- 6.1. Market Analysis, Insights and Forecast - by Protein Type
- 6.1.1. Hemp Protein
- 6.1.2. Pea Protein
- 6.1.3. Potato Protein
- 6.1.4. Rice Protein
- 6.1.5. Soy Protein
- 6.1.6. Wheat Protein
- 6.1.7. Other Plant Protein
- 6.2. Market Analysis, Insights and Forecast - by End User
- 6.2.1. Animal Feed
- 6.2.2. Food and Beverages
- 6.2.2.1. By Sub End User
- 6.2.2.1.1. Bakery
- 6.2.2.1.2. Breakfast Cereals
- 6.2.2.1.3. Condiments/Sauces
- 6.2.2.1.4. Confectionery
- 6.2.2.1.5. Dairy and Dairy Alternative Products
- 6.2.2.1.6. Meat/Poultry/Seafood and Meat Alternative Products
- 6.2.2.1.7. RTE/RTC Food Products
- 6.2.2.1.8. Snacks
- 6.2.2.1. By Sub End User
- 6.2.3. Personal Care and Cosmetics
- 6.2.4. Supplements
- 6.2.4.1. Baby Food and Infant Formula
- 6.2.4.2. Elderly Nutrition and Medical Nutrition
- 6.2.4.3. Sport/Performance Nutrition
- 6.1. Market Analysis, Insights and Forecast - by Protein Type
- 7. South America Plant Protein Market Analysis, Insights and Forecast, 2019-2031
- 7.1. Market Analysis, Insights and Forecast - by Protein Type
- 7.1.1. Hemp Protein
- 7.1.2. Pea Protein
- 7.1.3. Potato Protein
- 7.1.4. Rice Protein
- 7.1.5. Soy Protein
- 7.1.6. Wheat Protein
- 7.1.7. Other Plant Protein
- 7.2. Market Analysis, Insights and Forecast - by End User
- 7.2.1. Animal Feed
- 7.2.2. Food and Beverages
- 7.2.2.1. By Sub End User
- 7.2.2.1.1. Bakery
- 7.2.2.1.2. Breakfast Cereals
- 7.2.2.1.3. Condiments/Sauces
- 7.2.2.1.4. Confectionery
- 7.2.2.1.5. Dairy and Dairy Alternative Products
- 7.2.2.1.6. Meat/Poultry/Seafood and Meat Alternative Products
- 7.2.2.1.7. RTE/RTC Food Products
- 7.2.2.1.8. Snacks
- 7.2.2.1. By Sub End User
- 7.2.3. Personal Care and Cosmetics
- 7.2.4. Supplements
- 7.2.4.1. Baby Food and Infant Formula
- 7.2.4.2. Elderly Nutrition and Medical Nutrition
- 7.2.4.3. Sport/Performance Nutrition
- 7.1. Market Analysis, Insights and Forecast - by Protein Type
- 8. Europe Plant Protein Market Analysis, Insights and Forecast, 2019-2031
- 8.1. Market Analysis, Insights and Forecast - by Protein Type
- 8.1.1. Hemp Protein
- 8.1.2. Pea Protein
- 8.1.3. Potato Protein
- 8.1.4. Rice Protein
- 8.1.5. Soy Protein
- 8.1.6. Wheat Protein
- 8.1.7. Other Plant Protein
- 8.2. Market Analysis, Insights and Forecast - by End User
- 8.2.1. Animal Feed
- 8.2.2. Food and Beverages
- 8.2.2.1. By Sub End User
- 8.2.2.1.1. Bakery
- 8.2.2.1.2. Breakfast Cereals
- 8.2.2.1.3. Condiments/Sauces
- 8.2.2.1.4. Confectionery
- 8.2.2.1.5. Dairy and Dairy Alternative Products
- 8.2.2.1.6. Meat/Poultry/Seafood and Meat Alternative Products
- 8.2.2.1.7. RTE/RTC Food Products
- 8.2.2.1.8. Snacks
- 8.2.2.1. By Sub End User
- 8.2.3. Personal Care and Cosmetics
- 8.2.4. Supplements
- 8.2.4.1. Baby Food and Infant Formula
- 8.2.4.2. Elderly Nutrition and Medical Nutrition
- 8.2.4.3. Sport/Performance Nutrition
- 8.1. Market Analysis, Insights and Forecast - by Protein Type
- 9. Middle East & Africa Plant Protein Market Analysis, Insights and Forecast, 2019-2031
- 9.1. Market Analysis, Insights and Forecast - by Protein Type
- 9.1.1. Hemp Protein
- 9.1.2. Pea Protein
- 9.1.3. Potato Protein
- 9.1.4. Rice Protein
- 9.1.5. Soy Protein
- 9.1.6. Wheat Protein
- 9.1.7. Other Plant Protein
- 9.2. Market Analysis, Insights and Forecast - by End User
- 9.2.1. Animal Feed
- 9.2.2. Food and Beverages
- 9.2.2.1. By Sub End User
- 9.2.2.1.1. Bakery
- 9.2.2.1.2. Breakfast Cereals
- 9.2.2.1.3. Condiments/Sauces
- 9.2.2.1.4. Confectionery
- 9.2.2.1.5. Dairy and Dairy Alternative Products
- 9.2.2.1.6. Meat/Poultry/Seafood and Meat Alternative Products
- 9.2.2.1.7. RTE/RTC Food Products
- 9.2.2.1.8. Snacks
- 9.2.2.1. By Sub End User
- 9.2.3. Personal Care and Cosmetics
- 9.2.4. Supplements
- 9.2.4.1. Baby Food and Infant Formula
- 9.2.4.2. Elderly Nutrition and Medical Nutrition
- 9.2.4.3. Sport/Performance Nutrition
- 9.1. Market Analysis, Insights and Forecast - by Protein Type
- 10. Asia Pacific Plant Protein Market Analysis, Insights and Forecast, 2019-2031
- 10.1. Market Analysis, Insights and Forecast - by Protein Type
- 10.1.1. Hemp Protein
- 10.1.2. Pea Protein
- 10.1.3. Potato Protein
- 10.1.4. Rice Protein
- 10.1.5. Soy Protein
- 10.1.6. Wheat Protein
- 10.1.7. Other Plant Protein
- 10.2. Market Analysis, Insights and Forecast - by End User
- 10.2.1. Animal Feed
- 10.2.2. Food and Beverages
- 10.2.2.1. By Sub End User
- 10.2.2.1.1. Bakery
- 10.2.2.1.2. Breakfast Cereals
- 10.2.2.1.3. Condiments/Sauces
- 10.2.2.1.4. Confectionery
- 10.2.2.1.5. Dairy and Dairy Alternative Products
- 10.2.2.1.6. Meat/Poultry/Seafood and Meat Alternative Products
- 10.2.2.1.7. RTE/RTC Food Products
- 10.2.2.1.8. Snacks
- 10.2.2.1. By Sub End User
- 10.2.3. Personal Care and Cosmetics
- 10.2.4. Supplements
- 10.2.4.1. Baby Food and Infant Formula
- 10.2.4.2. Elderly Nutrition and Medical Nutrition
- 10.2.4.3. Sport/Performance Nutrition
- 10.1. Market Analysis, Insights and Forecast - by Protein Type
- 11. North America Plant Protein Market Analysis, Insights and Forecast, 2019-2031
- 11.1. Market Analysis, Insights and Forecast - By Country/Sub-region
- 11.1.1. undefined
- 12. Europe Plant Protein Market Analysis, Insights and Forecast, 2019-2031
- 12.1. Market Analysis, Insights and Forecast - By Country/Sub-region
- 12.1.1. undefined
- 13. Asia-Pacific Plant Protein Market Analysis, Insights and Forecast, 2019-2031
- 13.1. Market Analysis, Insights and Forecast - By Country/Sub-region
- 13.1.1. undefined
- 14. Competitive Analysis
- 14.1. Global Market Share Analysis 2024
- 14.2. Company Profiles
- 14.2.1 CHS Inc
- 14.2.1.1. Overview
- 14.2.1.2. Products
- 14.2.1.3. SWOT Analysis
- 14.2.1.4. Recent Developments
- 14.2.1.5. Financials (Based on Availability)
- 14.2.2 Lantmännen
- 14.2.2.1. Overview
- 14.2.2.2. Products
- 14.2.2.3. SWOT Analysis
- 14.2.2.4. Recent Developments
- 14.2.2.5. Financials (Based on Availability)
- 14.2.3 International Flavors & Fragrances Inc
- 14.2.3.1. Overview
- 14.2.3.2. Products
- 14.2.3.3. SWOT Analysis
- 14.2.3.4. Recent Developments
- 14.2.3.5. Financials (Based on Availability)
- 14.2.4 Tereos SCA
- 14.2.4.1. Overview
- 14.2.4.2. Products
- 14.2.4.3. SWOT Analysis
- 14.2.4.4. Recent Developments
- 14.2.4.5. Financials (Based on Availability)
- 14.2.5 Wilmar International Lt
- 14.2.5.1. Overview
- 14.2.5.2. Products
- 14.2.5.3. SWOT Analysis
- 14.2.5.4. Recent Developments
- 14.2.5.5. Financials (Based on Availability)
- 14.2.6 Archer Daniels Midland Company
- 14.2.6.1. Overview
- 14.2.6.2. Products
- 14.2.6.3. SWOT Analysis
- 14.2.6.4. Recent Developments
- 14.2.6.5. Financials (Based on Availability)
- 14.2.7 Bunge Limited
- 14.2.7.1. Overview
- 14.2.7.2. Products
- 14.2.7.3. SWOT Analysis
- 14.2.7.4. Recent Developments
- 14.2.7.5. Financials (Based on Availability)
- 14.2.8 Fuji Oil Group
- 14.2.8.1. Overview
- 14.2.8.2. Products
- 14.2.8.3. SWOT Analysis
- 14.2.8.4. Recent Developments
- 14.2.8.5. Financials (Based on Availability)
- 14.2.9 Kerry Group PLC
- 14.2.9.1. Overview
- 14.2.9.2. Products
- 14.2.9.3. SWOT Analysis
- 14.2.9.4. Recent Developments
- 14.2.9.5. Financials (Based on Availability)
- 14.2.10 Südzucker AG
- 14.2.10.1. Overview
- 14.2.10.2. Products
- 14.2.10.3. SWOT Analysis
- 14.2.10.4. Recent Developments
- 14.2.10.5. Financials (Based on Availability)
- 14.2.11 Roquette Frère
- 14.2.11.1. Overview
- 14.2.11.2. Products
- 14.2.11.3. SWOT Analysis
- 14.2.11.4. Recent Developments
- 14.2.11.5. Financials (Based on Availability)
- 14.2.1 CHS Inc
List of Figures
- Figure 1: Global Plant Protein Market Revenue Breakdown (Million, %) by Region 2024 & 2032
- Figure 2: Global Plant Protein Market Volume Breakdown (K Tons, %) by Region 2024 & 2032
- Figure 3: North America Plant Protein Market Revenue (Million), by Country 2024 & 2032
- Figure 4: North America Plant Protein Market Volume (K Tons), by Country 2024 & 2032
- Figure 5: North America Plant Protein Market Revenue Share (%), by Country 2024 & 2032
- Figure 6: North America Plant Protein Market Volume Share (%), by Country 2024 & 2032
- Figure 7: Europe Plant Protein Market Revenue (Million), by Country 2024 & 2032
- Figure 8: Europe Plant Protein Market Volume (K Tons), by Country 2024 & 2032
- Figure 9: Europe Plant Protein Market Revenue Share (%), by Country 2024 & 2032
- Figure 10: Europe Plant Protein Market Volume Share (%), by Country 2024 & 2032
- Figure 11: Asia-Pacific Plant Protein Market Revenue (Million), by Country 2024 & 2032
- Figure 12: Asia-Pacific Plant Protein Market Volume (K Tons), by Country 2024 & 2032
- Figure 13: Asia-Pacific Plant Protein Market Revenue Share (%), by Country 2024 & 2032
- Figure 14: Asia-Pacific Plant Protein Market Volume Share (%), by Country 2024 & 2032
- Figure 15: North America Plant Protein Market Revenue (Million), by Protein Type 2024 & 2032
- Figure 16: North America Plant Protein Market Volume (K Tons), by Protein Type 2024 & 2032
- Figure 17: North America Plant Protein Market Revenue Share (%), by Protein Type 2024 & 2032
- Figure 18: North America Plant Protein Market Volume Share (%), by Protein Type 2024 & 2032
- Figure 19: North America Plant Protein Market Revenue (Million), by End User 2024 & 2032
- Figure 20: North America Plant Protein Market Volume (K Tons), by End User 2024 & 2032
- Figure 21: North America Plant Protein Market Revenue Share (%), by End User 2024 & 2032
- Figure 22: North America Plant Protein Market Volume Share (%), by End User 2024 & 2032
- Figure 23: North America Plant Protein Market Revenue (Million), by Country 2024 & 2032
- Figure 24: North America Plant Protein Market Volume (K Tons), by Country 2024 & 2032
- Figure 25: North America Plant Protein Market Revenue Share (%), by Country 2024 & 2032
- Figure 26: North America Plant Protein Market Volume Share (%), by Country 2024 & 2032
- Figure 27: South America Plant Protein Market Revenue (Million), by Protein Type 2024 & 2032
- Figure 28: South America Plant Protein Market Volume (K Tons), by Protein Type 2024 & 2032
- Figure 29: South America Plant Protein Market Revenue Share (%), by Protein Type 2024 & 2032
- Figure 30: South America Plant Protein Market Volume Share (%), by Protein Type 2024 & 2032
- Figure 31: South America Plant Protein Market Revenue (Million), by End User 2024 & 2032
- Figure 32: South America Plant Protein Market Volume (K Tons), by End User 2024 & 2032
- Figure 33: South America Plant Protein Market Revenue Share (%), by End User 2024 & 2032
- Figure 34: South America Plant Protein Market Volume Share (%), by End User 2024 & 2032
- Figure 35: South America Plant Protein Market Revenue (Million), by Country 2024 & 2032
- Figure 36: South America Plant Protein Market Volume (K Tons), by Country 2024 & 2032
- Figure 37: South America Plant Protein Market Revenue Share (%), by Country 2024 & 2032
- Figure 38: South America Plant Protein Market Volume Share (%), by Country 2024 & 2032
- Figure 39: Europe Plant Protein Market Revenue (Million), by Protein Type 2024 & 2032
- Figure 40: Europe Plant Protein Market Volume (K Tons), by Protein Type 2024 & 2032
- Figure 41: Europe Plant Protein Market Revenue Share (%), by Protein Type 2024 & 2032
- Figure 42: Europe Plant Protein Market Volume Share (%), by Protein Type 2024 & 2032
- Figure 43: Europe Plant Protein Market Revenue (Million), by End User 2024 & 2032
- Figure 44: Europe Plant Protein Market Volume (K Tons), by End User 2024 & 2032
- Figure 45: Europe Plant Protein Market Revenue Share (%), by End User 2024 & 2032
- Figure 46: Europe Plant Protein Market Volume Share (%), by End User 2024 & 2032
- Figure 47: Europe Plant Protein Market Revenue (Million), by Country 2024 & 2032
- Figure 48: Europe Plant Protein Market Volume (K Tons), by Country 2024 & 2032
- Figure 49: Europe Plant Protein Market Revenue Share (%), by Country 2024 & 2032
- Figure 50: Europe Plant Protein Market Volume Share (%), by Country 2024 & 2032
- Figure 51: Middle East & Africa Plant Protein Market Revenue (Million), by Protein Type 2024 & 2032
- Figure 52: Middle East & Africa Plant Protein Market Volume (K Tons), by Protein Type 2024 & 2032
- Figure 53: Middle East & Africa Plant Protein Market Revenue Share (%), by Protein Type 2024 & 2032
- Figure 54: Middle East & Africa Plant Protein Market Volume Share (%), by Protein Type 2024 & 2032
- Figure 55: Middle East & Africa Plant Protein Market Revenue (Million), by End User 2024 & 2032
- Figure 56: Middle East & Africa Plant Protein Market Volume (K Tons), by End User 2024 & 2032
- Figure 57: Middle East & Africa Plant Protein Market Revenue Share (%), by End User 2024 & 2032
- Figure 58: Middle East & Africa Plant Protein Market Volume Share (%), by End User 2024 & 2032
- Figure 59: Middle East & Africa Plant Protein Market Revenue (Million), by Country 2024 & 2032
- Figure 60: Middle East & Africa Plant Protein Market Volume (K Tons), by Country 2024 & 2032
- Figure 61: Middle East & Africa Plant Protein Market Revenue Share (%), by Country 2024 & 2032
- Figure 62: Middle East & Africa Plant Protein Market Volume Share (%), by Country 2024 & 2032
- Figure 63: Asia Pacific Plant Protein Market Revenue (Million), by Protein Type 2024 & 2032
- Figure 64: Asia Pacific Plant Protein Market Volume (K Tons), by Protein Type 2024 & 2032
- Figure 65: Asia Pacific Plant Protein Market Revenue Share (%), by Protein Type 2024 & 2032
- Figure 66: Asia Pacific Plant Protein Market Volume Share (%), by Protein Type 2024 & 2032
- Figure 67: Asia Pacific Plant Protein Market Revenue (Million), by End User 2024 & 2032
- Figure 68: Asia Pacific Plant Protein Market Volume (K Tons), by End User 2024 & 2032
- Figure 69: Asia Pacific Plant Protein Market Revenue Share (%), by End User 2024 & 2032
- Figure 70: Asia Pacific Plant Protein Market Volume Share (%), by End User 2024 & 2032
- Figure 71: Asia Pacific Plant Protein Market Revenue (Million), by Country 2024 & 2032
- Figure 72: Asia Pacific Plant Protein Market Volume (K Tons), by Country 2024 & 2032
- Figure 73: Asia Pacific Plant Protein Market Revenue Share (%), by Country 2024 & 2032
- Figure 74: Asia Pacific Plant Protein Market Volume Share (%), by Country 2024 & 2032
List of Tables
- Table 1: Global Plant Protein Market Revenue Million Forecast, by Region 2019 & 2032
- Table 2: Global Plant Protein Market Volume K Tons Forecast, by Region 2019 & 2032
- Table 3: Global Plant Protein Market Revenue Million Forecast, by Protein Type 2019 & 2032
- Table 4: Global Plant Protein Market Volume K Tons Forecast, by Protein Type 2019 & 2032
- Table 5: Global Plant Protein Market Revenue Million Forecast, by End User 2019 & 2032
- Table 6: Global Plant Protein Market Volume K Tons Forecast, by End User 2019 & 2032
- Table 7: Global Plant Protein Market Revenue Million Forecast, by Region 2019 & 2032
- Table 8: Global Plant Protein Market Volume K Tons Forecast, by Region 2019 & 2032
- Table 9: Global Plant Protein Market Revenue Million Forecast, by Country 2019 & 2032
- Table 10: Global Plant Protein Market Volume K Tons Forecast, by Country 2019 & 2032
- Table 11: Global Plant Protein Market Revenue Million Forecast, by Country 2019 & 2032
- Table 12: Global Plant Protein Market Volume K Tons Forecast, by Country 2019 & 2032
- Table 13: Global Plant Protein Market Revenue Million Forecast, by Country 2019 & 2032
- Table 14: Global Plant Protein Market Volume K Tons Forecast, by Country 2019 & 2032
- Table 15: Global Plant Protein Market Revenue Million Forecast, by Protein Type 2019 & 2032
- Table 16: Global Plant Protein Market Volume K Tons Forecast, by Protein Type 2019 & 2032
- Table 17: Global Plant Protein Market Revenue Million Forecast, by End User 2019 & 2032
- Table 18: Global Plant Protein Market Volume K Tons Forecast, by End User 2019 & 2032
- Table 19: Global Plant Protein Market Revenue Million Forecast, by Country 2019 & 2032
- Table 20: Global Plant Protein Market Volume K Tons Forecast, by Country 2019 & 2032
- Table 21: United States Plant Protein Market Revenue (Million) Forecast, by Application 2019 & 2032
- Table 22: United States Plant Protein Market Volume (K Tons) Forecast, by Application 2019 & 2032
- Table 23: Canada Plant Protein Market Revenue (Million) Forecast, by Application 2019 & 2032
- Table 24: Canada Plant Protein Market Volume (K Tons) Forecast, by Application 2019 & 2032
- Table 25: Mexico Plant Protein Market Revenue (Million) Forecast, by Application 2019 & 2032
- Table 26: Mexico Plant Protein Market Volume (K Tons) Forecast, by Application 2019 & 2032
- Table 27: Global Plant Protein Market Revenue Million Forecast, by Protein Type 2019 & 2032
- Table 28: Global Plant Protein Market Volume K Tons Forecast, by Protein Type 2019 & 2032
- Table 29: Global Plant Protein Market Revenue Million Forecast, by End User 2019 & 2032
- Table 30: Global Plant Protein Market Volume K Tons Forecast, by End User 2019 & 2032
- Table 31: Global Plant Protein Market Revenue Million Forecast, by Country 2019 & 2032
- Table 32: Global Plant Protein Market Volume K Tons Forecast, by Country 2019 & 2032
- Table 33: Brazil Plant Protein Market Revenue (Million) Forecast, by Application 2019 & 2032
- Table 34: Brazil Plant Protein Market Volume (K Tons) Forecast, by Application 2019 & 2032
- Table 35: Argentina Plant Protein Market Revenue (Million) Forecast, by Application 2019 & 2032
- Table 36: Argentina Plant Protein Market Volume (K Tons) Forecast, by Application 2019 & 2032
- Table 37: Rest of South America Plant Protein Market Revenue (Million) Forecast, by Application 2019 & 2032
- Table 38: Rest of South America Plant Protein Market Volume (K Tons) Forecast, by Application 2019 & 2032
- Table 39: Global Plant Protein Market Revenue Million Forecast, by Protein Type 2019 & 2032
- Table 40: Global Plant Protein Market Volume K Tons Forecast, by Protein Type 2019 & 2032
- Table 41: Global Plant Protein Market Revenue Million Forecast, by End User 2019 & 2032
- Table 42: Global Plant Protein Market Volume K Tons Forecast, by End User 2019 & 2032
- Table 43: Global Plant Protein Market Revenue Million Forecast, by Country 2019 & 2032
- Table 44: Global Plant Protein Market Volume K Tons Forecast, by Country 2019 & 2032
- Table 45: United Kingdom Plant Protein Market Revenue (Million) Forecast, by Application 2019 & 2032
- Table 46: United Kingdom Plant Protein Market Volume (K Tons) Forecast, by Application 2019 & 2032
- Table 47: Germany Plant Protein Market Revenue (Million) Forecast, by Application 2019 & 2032
- Table 48: Germany Plant Protein Market Volume (K Tons) Forecast, by Application 2019 & 2032
- Table 49: France Plant Protein Market Revenue (Million) Forecast, by Application 2019 & 2032
- Table 50: France Plant Protein Market Volume (K Tons) Forecast, by Application 2019 & 2032
- Table 51: Italy Plant Protein Market Revenue (Million) Forecast, by Application 2019 & 2032
- Table 52: Italy Plant Protein Market Volume (K Tons) Forecast, by Application 2019 & 2032
- Table 53: Spain Plant Protein Market Revenue (Million) Forecast, by Application 2019 & 2032
- Table 54: Spain Plant Protein Market Volume (K Tons) Forecast, by Application 2019 & 2032
- Table 55: Russia Plant Protein Market Revenue (Million) Forecast, by Application 2019 & 2032
- Table 56: Russia Plant Protein Market Volume (K Tons) Forecast, by Application 2019 & 2032
- Table 57: Benelux Plant Protein Market Revenue (Million) Forecast, by Application 2019 & 2032
- Table 58: Benelux Plant Protein Market Volume (K Tons) Forecast, by Application 2019 & 2032
- Table 59: Nordics Plant Protein Market Revenue (Million) Forecast, by Application 2019 & 2032
- Table 60: Nordics Plant Protein Market Volume (K Tons) Forecast, by Application 2019 & 2032
- Table 61: Rest of Europe Plant Protein Market Revenue (Million) Forecast, by Application 2019 & 2032
- Table 62: Rest of Europe Plant Protein Market Volume (K Tons) Forecast, by Application 2019 & 2032
- Table 63: Global Plant Protein Market Revenue Million Forecast, by Protein Type 2019 & 2032
- Table 64: Global Plant Protein Market Volume K Tons Forecast, by Protein Type 2019 & 2032
- Table 65: Global Plant Protein Market Revenue Million Forecast, by End User 2019 & 2032
- Table 66: Global Plant Protein Market Volume K Tons Forecast, by End User 2019 & 2032
- Table 67: Global Plant Protein Market Revenue Million Forecast, by Country 2019 & 2032
- Table 68: Global Plant Protein Market Volume K Tons Forecast, by Country 2019 & 2032
- Table 69: Turkey Plant Protein Market Revenue (Million) Forecast, by Application 2019 & 2032
- Table 70: Turkey Plant Protein Market Volume (K Tons) Forecast, by Application 2019 & 2032
- Table 71: Israel Plant Protein Market Revenue (Million) Forecast, by Application 2019 & 2032
- Table 72: Israel Plant Protein Market Volume (K Tons) Forecast, by Application 2019 & 2032
- Table 73: GCC Plant Protein Market Revenue (Million) Forecast, by Application 2019 & 2032
- Table 74: GCC Plant Protein Market Volume (K Tons) Forecast, by Application 2019 & 2032
- Table 75: North Africa Plant Protein Market Revenue (Million) Forecast, by Application 2019 & 2032
- Table 76: North Africa Plant Protein Market Volume (K Tons) Forecast, by Application 2019 & 2032
- Table 77: South Africa Plant Protein Market Revenue (Million) Forecast, by Application 2019 & 2032
- Table 78: South Africa Plant Protein Market Volume (K Tons) Forecast, by Application 2019 & 2032
- Table 79: Rest of Middle East & Africa Plant Protein Market Revenue (Million) Forecast, by Application 2019 & 2032
- Table 80: Rest of Middle East & Africa Plant Protein Market Volume (K Tons) Forecast, by Application 2019 & 2032
- Table 81: Global Plant Protein Market Revenue Million Forecast, by Protein Type 2019 & 2032
- Table 82: Global Plant Protein Market Volume K Tons Forecast, by Protein Type 2019 & 2032
- Table 83: Global Plant Protein Market Revenue Million Forecast, by End User 2019 & 2032
- Table 84: Global Plant Protein Market Volume K Tons Forecast, by End User 2019 & 2032
- Table 85: Global Plant Protein Market Revenue Million Forecast, by Country 2019 & 2032
- Table 86: Global Plant Protein Market Volume K Tons Forecast, by Country 2019 & 2032
- Table 87: China Plant Protein Market Revenue (Million) Forecast, by Application 2019 & 2032
- Table 88: China Plant Protein Market Volume (K Tons) Forecast, by Application 2019 & 2032
- Table 89: India Plant Protein Market Revenue (Million) Forecast, by Application 2019 & 2032
- Table 90: India Plant Protein Market Volume (K Tons) Forecast, by Application 2019 & 2032
- Table 91: Japan Plant Protein Market Revenue (Million) Forecast, by Application 2019 & 2032
- Table 92: Japan Plant Protein Market Volume (K Tons) Forecast, by Application 2019 & 2032
- Table 93: South Korea Plant Protein Market Revenue (Million) Forecast, by Application 2019 & 2032
- Table 94: South Korea Plant Protein Market Volume (K Tons) Forecast, by Application 2019 & 2032
- Table 95: ASEAN Plant Protein Market Revenue (Million) Forecast, by Application 2019 & 2032
- Table 96: ASEAN Plant Protein Market Volume (K Tons) Forecast, by Application 2019 & 2032
- Table 97: Oceania Plant Protein Market Revenue (Million) Forecast, by Application 2019 & 2032
- Table 98: Oceania Plant Protein Market Volume (K Tons) Forecast, by Application 2019 & 2032
- Table 99: Rest of Asia Pacific Plant Protein Market Revenue (Million) Forecast, by Application 2019 & 2032
- Table 100: Rest of Asia Pacific Plant Protein Market Volume (K Tons) Forecast, by Application 2019 & 2032
Frequently Asked Questions
1. What is the projected Compound Annual Growth Rate (CAGR) of the Plant Protein Market?
The projected CAGR is approximately 4.02%.
2. Which companies are prominent players in the Plant Protein Market?
Key companies in the market include CHS Inc, Lantmännen, International Flavors & Fragrances Inc, Tereos SCA, Wilmar International Lt, Archer Daniels Midland Company, Bunge Limited, Fuji Oil Group, Kerry Group PLC, Südzucker AG, Roquette Frère.
3. What are the main segments of the Plant Protein Market?
The market segments include Protein Type, End User.
4. Can you provide details about the market size?
The market size is estimated to be USD 12050 Million as of 2022.
5. What are some drivers contributing to market growth?
Increasing awareness towards fitness among consumers; Demand for convenient fortified foods.
6. What are the notable trends driving market growth?
OTHER KEY INDUSTRY TRENDS COVERED IN THE REPORT.
7. Are there any restraints impacting market growth?
Prevalence of allergen intolerance among the consumers.
8. Can you provide examples of recent developments in the market?
June 2022: Roquette, a plant-based protein manufacturer, released two novel rice proteins to address the market demand for meat substitute applications. The new Nutralys rice protein line includes a rice protein isolate and a rice protein concentrate. May 2022: BENEO, a subsidiary of Südzucker, entered a purchase agreement to acquire Meatless BV, a producer of functional ingredients. BENEO is expanding its existing product offering with the acquisition to offer an even broader range of texturizing solutions for meat and fish alternatives.January 2022: Kerry, the largest taste and nutrition company, officially opened a new 21,500-square-foot state-of-the-art facility at its Jeddah location in Saudi Arabia. The company has invested more than USD 90 million in the region, and this new facility is one of the most modern and efficient, which produces great tasting, nutritious, and sustainable food ingredients which will be distributed throughout the Middle East.
9. What pricing options are available for accessing the report?
Pricing options include single-user, multi-user, and enterprise licenses priced at USD 3800, USD 4500, and USD 5800 respectively.
10. Is the market size provided in terms of value or volume?
The market size is provided in terms of value, measured in Million and volume, measured in K Tons.
11. Are there any specific market keywords associated with the report?
Yes, the market keyword associated with the report is "Plant Protein Market," which aids in identifying and referencing the specific market segment covered.
12. How do I determine which pricing option suits my needs best?
The pricing options vary based on user requirements and access needs. Individual users may opt for single-user licenses, while businesses requiring broader access may choose multi-user or enterprise licenses for cost-effective access to the report.
13. Are there any additional resources or data provided in the Plant Protein Market report?
While the report offers comprehensive insights, it's advisable to review the specific contents or supplementary materials provided to ascertain if additional resources or data are available.
14. How can I stay updated on further developments or reports in the Plant Protein Market?
To stay informed about further developments, trends, and reports in the Plant Protein Market, consider subscribing to industry newsletters, following relevant companies and organizations, or regularly checking reputable industry news sources and publications.
Methodology
Step 1 - Identification of Relevant Samples Size from Population Database


Step 2 - Approaches for Defining Global Market Size (Value, Volume* & Price*)

Note*: In applicable scenarios
Step 3 - Data Sources
Primary Research
- Web Analytics
- Survey Reports
- Research Institute
- Latest Research Reports
- Opinion Leaders
Secondary Research
- Annual Reports
- White Paper
- Latest Press Release
- Industry Association
- Paid Database
- Investor Presentations

Step 4 - Data Triangulation
Involves using different sources of information in order to increase the validity of a study
These sources are likely to be stakeholders in a program - participants, other researchers, program staff, other community members, and so on.
Then we put all data in single framework & apply various statistical tools to find out the dynamic on the market.
During the analysis stage, feedback from the stakeholder groups would be compared to determine areas of agreement as well as areas of divergence


