
Key Insights
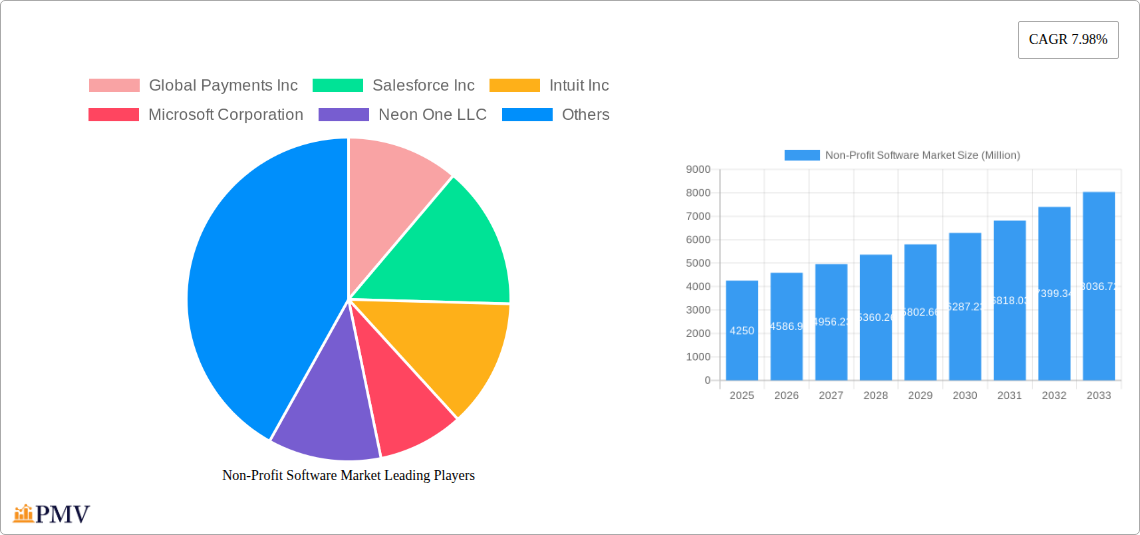
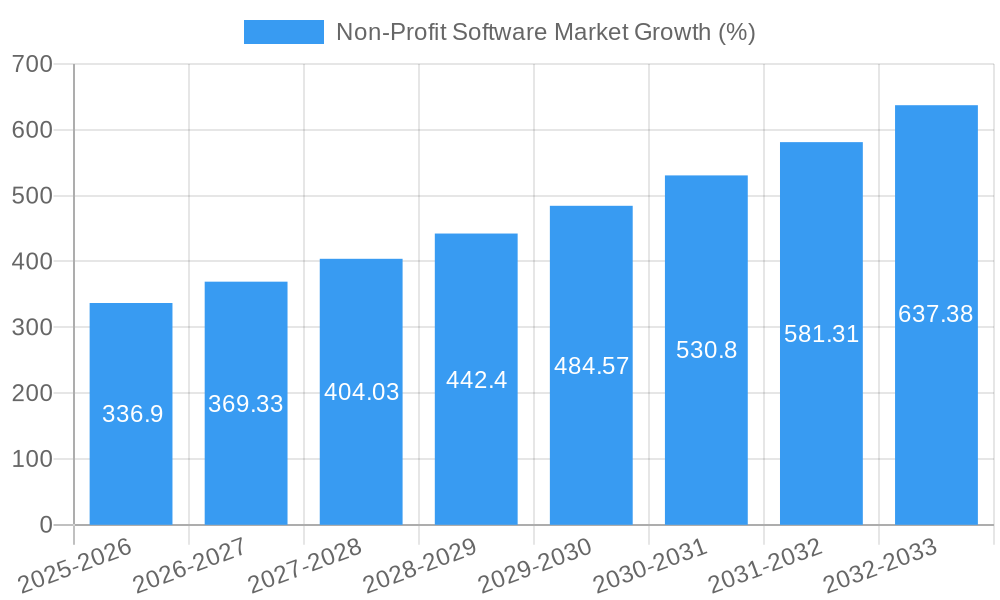
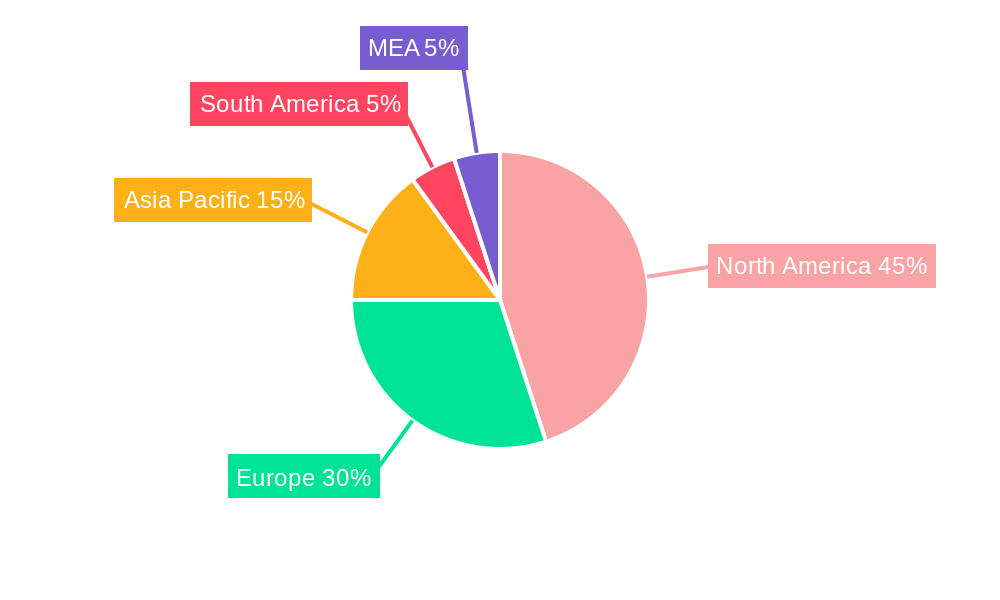
The nonprofit software market, valued at $4.25 billion in 2025, is experiencing robust growth, projected to expand at a compound annual growth rate (CAGR) of 7.98% from 2025 to 2033. This expansion is fueled by several key drivers. Firstly, the increasing reliance on technology by nonprofits to enhance operational efficiency and fundraising efforts is a significant catalyst. Cloud-based solutions are gaining traction due to their scalability, cost-effectiveness, and accessibility. Secondly, the growing need for sophisticated data analytics to better understand donor behavior and optimize resource allocation is driving demand for advanced CRM and fundraising software. Furthermore, the rise of social media and digital marketing necessitates specialized software for nonprofits to engage with their audiences effectively. The market is segmented by deployment (on-premises and cloud), enterprise size (SMEs and large enterprises), and software type (admission-based, fundraising, marketing, volunteer management, CRM, and others). North America currently dominates the market share, followed by Europe and Asia Pacific, reflecting higher technological adoption and a large number of established nonprofits in these regions.
However, the market also faces certain challenges. High implementation and maintenance costs, especially for smaller nonprofits, can be a barrier to adoption. Data security and privacy concerns, particularly in handling sensitive donor information, remain critical considerations. Integration challenges with existing systems and the need for ongoing training and support can also hinder widespread adoption. Despite these restraints, the long-term outlook for the nonprofit software market remains positive, driven by continuous technological advancements, increasing digitalization within the nonprofit sector, and a growing recognition of the importance of data-driven decision-making in achieving organizational goals. The competitive landscape is dynamic, with major players such as Blackbaud, Salesforce, and Neon One competing alongside smaller, specialized providers. This competition fosters innovation and drives the development of more sophisticated and user-friendly solutions catering to the diverse needs of nonprofit organizations.
Non-Profit Software Market: A Comprehensive Report (2019-2033)
This in-depth report provides a comprehensive analysis of the Non-Profit Software Market, offering invaluable insights for stakeholders across the industry. The study period covers 2019-2033, with 2025 as the base and estimated year, and a forecast period of 2025-2033. The report leverages extensive data from the historical period (2019-2024) to project future market trends and opportunities. The market is segmented by deployment (on-premises, cloud), enterprise size (SMEs, large enterprises), and software type (admission-based, fundraising, marketing, volunteer management, CRM, and other types). Key players analyzed include Global Payments Inc, Salesforce Inc, Intuit Inc, Microsoft Corporation, Neon One LLC, Network For Good Inc (BONTERRA), Cvent Holding Corp, WealthEngine Inc, Faithlife LLC, DonorSearch, SAP SE, Community Brands Intermediate LLC, Blackbaud Inc, Double the Donation, and Bloomerang LLC. The report projects a market value exceeding xx Million by 2033.
Non-Profit Software Market Market Structure & Competitive Dynamics
The Non-Profit Software Market exhibits a moderately concentrated structure, with several major players holding significant market share. Blackbaud Inc and Salesforce Inc, for instance, command a substantial portion, estimated at xx% and xx% respectively, in 2025. However, a vibrant ecosystem of smaller, specialized firms also contributes significantly to innovation and market dynamism. This competitive landscape is further shaped by ongoing mergers and acquisitions (M&A) activity, with deal values fluctuating yearly, averaging around xx Million in recent years.
Several factors influence the market structure. Regulatory frameworks, while not overly restrictive, still impact data privacy and security compliance. The availability of open-source alternatives and increasingly sophisticated cloud-based solutions present strong substitutes. End-user trends are shifting towards cloud-based, integrated solutions that streamline operations and enhance data management. The emergence of specialized platforms catering to niche segments within the non-profit sector adds another layer of complexity to the competitive environment.
- Market Concentration: Moderately concentrated, with several dominant players.
- Innovation Ecosystem: Highly dynamic, with both established players and emerging startups driving innovation.
- Regulatory Frameworks: Influence data privacy and security compliance but are not overly restrictive.
- Product Substitutes: Open-source solutions and cloud-based platforms are major substitutes.
- End-User Trends: Preference for cloud-based, integrated solutions.
- M&A Activity: Significant, contributing to market consolidation and technological advancements. Average deal value: xx Million (2022-2024).
Non-Profit Software Market Industry Trends & Insights
The Non-Profit Software Market is experiencing robust growth, driven by several key factors. The increasing adoption of cloud-based solutions for improved scalability, accessibility, and cost-effectiveness significantly fuels market expansion. The compound annual growth rate (CAGR) is projected at xx% during the forecast period (2025-2033), with cloud-based solutions dominating market penetration. This is further augmented by the rising need for efficient fundraising, donor management, and volunteer coordination among non-profit organizations. Technological disruptions, such as AI-powered analytics and automation tools, continue to transform operations, leading to increased efficiency and improved decision-making. Consumer preferences are increasingly geared towards user-friendly, feature-rich, and seamlessly integrated software solutions, driving demand for sophisticated and intuitive platforms.
The competitive dynamics remain intense, with established players facing challenges from agile startups offering innovative solutions. This leads to continuous product innovation and enhancements, ultimately benefiting non-profit organizations. The market’s expansion reflects a growing acknowledgment of the crucial role technology plays in improving operational efficiency, resource allocation, and ultimately, mission fulfillment for non-profit organizations.
Dominant Markets & Segments in Non-Profit Software Market
The Non-Profit Software Market demonstrates robust growth across various segments. However, the cloud-based deployment model has emerged as the dominant segment, projected to account for xx% of the total market share by 2033. Its scalability, affordability, and accessibility greatly benefit non-profits of all sizes.
Within enterprise size, large enterprises are the major consumers due to their more extensive operational needs and higher budgets. The Fundraising Software segment is currently experiencing significant growth with a market size of xx Million in 2025, driven by the need for efficient donor relationship management and fundraising campaigns. The North American market holds the largest market share, driven by a high concentration of non-profit organizations and advanced technological adoption.
- Key Drivers for Cloud Deployment: Cost-effectiveness, scalability, accessibility.
- Key Drivers for Large Enterprises: Increased operational needs, higher budgets.
- Key Drivers for Fundraising Software: Demand for efficient donor relationship management and fundraising campaigns.
- Key Drivers for North American Market: High concentration of non-profits, advanced technological adoption.
Non-Profit Software Market Product Innovations
Recent product innovations focus on enhancing user experience, improving data analytics, and integrating various functionalities into a single platform. AI-powered tools are gaining traction, enabling predictive modeling of donor behavior and automating repetitive tasks. Integration with social media platforms for enhanced engagement and fundraising is another prevalent trend. These developments are designed to enhance the efficiency and effectiveness of non-profit operations, meeting the evolving needs of the sector and driving adoption of newer, more sophisticated solutions.
Report Segmentation & Scope
The Non-Profit Software Market is segmented across key parameters:
By Deployment: On-premises deployment is gradually declining while cloud deployment is experiencing significant growth, projected to reach xx Million by 2033. This shift is driven by the need for accessibility, scalability and cost-effectiveness.
By Enterprise Size: The large enterprise segment dominates, reflecting the higher budgets and complex needs of large non-profit organizations. SMEs represent a significant growth opportunity, as many are adopting cloud-based solutions.
By Type: Fundraising software is the largest segment, owing to the critical role fundraising plays in non-profit operations. However, other segments like CRM and volunteer management are also experiencing substantial growth, indicating a growing demand for integrated solutions. Growth is projected to be highest in the volunteer management sector, with a CAGR of xx%.
Key Drivers of Non-Profit Software Market Growth
Several key factors drive the Non-Profit Software Market's growth:
Technological Advancements: The continuous development of cloud-based solutions, AI-powered analytics, and automation tools significantly improves efficiency and effectiveness.
Increased Funding: Growing availability of funding for technology adoption within non-profit organizations encourages investment in software solutions.
Regulatory Compliance: Regulations related to data privacy and security necessitate the adoption of compliant software solutions.
Challenges in the Non-Profit Software Market Sector
The Non-Profit Software Market faces several challenges:
Cost of Implementation: The initial investment in software and training can be a significant barrier, particularly for smaller organizations with limited budgets.
Data Security and Privacy Concerns: The increasing reliance on technology also necessitates robust data security measures and compliance with data privacy regulations.
Integration Challenges: Integrating different software systems can be complex and time-consuming, affecting overall operational efficiency.
Leading Players in the Non-Profit Software Market Market
- Global Payments Inc
- Salesforce Inc
- Intuit Inc
- Microsoft Corporation
- Neon One LLC
- Network For Good Inc (BONTERRA)
- Cvent Holding Corp
- WealthEngine Inc
- Faithlife LLC
- DonorSearch
- SAP SE
- Community Brands Intermediate LLC
- Blackbaud Inc
- Double the Donation
- Bloomerang LLC
Key Developments in Non-Profit Software Market Sector
October 2023: NetForum AMS, backed by Community Brands, launched a new website (NetForumAMS.com) and enhanced implementation options, streamlining AMS adoption for mid-market to enterprise-level associations and non-profits.
July 2023: Cvent unveiled Cvent Events+, enhancing event marketing and management with on-demand video capabilities, improving audience engagement.
Strategic Non-Profit Software Market Market Outlook
The Non-Profit Software Market presents significant growth potential driven by the ongoing digital transformation within the non-profit sector. Strategic opportunities exist for companies that can offer innovative, integrated solutions addressing specific needs within the sector. Focusing on user-friendly interfaces, robust data security, and seamless integration with other platforms will be crucial for success. The continued expansion of cloud-based solutions and the integration of AI-powered analytics will further shape market dynamics in the coming years.
Non-Profit Software Market Segmentation
-
1. Deployment
- 1.1. On Premises
- 1.2. Cloud
-
2. Enterprise Size
- 2.1. SMEs
- 2.2. Large Enterprise
-
3. Type
- 3.1. Admission-Based Nonprofit Software
- 3.2. Fund Raising Software
- 3.3. Marketing Software
- 3.4. Volunteer Management
- 3.5. CRM
- 3.6. Other Types
Non-Profit Software Market Segmentation By Geography
- 1. North America
- 2. Europe
- 3. Asia Pacific
- 4. Latin America
- 5. Middle East and Africa
Non-Profit Software Market REPORT HIGHLIGHTS
| Aspects | Details |
|---|---|
| Study Period | 2019-2033 |
| Base Year | 2024 |
| Estimated Year | 2025 |
| Forecast Period | 2025-2033 |
| Historical Period | 2019-2024 |
| Growth Rate | CAGR of 7.98% from 2019-2033 |
| Segmentation |
|
Table of Contents
- 1. Introduction
- 1.1. Research Scope
- 1.2. Market Segmentation
- 1.3. Research Methodology
- 1.4. Definitions and Assumptions
- 2. Executive Summary
- 2.1. Introduction
- 3. Market Dynamics
- 3.1. Introduction
- 3.2. Market Drivers
- 3.2.1. Growing Demand For Fund Raising Software; Rising Adoption of Automation in the Non-Profit Business
- 3.3. Market Restrains
- 3.3.1. Budget Constraints Related to Software Implementation
- 3.4. Market Trends
- 3.4.1. Fund Raising Software to Witness Major Growth
- 4. Market Factor Analysis
- 4.1. Porters Five Forces
- 4.2. Supply/Value Chain
- 4.3. PESTEL analysis
- 4.4. Market Entropy
- 4.5. Patent/Trademark Analysis
- 5. Global Non-Profit Software Market Analysis, Insights and Forecast, 2019-2031
- 5.1. Market Analysis, Insights and Forecast - by Deployment
- 5.1.1. On Premises
- 5.1.2. Cloud
- 5.2. Market Analysis, Insights and Forecast - by Enterprise Size
- 5.2.1. SMEs
- 5.2.2. Large Enterprise
- 5.3. Market Analysis, Insights and Forecast - by Type
- 5.3.1. Admission-Based Nonprofit Software
- 5.3.2. Fund Raising Software
- 5.3.3. Marketing Software
- 5.3.4. Volunteer Management
- 5.3.5. CRM
- 5.3.6. Other Types
- 5.4. Market Analysis, Insights and Forecast - by Region
- 5.4.1. North America
- 5.4.2. Europe
- 5.4.3. Asia Pacific
- 5.4.4. Latin America
- 5.4.5. Middle East and Africa
- 5.1. Market Analysis, Insights and Forecast - by Deployment
- 6. North America Non-Profit Software Market Analysis, Insights and Forecast, 2019-2031
- 6.1. Market Analysis, Insights and Forecast - by Deployment
- 6.1.1. On Premises
- 6.1.2. Cloud
- 6.2. Market Analysis, Insights and Forecast - by Enterprise Size
- 6.2.1. SMEs
- 6.2.2. Large Enterprise
- 6.3. Market Analysis, Insights and Forecast - by Type
- 6.3.1. Admission-Based Nonprofit Software
- 6.3.2. Fund Raising Software
- 6.3.3. Marketing Software
- 6.3.4. Volunteer Management
- 6.3.5. CRM
- 6.3.6. Other Types
- 6.1. Market Analysis, Insights and Forecast - by Deployment
- 7. Europe Non-Profit Software Market Analysis, Insights and Forecast, 2019-2031
- 7.1. Market Analysis, Insights and Forecast - by Deployment
- 7.1.1. On Premises
- 7.1.2. Cloud
- 7.2. Market Analysis, Insights and Forecast - by Enterprise Size
- 7.2.1. SMEs
- 7.2.2. Large Enterprise
- 7.3. Market Analysis, Insights and Forecast - by Type
- 7.3.1. Admission-Based Nonprofit Software
- 7.3.2. Fund Raising Software
- 7.3.3. Marketing Software
- 7.3.4. Volunteer Management
- 7.3.5. CRM
- 7.3.6. Other Types
- 7.1. Market Analysis, Insights and Forecast - by Deployment
- 8. Asia Pacific Non-Profit Software Market Analysis, Insights and Forecast, 2019-2031
- 8.1. Market Analysis, Insights and Forecast - by Deployment
- 8.1.1. On Premises
- 8.1.2. Cloud
- 8.2. Market Analysis, Insights and Forecast - by Enterprise Size
- 8.2.1. SMEs
- 8.2.2. Large Enterprise
- 8.3. Market Analysis, Insights and Forecast - by Type
- 8.3.1. Admission-Based Nonprofit Software
- 8.3.2. Fund Raising Software
- 8.3.3. Marketing Software
- 8.3.4. Volunteer Management
- 8.3.5. CRM
- 8.3.6. Other Types
- 8.1. Market Analysis, Insights and Forecast - by Deployment
- 9. Latin America Non-Profit Software Market Analysis, Insights and Forecast, 2019-2031
- 9.1. Market Analysis, Insights and Forecast - by Deployment
- 9.1.1. On Premises
- 9.1.2. Cloud
- 9.2. Market Analysis, Insights and Forecast - by Enterprise Size
- 9.2.1. SMEs
- 9.2.2. Large Enterprise
- 9.3. Market Analysis, Insights and Forecast - by Type
- 9.3.1. Admission-Based Nonprofit Software
- 9.3.2. Fund Raising Software
- 9.3.3. Marketing Software
- 9.3.4. Volunteer Management
- 9.3.5. CRM
- 9.3.6. Other Types
- 9.1. Market Analysis, Insights and Forecast - by Deployment
- 10. Middle East and Africa Non-Profit Software Market Analysis, Insights and Forecast, 2019-2031
- 10.1. Market Analysis, Insights and Forecast - by Deployment
- 10.1.1. On Premises
- 10.1.2. Cloud
- 10.2. Market Analysis, Insights and Forecast - by Enterprise Size
- 10.2.1. SMEs
- 10.2.2. Large Enterprise
- 10.3. Market Analysis, Insights and Forecast - by Type
- 10.3.1. Admission-Based Nonprofit Software
- 10.3.2. Fund Raising Software
- 10.3.3. Marketing Software
- 10.3.4. Volunteer Management
- 10.3.5. CRM
- 10.3.6. Other Types
- 10.1. Market Analysis, Insights and Forecast - by Deployment
- 11. North America Non-Profit Software Market Analysis, Insights and Forecast, 2019-2031
- 11.1. Market Analysis, Insights and Forecast - By Country/Sub-region
- 11.1.1 United States
- 11.1.2 Canada
- 11.1.3 Mexico
- 12. Europe Non-Profit Software Market Analysis, Insights and Forecast, 2019-2031
- 12.1. Market Analysis, Insights and Forecast - By Country/Sub-region
- 12.1.1 Germany
- 12.1.2 United Kingdom
- 12.1.3 France
- 12.1.4 Spain
- 12.1.5 Italy
- 12.1.6 Spain
- 12.1.7 Belgium
- 12.1.8 Netherland
- 12.1.9 Nordics
- 12.1.10 Rest of Europe
- 13. Asia Pacific Non-Profit Software Market Analysis, Insights and Forecast, 2019-2031
- 13.1. Market Analysis, Insights and Forecast - By Country/Sub-region
- 13.1.1 China
- 13.1.2 Japan
- 13.1.3 India
- 13.1.4 South Korea
- 13.1.5 Southeast Asia
- 13.1.6 Australia
- 13.1.7 Indonesia
- 13.1.8 Phillipes
- 13.1.9 Singapore
- 13.1.10 Thailandc
- 13.1.11 Rest of Asia Pacific
- 14. South America Non-Profit Software Market Analysis, Insights and Forecast, 2019-2031
- 14.1. Market Analysis, Insights and Forecast - By Country/Sub-region
- 14.1.1 Brazil
- 14.1.2 Argentina
- 14.1.3 Peru
- 14.1.4 Chile
- 14.1.5 Colombia
- 14.1.6 Ecuador
- 14.1.7 Venezuela
- 14.1.8 Rest of South America
- 15. North America Non-Profit Software Market Analysis, Insights and Forecast, 2019-2031
- 15.1. Market Analysis, Insights and Forecast - By Country/Sub-region
- 15.1.1 United States
- 15.1.2 Canada
- 15.1.3 Mexico
- 16. MEA Non-Profit Software Market Analysis, Insights and Forecast, 2019-2031
- 16.1. Market Analysis, Insights and Forecast - By Country/Sub-region
- 16.1.1 United Arab Emirates
- 16.1.2 Saudi Arabia
- 16.1.3 South Africa
- 16.1.4 Rest of Middle East and Africa
- 17. Competitive Analysis
- 17.1. Global Market Share Analysis 2024
- 17.2. Company Profiles
- 17.2.1 Global Payments Inc
- 17.2.1.1. Overview
- 17.2.1.2. Products
- 17.2.1.3. SWOT Analysis
- 17.2.1.4. Recent Developments
- 17.2.1.5. Financials (Based on Availability)
- 17.2.2 Salesforce Inc
- 17.2.2.1. Overview
- 17.2.2.2. Products
- 17.2.2.3. SWOT Analysis
- 17.2.2.4. Recent Developments
- 17.2.2.5. Financials (Based on Availability)
- 17.2.3 Intuit Inc
- 17.2.3.1. Overview
- 17.2.3.2. Products
- 17.2.3.3. SWOT Analysis
- 17.2.3.4. Recent Developments
- 17.2.3.5. Financials (Based on Availability)
- 17.2.4 Microsoft Corporation
- 17.2.4.1. Overview
- 17.2.4.2. Products
- 17.2.4.3. SWOT Analysis
- 17.2.4.4. Recent Developments
- 17.2.4.5. Financials (Based on Availability)
- 17.2.5 Neon One LLC
- 17.2.5.1. Overview
- 17.2.5.2. Products
- 17.2.5.3. SWOT Analysis
- 17.2.5.4. Recent Developments
- 17.2.5.5. Financials (Based on Availability)
- 17.2.6 Network For Good Inc (BONTERRA)
- 17.2.6.1. Overview
- 17.2.6.2. Products
- 17.2.6.3. SWOT Analysis
- 17.2.6.4. Recent Developments
- 17.2.6.5. Financials (Based on Availability)
- 17.2.7 Cvent Holding Corp
- 17.2.7.1. Overview
- 17.2.7.2. Products
- 17.2.7.3. SWOT Analysis
- 17.2.7.4. Recent Developments
- 17.2.7.5. Financials (Based on Availability)
- 17.2.8 WealthEngine Inc
- 17.2.8.1. Overview
- 17.2.8.2. Products
- 17.2.8.3. SWOT Analysis
- 17.2.8.4. Recent Developments
- 17.2.8.5. Financials (Based on Availability)
- 17.2.9 Faithlife LLC
- 17.2.9.1. Overview
- 17.2.9.2. Products
- 17.2.9.3. SWOT Analysis
- 17.2.9.4. Recent Developments
- 17.2.9.5. Financials (Based on Availability)
- 17.2.10 DonorSearch
- 17.2.10.1. Overview
- 17.2.10.2. Products
- 17.2.10.3. SWOT Analysis
- 17.2.10.4. Recent Developments
- 17.2.10.5. Financials (Based on Availability)
- 17.2.11 SAP SE
- 17.2.11.1. Overview
- 17.2.11.2. Products
- 17.2.11.3. SWOT Analysis
- 17.2.11.4. Recent Developments
- 17.2.11.5. Financials (Based on Availability)
- 17.2.12 Community Brands Intermediate LLC
- 17.2.12.1. Overview
- 17.2.12.2. Products
- 17.2.12.3. SWOT Analysis
- 17.2.12.4. Recent Developments
- 17.2.12.5. Financials (Based on Availability)
- 17.2.13 Blackbaud Inc
- 17.2.13.1. Overview
- 17.2.13.2. Products
- 17.2.13.3. SWOT Analysis
- 17.2.13.4. Recent Developments
- 17.2.13.5. Financials (Based on Availability)
- 17.2.14 Double the Donation
- 17.2.14.1. Overview
- 17.2.14.2. Products
- 17.2.14.3. SWOT Analysis
- 17.2.14.4. Recent Developments
- 17.2.14.5. Financials (Based on Availability)
- 17.2.15 Bloomerang LLC
- 17.2.15.1. Overview
- 17.2.15.2. Products
- 17.2.15.3. SWOT Analysis
- 17.2.15.4. Recent Developments
- 17.2.15.5. Financials (Based on Availability)
- 17.2.1 Global Payments Inc
List of Figures
- Figure 1: Global Non-Profit Software Market Revenue Breakdown (Million, %) by Region 2024 & 2032
- Figure 2: Global Non-Profit Software Market Volume Breakdown (K Unit, %) by Region 2024 & 2032
- Figure 3: North America Non-Profit Software Market Revenue (Million), by Country 2024 & 2032
- Figure 4: North America Non-Profit Software Market Volume (K Unit), by Country 2024 & 2032
- Figure 5: North America Non-Profit Software Market Revenue Share (%), by Country 2024 & 2032
- Figure 6: North America Non-Profit Software Market Volume Share (%), by Country 2024 & 2032
- Figure 7: Europe Non-Profit Software Market Revenue (Million), by Country 2024 & 2032
- Figure 8: Europe Non-Profit Software Market Volume (K Unit), by Country 2024 & 2032
- Figure 9: Europe Non-Profit Software Market Revenue Share (%), by Country 2024 & 2032
- Figure 10: Europe Non-Profit Software Market Volume Share (%), by Country 2024 & 2032
- Figure 11: Asia Pacific Non-Profit Software Market Revenue (Million), by Country 2024 & 2032
- Figure 12: Asia Pacific Non-Profit Software Market Volume (K Unit), by Country 2024 & 2032
- Figure 13: Asia Pacific Non-Profit Software Market Revenue Share (%), by Country 2024 & 2032
- Figure 14: Asia Pacific Non-Profit Software Market Volume Share (%), by Country 2024 & 2032
- Figure 15: South America Non-Profit Software Market Revenue (Million), by Country 2024 & 2032
- Figure 16: South America Non-Profit Software Market Volume (K Unit), by Country 2024 & 2032
- Figure 17: South America Non-Profit Software Market Revenue Share (%), by Country 2024 & 2032
- Figure 18: South America Non-Profit Software Market Volume Share (%), by Country 2024 & 2032
- Figure 19: North America Non-Profit Software Market Revenue (Million), by Country 2024 & 2032
- Figure 20: North America Non-Profit Software Market Volume (K Unit), by Country 2024 & 2032
- Figure 21: North America Non-Profit Software Market Revenue Share (%), by Country 2024 & 2032
- Figure 22: North America Non-Profit Software Market Volume Share (%), by Country 2024 & 2032
- Figure 23: MEA Non-Profit Software Market Revenue (Million), by Country 2024 & 2032
- Figure 24: MEA Non-Profit Software Market Volume (K Unit), by Country 2024 & 2032
- Figure 25: MEA Non-Profit Software Market Revenue Share (%), by Country 2024 & 2032
- Figure 26: MEA Non-Profit Software Market Volume Share (%), by Country 2024 & 2032
- Figure 27: North America Non-Profit Software Market Revenue (Million), by Deployment 2024 & 2032
- Figure 28: North America Non-Profit Software Market Volume (K Unit), by Deployment 2024 & 2032
- Figure 29: North America Non-Profit Software Market Revenue Share (%), by Deployment 2024 & 2032
- Figure 30: North America Non-Profit Software Market Volume Share (%), by Deployment 2024 & 2032
- Figure 31: North America Non-Profit Software Market Revenue (Million), by Enterprise Size 2024 & 2032
- Figure 32: North America Non-Profit Software Market Volume (K Unit), by Enterprise Size 2024 & 2032
- Figure 33: North America Non-Profit Software Market Revenue Share (%), by Enterprise Size 2024 & 2032
- Figure 34: North America Non-Profit Software Market Volume Share (%), by Enterprise Size 2024 & 2032
- Figure 35: North America Non-Profit Software Market Revenue (Million), by Type 2024 & 2032
- Figure 36: North America Non-Profit Software Market Volume (K Unit), by Type 2024 & 2032
- Figure 37: North America Non-Profit Software Market Revenue Share (%), by Type 2024 & 2032
- Figure 38: North America Non-Profit Software Market Volume Share (%), by Type 2024 & 2032
- Figure 39: North America Non-Profit Software Market Revenue (Million), by Country 2024 & 2032
- Figure 40: North America Non-Profit Software Market Volume (K Unit), by Country 2024 & 2032
- Figure 41: North America Non-Profit Software Market Revenue Share (%), by Country 2024 & 2032
- Figure 42: North America Non-Profit Software Market Volume Share (%), by Country 2024 & 2032
- Figure 43: Europe Non-Profit Software Market Revenue (Million), by Deployment 2024 & 2032
- Figure 44: Europe Non-Profit Software Market Volume (K Unit), by Deployment 2024 & 2032
- Figure 45: Europe Non-Profit Software Market Revenue Share (%), by Deployment 2024 & 2032
- Figure 46: Europe Non-Profit Software Market Volume Share (%), by Deployment 2024 & 2032
- Figure 47: Europe Non-Profit Software Market Revenue (Million), by Enterprise Size 2024 & 2032
- Figure 48: Europe Non-Profit Software Market Volume (K Unit), by Enterprise Size 2024 & 2032
- Figure 49: Europe Non-Profit Software Market Revenue Share (%), by Enterprise Size 2024 & 2032
- Figure 50: Europe Non-Profit Software Market Volume Share (%), by Enterprise Size 2024 & 2032
- Figure 51: Europe Non-Profit Software Market Revenue (Million), by Type 2024 & 2032
- Figure 52: Europe Non-Profit Software Market Volume (K Unit), by Type 2024 & 2032
- Figure 53: Europe Non-Profit Software Market Revenue Share (%), by Type 2024 & 2032
- Figure 54: Europe Non-Profit Software Market Volume Share (%), by Type 2024 & 2032
- Figure 55: Europe Non-Profit Software Market Revenue (Million), by Country 2024 & 2032
- Figure 56: Europe Non-Profit Software Market Volume (K Unit), by Country 2024 & 2032
- Figure 57: Europe Non-Profit Software Market Revenue Share (%), by Country 2024 & 2032
- Figure 58: Europe Non-Profit Software Market Volume Share (%), by Country 2024 & 2032
- Figure 59: Asia Pacific Non-Profit Software Market Revenue (Million), by Deployment 2024 & 2032
- Figure 60: Asia Pacific Non-Profit Software Market Volume (K Unit), by Deployment 2024 & 2032
- Figure 61: Asia Pacific Non-Profit Software Market Revenue Share (%), by Deployment 2024 & 2032
- Figure 62: Asia Pacific Non-Profit Software Market Volume Share (%), by Deployment 2024 & 2032
- Figure 63: Asia Pacific Non-Profit Software Market Revenue (Million), by Enterprise Size 2024 & 2032
- Figure 64: Asia Pacific Non-Profit Software Market Volume (K Unit), by Enterprise Size 2024 & 2032
- Figure 65: Asia Pacific Non-Profit Software Market Revenue Share (%), by Enterprise Size 2024 & 2032
- Figure 66: Asia Pacific Non-Profit Software Market Volume Share (%), by Enterprise Size 2024 & 2032
- Figure 67: Asia Pacific Non-Profit Software Market Revenue (Million), by Type 2024 & 2032
- Figure 68: Asia Pacific Non-Profit Software Market Volume (K Unit), by Type 2024 & 2032
- Figure 69: Asia Pacific Non-Profit Software Market Revenue Share (%), by Type 2024 & 2032
- Figure 70: Asia Pacific Non-Profit Software Market Volume Share (%), by Type 2024 & 2032
- Figure 71: Asia Pacific Non-Profit Software Market Revenue (Million), by Country 2024 & 2032
- Figure 72: Asia Pacific Non-Profit Software Market Volume (K Unit), by Country 2024 & 2032
- Figure 73: Asia Pacific Non-Profit Software Market Revenue Share (%), by Country 2024 & 2032
- Figure 74: Asia Pacific Non-Profit Software Market Volume Share (%), by Country 2024 & 2032
- Figure 75: Latin America Non-Profit Software Market Revenue (Million), by Deployment 2024 & 2032
- Figure 76: Latin America Non-Profit Software Market Volume (K Unit), by Deployment 2024 & 2032
- Figure 77: Latin America Non-Profit Software Market Revenue Share (%), by Deployment 2024 & 2032
- Figure 78: Latin America Non-Profit Software Market Volume Share (%), by Deployment 2024 & 2032
- Figure 79: Latin America Non-Profit Software Market Revenue (Million), by Enterprise Size 2024 & 2032
- Figure 80: Latin America Non-Profit Software Market Volume (K Unit), by Enterprise Size 2024 & 2032
- Figure 81: Latin America Non-Profit Software Market Revenue Share (%), by Enterprise Size 2024 & 2032
- Figure 82: Latin America Non-Profit Software Market Volume Share (%), by Enterprise Size 2024 & 2032
- Figure 83: Latin America Non-Profit Software Market Revenue (Million), by Type 2024 & 2032
- Figure 84: Latin America Non-Profit Software Market Volume (K Unit), by Type 2024 & 2032
- Figure 85: Latin America Non-Profit Software Market Revenue Share (%), by Type 2024 & 2032
- Figure 86: Latin America Non-Profit Software Market Volume Share (%), by Type 2024 & 2032
- Figure 87: Latin America Non-Profit Software Market Revenue (Million), by Country 2024 & 2032
- Figure 88: Latin America Non-Profit Software Market Volume (K Unit), by Country 2024 & 2032
- Figure 89: Latin America Non-Profit Software Market Revenue Share (%), by Country 2024 & 2032
- Figure 90: Latin America Non-Profit Software Market Volume Share (%), by Country 2024 & 2032
- Figure 91: Middle East and Africa Non-Profit Software Market Revenue (Million), by Deployment 2024 & 2032
- Figure 92: Middle East and Africa Non-Profit Software Market Volume (K Unit), by Deployment 2024 & 2032
- Figure 93: Middle East and Africa Non-Profit Software Market Revenue Share (%), by Deployment 2024 & 2032
- Figure 94: Middle East and Africa Non-Profit Software Market Volume Share (%), by Deployment 2024 & 2032
- Figure 95: Middle East and Africa Non-Profit Software Market Revenue (Million), by Enterprise Size 2024 & 2032
- Figure 96: Middle East and Africa Non-Profit Software Market Volume (K Unit), by Enterprise Size 2024 & 2032
- Figure 97: Middle East and Africa Non-Profit Software Market Revenue Share (%), by Enterprise Size 2024 & 2032
- Figure 98: Middle East and Africa Non-Profit Software Market Volume Share (%), by Enterprise Size 2024 & 2032
- Figure 99: Middle East and Africa Non-Profit Software Market Revenue (Million), by Type 2024 & 2032
- Figure 100: Middle East and Africa Non-Profit Software Market Volume (K Unit), by Type 2024 & 2032
- Figure 101: Middle East and Africa Non-Profit Software Market Revenue Share (%), by Type 2024 & 2032
- Figure 102: Middle East and Africa Non-Profit Software Market Volume Share (%), by Type 2024 & 2032
- Figure 103: Middle East and Africa Non-Profit Software Market Revenue (Million), by Country 2024 & 2032
- Figure 104: Middle East and Africa Non-Profit Software Market Volume (K Unit), by Country 2024 & 2032
- Figure 105: Middle East and Africa Non-Profit Software Market Revenue Share (%), by Country 2024 & 2032
- Figure 106: Middle East and Africa Non-Profit Software Market Volume Share (%), by Country 2024 & 2032
List of Tables
- Table 1: Global Non-Profit Software Market Revenue Million Forecast, by Region 2019 & 2032
- Table 2: Global Non-Profit Software Market Volume K Unit Forecast, by Region 2019 & 2032
- Table 3: Global Non-Profit Software Market Revenue Million Forecast, by Deployment 2019 & 2032
- Table 4: Global Non-Profit Software Market Volume K Unit Forecast, by Deployment 2019 & 2032
- Table 5: Global Non-Profit Software Market Revenue Million Forecast, by Enterprise Size 2019 & 2032
- Table 6: Global Non-Profit Software Market Volume K Unit Forecast, by Enterprise Size 2019 & 2032
- Table 7: Global Non-Profit Software Market Revenue Million Forecast, by Type 2019 & 2032
- Table 8: Global Non-Profit Software Market Volume K Unit Forecast, by Type 2019 & 2032
- Table 9: Global Non-Profit Software Market Revenue Million Forecast, by Region 2019 & 2032
- Table 10: Global Non-Profit Software Market Volume K Unit Forecast, by Region 2019 & 2032
- Table 11: Global Non-Profit Software Market Revenue Million Forecast, by Country 2019 & 2032
- Table 12: Global Non-Profit Software Market Volume K Unit Forecast, by Country 2019 & 2032
- Table 13: United States Non-Profit Software Market Revenue (Million) Forecast, by Application 2019 & 2032
- Table 14: United States Non-Profit Software Market Volume (K Unit) Forecast, by Application 2019 & 2032
- Table 15: Canada Non-Profit Software Market Revenue (Million) Forecast, by Application 2019 & 2032
- Table 16: Canada Non-Profit Software Market Volume (K Unit) Forecast, by Application 2019 & 2032
- Table 17: Mexico Non-Profit Software Market Revenue (Million) Forecast, by Application 2019 & 2032
- Table 18: Mexico Non-Profit Software Market Volume (K Unit) Forecast, by Application 2019 & 2032
- Table 19: Global Non-Profit Software Market Revenue Million Forecast, by Country 2019 & 2032
- Table 20: Global Non-Profit Software Market Volume K Unit Forecast, by Country 2019 & 2032
- Table 21: Germany Non-Profit Software Market Revenue (Million) Forecast, by Application 2019 & 2032
- Table 22: Germany Non-Profit Software Market Volume (K Unit) Forecast, by Application 2019 & 2032
- Table 23: United Kingdom Non-Profit Software Market Revenue (Million) Forecast, by Application 2019 & 2032
- Table 24: United Kingdom Non-Profit Software Market Volume (K Unit) Forecast, by Application 2019 & 2032
- Table 25: France Non-Profit Software Market Revenue (Million) Forecast, by Application 2019 & 2032
- Table 26: France Non-Profit Software Market Volume (K Unit) Forecast, by Application 2019 & 2032
- Table 27: Spain Non-Profit Software Market Revenue (Million) Forecast, by Application 2019 & 2032
- Table 28: Spain Non-Profit Software Market Volume (K Unit) Forecast, by Application 2019 & 2032
- Table 29: Italy Non-Profit Software Market Revenue (Million) Forecast, by Application 2019 & 2032
- Table 30: Italy Non-Profit Software Market Volume (K Unit) Forecast, by Application 2019 & 2032
- Table 31: Spain Non-Profit Software Market Revenue (Million) Forecast, by Application 2019 & 2032
- Table 32: Spain Non-Profit Software Market Volume (K Unit) Forecast, by Application 2019 & 2032
- Table 33: Belgium Non-Profit Software Market Revenue (Million) Forecast, by Application 2019 & 2032
- Table 34: Belgium Non-Profit Software Market Volume (K Unit) Forecast, by Application 2019 & 2032
- Table 35: Netherland Non-Profit Software Market Revenue (Million) Forecast, by Application 2019 & 2032
- Table 36: Netherland Non-Profit Software Market Volume (K Unit) Forecast, by Application 2019 & 2032
- Table 37: Nordics Non-Profit Software Market Revenue (Million) Forecast, by Application 2019 & 2032
- Table 38: Nordics Non-Profit Software Market Volume (K Unit) Forecast, by Application 2019 & 2032
- Table 39: Rest of Europe Non-Profit Software Market Revenue (Million) Forecast, by Application 2019 & 2032
- Table 40: Rest of Europe Non-Profit Software Market Volume (K Unit) Forecast, by Application 2019 & 2032
- Table 41: Global Non-Profit Software Market Revenue Million Forecast, by Country 2019 & 2032
- Table 42: Global Non-Profit Software Market Volume K Unit Forecast, by Country 2019 & 2032
- Table 43: China Non-Profit Software Market Revenue (Million) Forecast, by Application 2019 & 2032
- Table 44: China Non-Profit Software Market Volume (K Unit) Forecast, by Application 2019 & 2032
- Table 45: Japan Non-Profit Software Market Revenue (Million) Forecast, by Application 2019 & 2032
- Table 46: Japan Non-Profit Software Market Volume (K Unit) Forecast, by Application 2019 & 2032
- Table 47: India Non-Profit Software Market Revenue (Million) Forecast, by Application 2019 & 2032
- Table 48: India Non-Profit Software Market Volume (K Unit) Forecast, by Application 2019 & 2032
- Table 49: South Korea Non-Profit Software Market Revenue (Million) Forecast, by Application 2019 & 2032
- Table 50: South Korea Non-Profit Software Market Volume (K Unit) Forecast, by Application 2019 & 2032
- Table 51: Southeast Asia Non-Profit Software Market Revenue (Million) Forecast, by Application 2019 & 2032
- Table 52: Southeast Asia Non-Profit Software Market Volume (K Unit) Forecast, by Application 2019 & 2032
- Table 53: Australia Non-Profit Software Market Revenue (Million) Forecast, by Application 2019 & 2032
- Table 54: Australia Non-Profit Software Market Volume (K Unit) Forecast, by Application 2019 & 2032
- Table 55: Indonesia Non-Profit Software Market Revenue (Million) Forecast, by Application 2019 & 2032
- Table 56: Indonesia Non-Profit Software Market Volume (K Unit) Forecast, by Application 2019 & 2032
- Table 57: Phillipes Non-Profit Software Market Revenue (Million) Forecast, by Application 2019 & 2032
- Table 58: Phillipes Non-Profit Software Market Volume (K Unit) Forecast, by Application 2019 & 2032
- Table 59: Singapore Non-Profit Software Market Revenue (Million) Forecast, by Application 2019 & 2032
- Table 60: Singapore Non-Profit Software Market Volume (K Unit) Forecast, by Application 2019 & 2032
- Table 61: Thailandc Non-Profit Software Market Revenue (Million) Forecast, by Application 2019 & 2032
- Table 62: Thailandc Non-Profit Software Market Volume (K Unit) Forecast, by Application 2019 & 2032
- Table 63: Rest of Asia Pacific Non-Profit Software Market Revenue (Million) Forecast, by Application 2019 & 2032
- Table 64: Rest of Asia Pacific Non-Profit Software Market Volume (K Unit) Forecast, by Application 2019 & 2032
- Table 65: Global Non-Profit Software Market Revenue Million Forecast, by Country 2019 & 2032
- Table 66: Global Non-Profit Software Market Volume K Unit Forecast, by Country 2019 & 2032
- Table 67: Brazil Non-Profit Software Market Revenue (Million) Forecast, by Application 2019 & 2032
- Table 68: Brazil Non-Profit Software Market Volume (K Unit) Forecast, by Application 2019 & 2032
- Table 69: Argentina Non-Profit Software Market Revenue (Million) Forecast, by Application 2019 & 2032
- Table 70: Argentina Non-Profit Software Market Volume (K Unit) Forecast, by Application 2019 & 2032
- Table 71: Peru Non-Profit Software Market Revenue (Million) Forecast, by Application 2019 & 2032
- Table 72: Peru Non-Profit Software Market Volume (K Unit) Forecast, by Application 2019 & 2032
- Table 73: Chile Non-Profit Software Market Revenue (Million) Forecast, by Application 2019 & 2032
- Table 74: Chile Non-Profit Software Market Volume (K Unit) Forecast, by Application 2019 & 2032
- Table 75: Colombia Non-Profit Software Market Revenue (Million) Forecast, by Application 2019 & 2032
- Table 76: Colombia Non-Profit Software Market Volume (K Unit) Forecast, by Application 2019 & 2032
- Table 77: Ecuador Non-Profit Software Market Revenue (Million) Forecast, by Application 2019 & 2032
- Table 78: Ecuador Non-Profit Software Market Volume (K Unit) Forecast, by Application 2019 & 2032
- Table 79: Venezuela Non-Profit Software Market Revenue (Million) Forecast, by Application 2019 & 2032
- Table 80: Venezuela Non-Profit Software Market Volume (K Unit) Forecast, by Application 2019 & 2032
- Table 81: Rest of South America Non-Profit Software Market Revenue (Million) Forecast, by Application 2019 & 2032
- Table 82: Rest of South America Non-Profit Software Market Volume (K Unit) Forecast, by Application 2019 & 2032
- Table 83: Global Non-Profit Software Market Revenue Million Forecast, by Country 2019 & 2032
- Table 84: Global Non-Profit Software Market Volume K Unit Forecast, by Country 2019 & 2032
- Table 85: United States Non-Profit Software Market Revenue (Million) Forecast, by Application 2019 & 2032
- Table 86: United States Non-Profit Software Market Volume (K Unit) Forecast, by Application 2019 & 2032
- Table 87: Canada Non-Profit Software Market Revenue (Million) Forecast, by Application 2019 & 2032
- Table 88: Canada Non-Profit Software Market Volume (K Unit) Forecast, by Application 2019 & 2032
- Table 89: Mexico Non-Profit Software Market Revenue (Million) Forecast, by Application 2019 & 2032
- Table 90: Mexico Non-Profit Software Market Volume (K Unit) Forecast, by Application 2019 & 2032
- Table 91: Global Non-Profit Software Market Revenue Million Forecast, by Country 2019 & 2032
- Table 92: Global Non-Profit Software Market Volume K Unit Forecast, by Country 2019 & 2032
- Table 93: United Arab Emirates Non-Profit Software Market Revenue (Million) Forecast, by Application 2019 & 2032
- Table 94: United Arab Emirates Non-Profit Software Market Volume (K Unit) Forecast, by Application 2019 & 2032
- Table 95: Saudi Arabia Non-Profit Software Market Revenue (Million) Forecast, by Application 2019 & 2032
- Table 96: Saudi Arabia Non-Profit Software Market Volume (K Unit) Forecast, by Application 2019 & 2032
- Table 97: South Africa Non-Profit Software Market Revenue (Million) Forecast, by Application 2019 & 2032
- Table 98: South Africa Non-Profit Software Market Volume (K Unit) Forecast, by Application 2019 & 2032
- Table 99: Rest of Middle East and Africa Non-Profit Software Market Revenue (Million) Forecast, by Application 2019 & 2032
- Table 100: Rest of Middle East and Africa Non-Profit Software Market Volume (K Unit) Forecast, by Application 2019 & 2032
- Table 101: Global Non-Profit Software Market Revenue Million Forecast, by Deployment 2019 & 2032
- Table 102: Global Non-Profit Software Market Volume K Unit Forecast, by Deployment 2019 & 2032
- Table 103: Global Non-Profit Software Market Revenue Million Forecast, by Enterprise Size 2019 & 2032
- Table 104: Global Non-Profit Software Market Volume K Unit Forecast, by Enterprise Size 2019 & 2032
- Table 105: Global Non-Profit Software Market Revenue Million Forecast, by Type 2019 & 2032
- Table 106: Global Non-Profit Software Market Volume K Unit Forecast, by Type 2019 & 2032
- Table 107: Global Non-Profit Software Market Revenue Million Forecast, by Country 2019 & 2032
- Table 108: Global Non-Profit Software Market Volume K Unit Forecast, by Country 2019 & 2032
- Table 109: Global Non-Profit Software Market Revenue Million Forecast, by Deployment 2019 & 2032
- Table 110: Global Non-Profit Software Market Volume K Unit Forecast, by Deployment 2019 & 2032
- Table 111: Global Non-Profit Software Market Revenue Million Forecast, by Enterprise Size 2019 & 2032
- Table 112: Global Non-Profit Software Market Volume K Unit Forecast, by Enterprise Size 2019 & 2032
- Table 113: Global Non-Profit Software Market Revenue Million Forecast, by Type 2019 & 2032
- Table 114: Global Non-Profit Software Market Volume K Unit Forecast, by Type 2019 & 2032
- Table 115: Global Non-Profit Software Market Revenue Million Forecast, by Country 2019 & 2032
- Table 116: Global Non-Profit Software Market Volume K Unit Forecast, by Country 2019 & 2032
- Table 117: Global Non-Profit Software Market Revenue Million Forecast, by Deployment 2019 & 2032
- Table 118: Global Non-Profit Software Market Volume K Unit Forecast, by Deployment 2019 & 2032
- Table 119: Global Non-Profit Software Market Revenue Million Forecast, by Enterprise Size 2019 & 2032
- Table 120: Global Non-Profit Software Market Volume K Unit Forecast, by Enterprise Size 2019 & 2032
- Table 121: Global Non-Profit Software Market Revenue Million Forecast, by Type 2019 & 2032
- Table 122: Global Non-Profit Software Market Volume K Unit Forecast, by Type 2019 & 2032
- Table 123: Global Non-Profit Software Market Revenue Million Forecast, by Country 2019 & 2032
- Table 124: Global Non-Profit Software Market Volume K Unit Forecast, by Country 2019 & 2032
- Table 125: Global Non-Profit Software Market Revenue Million Forecast, by Deployment 2019 & 2032
- Table 126: Global Non-Profit Software Market Volume K Unit Forecast, by Deployment 2019 & 2032
- Table 127: Global Non-Profit Software Market Revenue Million Forecast, by Enterprise Size 2019 & 2032
- Table 128: Global Non-Profit Software Market Volume K Unit Forecast, by Enterprise Size 2019 & 2032
- Table 129: Global Non-Profit Software Market Revenue Million Forecast, by Type 2019 & 2032
- Table 130: Global Non-Profit Software Market Volume K Unit Forecast, by Type 2019 & 2032
- Table 131: Global Non-Profit Software Market Revenue Million Forecast, by Country 2019 & 2032
- Table 132: Global Non-Profit Software Market Volume K Unit Forecast, by Country 2019 & 2032
- Table 133: Global Non-Profit Software Market Revenue Million Forecast, by Deployment 2019 & 2032
- Table 134: Global Non-Profit Software Market Volume K Unit Forecast, by Deployment 2019 & 2032
- Table 135: Global Non-Profit Software Market Revenue Million Forecast, by Enterprise Size 2019 & 2032
- Table 136: Global Non-Profit Software Market Volume K Unit Forecast, by Enterprise Size 2019 & 2032
- Table 137: Global Non-Profit Software Market Revenue Million Forecast, by Type 2019 & 2032
- Table 138: Global Non-Profit Software Market Volume K Unit Forecast, by Type 2019 & 2032
- Table 139: Global Non-Profit Software Market Revenue Million Forecast, by Country 2019 & 2032
- Table 140: Global Non-Profit Software Market Volume K Unit Forecast, by Country 2019 & 2032
Frequently Asked Questions
1. What is the projected Compound Annual Growth Rate (CAGR) of the Non-Profit Software Market?
The projected CAGR is approximately 7.98%.
2. Which companies are prominent players in the Non-Profit Software Market?
Key companies in the market include Global Payments Inc, Salesforce Inc, Intuit Inc, Microsoft Corporation, Neon One LLC, Network For Good Inc (BONTERRA), Cvent Holding Corp, WealthEngine Inc, Faithlife LLC, DonorSearch, SAP SE, Community Brands Intermediate LLC, Blackbaud Inc, Double the Donation, Bloomerang LLC.
3. What are the main segments of the Non-Profit Software Market?
The market segments include Deployment, Enterprise Size, Type.
4. Can you provide details about the market size?
The market size is estimated to be USD 4.25 Million as of 2022.
5. What are some drivers contributing to market growth?
Growing Demand For Fund Raising Software; Rising Adoption of Automation in the Non-Profit Business.
6. What are the notable trends driving market growth?
Fund Raising Software to Witness Major Growth.
7. Are there any restraints impacting market growth?
Budget Constraints Related to Software Implementation.
8. Can you provide examples of recent developments in the market?
October 2023 - NetForum AMS, backed by Community Brands, revealed a new website to serve associations with comprehensive association management software (AMS) and added implementation options. The shift is reflected with a URL change to NetForumAMS.com and will help associations implement the AMS system quickly without heavy customization. NetForum supports midmarket to enterprise-level associations and non-profits with a robust association management system tailored for the budgets or time constraints facing mid-to-large organizations.
9. What pricing options are available for accessing the report?
Pricing options include single-user, multi-user, and enterprise licenses priced at USD 4750, USD 5250, and USD 8750 respectively.
10. Is the market size provided in terms of value or volume?
The market size is provided in terms of value, measured in Million and volume, measured in K Unit.
11. Are there any specific market keywords associated with the report?
Yes, the market keyword associated with the report is "Non-Profit Software Market," which aids in identifying and referencing the specific market segment covered.
12. How do I determine which pricing option suits my needs best?
The pricing options vary based on user requirements and access needs. Individual users may opt for single-user licenses, while businesses requiring broader access may choose multi-user or enterprise licenses for cost-effective access to the report.
13. Are there any additional resources or data provided in the Non-Profit Software Market report?
While the report offers comprehensive insights, it's advisable to review the specific contents or supplementary materials provided to ascertain if additional resources or data are available.
14. How can I stay updated on further developments or reports in the Non-Profit Software Market?
To stay informed about further developments, trends, and reports in the Non-Profit Software Market, consider subscribing to industry newsletters, following relevant companies and organizations, or regularly checking reputable industry news sources and publications.
Methodology
Step 1 - Identification of Relevant Samples Size from Population Database


Step 2 - Approaches for Defining Global Market Size (Value, Volume* & Price*)

Note*: In applicable scenarios
Step 3 - Data Sources
Primary Research
- Web Analytics
- Survey Reports
- Research Institute
- Latest Research Reports
- Opinion Leaders
Secondary Research
- Annual Reports
- White Paper
- Latest Press Release
- Industry Association
- Paid Database
- Investor Presentations

Step 4 - Data Triangulation
Involves using different sources of information in order to increase the validity of a study
These sources are likely to be stakeholders in a program - participants, other researchers, program staff, other community members, and so on.
Then we put all data in single framework & apply various statistical tools to find out the dynamic on the market.
During the analysis stage, feedback from the stakeholder groups would be compared to determine areas of agreement as well as areas of divergence


