
Key Insights
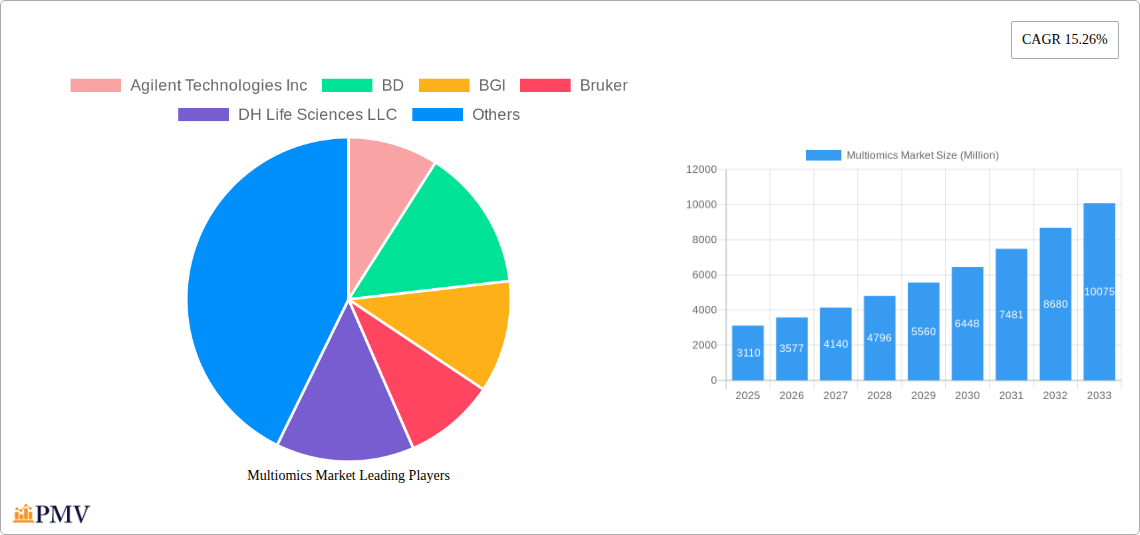
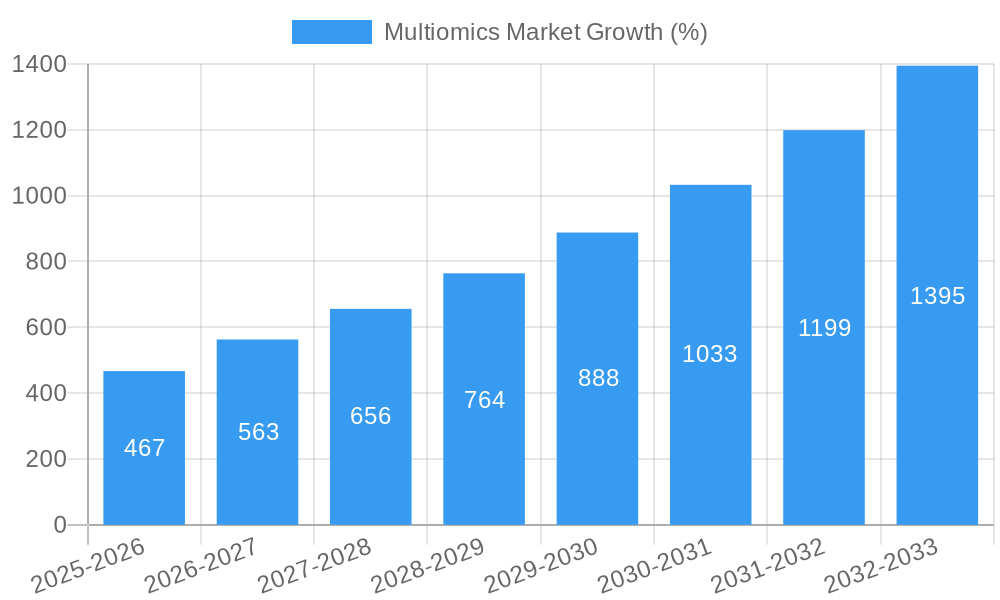
The multiomics market, currently valued at $3.11 billion in 2025, is projected to experience robust growth, driven by a Compound Annual Growth Rate (CAGR) of 15.26% from 2025 to 2033. This expansion is fueled by several key factors. Advancements in sequencing technologies are making multiomics analysis more accessible and cost-effective, leading to broader adoption across research and clinical settings. The increasing prevalence of chronic diseases, coupled with a growing demand for personalized medicine, further fuels market growth. Furthermore, the rising availability of large-scale genomic and other omics datasets, combined with powerful bioinformatics tools for data analysis, is enabling researchers to uncover complex biological interactions and develop novel diagnostic and therapeutic approaches. The market is witnessing significant investments in research and development from both public and private sectors, contributing to the acceleration of technological advancements and increased market penetration. Competitive landscape is marked by the presence of both established players like Illumina, Thermo Fisher Scientific, and Agilent Technologies, as well as emerging companies specializing in innovative multiomics technologies.
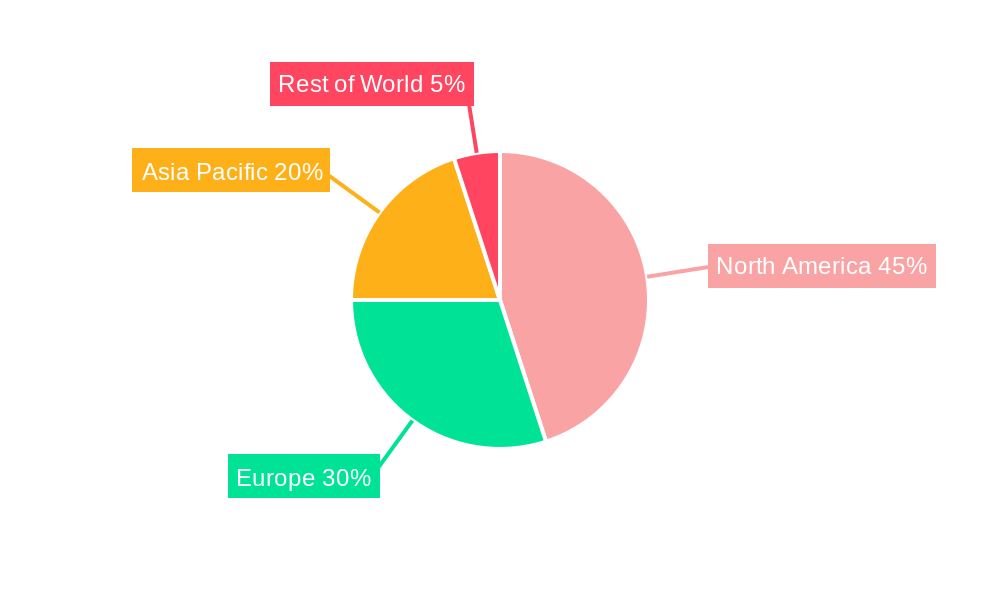
The segmentation of the multiomics market reveals significant opportunities within specific application areas such as oncology, infectious diseases, and drug discovery. The North American market currently holds a dominant share, driven by robust research infrastructure and funding, while the Asia-Pacific region is expected to witness significant growth in the coming years due to rising healthcare expenditure and increasing adoption of advanced technologies. While challenges remain, such as the complexity of data analysis and the need for standardized protocols, the overall outlook for the multiomics market remains exceptionally positive, promising substantial growth and transformative impacts on healthcare and scientific research in the coming decade. The market’s future trajectory is intrinsically linked to continued technological innovation, regulatory approvals, and the ongoing integration of multiomics into clinical workflows.
Multiomics Market: A Comprehensive Report (2019-2033)
This comprehensive report provides an in-depth analysis of the global multiomics market, offering valuable insights for stakeholders across the life sciences and healthcare industries. The report covers the period from 2019 to 2033, with a base year of 2025 and a forecast period from 2025 to 2033. The market is projected to reach xx Million by 2033, exhibiting a CAGR of xx% during the forecast period.
Multiomics Market Structure & Competitive Dynamics
The multiomics market is characterized by a moderately concentrated structure, with key players holding significant market shares. The competitive landscape is dynamic, driven by continuous innovation, strategic mergers and acquisitions (M&A), and evolving regulatory frameworks. Major players such as Illumina Inc, Thermo Fisher Scientific Inc, and QIAGEN hold substantial market share, estimated at xx%, xx%, and xx%, respectively, in 2025. However, smaller, specialized companies are also emerging, focusing on niche applications and innovative technologies.
The innovation ecosystem is vibrant, with significant investment in R&D across various technologies, including next-generation sequencing (NGS), mass spectrometry, and bioinformatics. Regulatory frameworks, particularly those related to data privacy and ethical considerations, play a crucial role in shaping market growth. Product substitutes, such as traditional single-omics approaches, still exist, but the growing demand for comprehensive insights is driving the adoption of multiomics technologies. End-user trends, particularly in personalized medicine and precision oncology, are fueling market expansion. M&A activity has been significant, with several high-value deals recorded in the past five years, totaling an estimated xx Million. These deals reflect the strategic importance of multiomics technologies and the consolidation within the industry. Examples include (but are not limited to) the acquisition of xx by xx for xx Million in 2022, and the merger of xx and xx in 2023.
Multiomics Market Industry Trends & Insights
The multiomics market is experiencing robust growth, driven by several key factors. The increasing prevalence of chronic diseases, coupled with the growing demand for personalized medicine, is a major catalyst for market expansion. Technological advancements, particularly in NGS and bioinformatics, are enabling more efficient and cost-effective multiomics analysis, further accelerating market growth. The rising adoption of cloud-based data storage and analysis platforms is also streamlining workflows and reducing operational costs. The shift towards preventive healthcare is another significant trend, as multiomics provides insights into predisposition to diseases, enabling early intervention strategies. The market penetration rate of multiomics technologies in various healthcare settings is increasing, estimated at xx% in 2025, with projections of reaching xx% by 2033. This growth is largely driven by the increasing availability of high-throughput technologies and the declining cost of sequencing. However, data interpretation and integration still present challenges, potentially slowing down market adoption. Competitive dynamics are intense, with established players and emerging companies vying for market share through innovation and strategic partnerships. These dynamics are expected to remain a defining feature of the market landscape in the coming years.
Dominant Markets & Segments in Multiomics Market
The North American region currently dominates the global multiomics market, driven by factors such as strong research infrastructure, high healthcare expenditure, and early adoption of advanced technologies. Specific countries within this region, notably the United States, show exceptional growth due to robust funding for research, the presence of major industry players, and a high concentration of clinical research organizations.
- Key Drivers in North America:
- High levels of healthcare spending and investment in R&D.
- Strong regulatory support for innovative technologies.
- Presence of numerous leading multiomics companies.
- Established research infrastructure and clinical trial networks.
Further analysis reveals that the oncology segment holds the largest market share within the multiomics market, fueled by the growing need for personalized cancer treatments and diagnostic tools. This segment is expected to maintain its leadership position throughout the forecast period due to the increasing prevalence of cancer and ongoing advancements in cancer research.
Multiomics Market Product Innovations
Recent product developments in the multiomics market reflect a growing focus on integrated solutions that combine different omics technologies for comprehensive analysis. This includes platforms that simultaneously analyze genomics, transcriptomics, proteomics, and metabolomics data from a single sample. The emphasis is on high-throughput, cost-effective solutions that are easily integrated into existing laboratory workflows. Key competitive advantages include improved sensitivity, accuracy, and reduced turnaround times. These technological advancements are driving market growth by providing more comprehensive data, enabling faster diagnosis, and improving treatment outcomes.
Report Segmentation & Scope
This report segments the multiomics market based on technology (NGS, mass spectrometry, etc.), application (oncology, drug discovery, etc.), and end-user (hospitals, research institutions, etc.). Each segment is analyzed in detail, with growth projections, market size estimations, and competitive dynamics assessed. For example, the NGS segment is projected to experience significant growth due to technological advancements and decreasing costs, while the oncology application segment is expected to dominate due to the growing prevalence of cancer. The end-user segment of research institutions is anticipated to have significant growth due to the increase in research funding and collaboration.
Key Drivers of Multiomics Market Growth
Several factors are driving the growth of the multiomics market. These include technological advancements, such as the development of more efficient and cost-effective high-throughput sequencing technologies and bioinformatics tools. The rising prevalence of chronic diseases, the increasing demand for personalized medicine, and growing research funding contribute significantly to market expansion. Favorable government regulations and policies promoting the adoption of advanced healthcare technologies also play a role. Specific examples include the increasing funding for precision medicine initiatives and the relaxation of regulations for certain multiomics-based diagnostic tests.
Challenges in the Multiomics Market Sector
Despite the significant potential, the multiomics market faces certain challenges. High costs associated with equipment and data analysis are major barriers to entry for some players. The complexity of integrating and interpreting data from multiple omics platforms also presents a significant hurdle, especially for smaller research institutions and clinical laboratories. Additionally, regulatory hurdles related to data privacy and ethical considerations can also impede market expansion. Supply chain disruptions may impact the availability of reagents and consumables needed for multiomics analysis. This can lead to project delays and increased costs impacting the overall market growth.
Leading Players in the Multiomics Market Market
- Agilent Technologies Inc
- BD
- BGI
- Bruker
- DH Life Sciences LLC
- Illumina Inc
- Mission Bio
- NanoCellect Biomedical
- PerkinElmer Inc
- QIAGEN
- Shimadzu Corporation
- Singleron Biotechnologies
- Standard BioTools
- Thermo Fisher Scientific Inc
- List Not Exhaustive
Key Developments in Multiomics Market Sector
February 2024: Vizzhy Inc. launched the world's inaugural Multiomics Lab in Bengaluru, India, signifying a significant advancement in personalized healthcare, enabling more precise diagnoses and treatment plans.
September 2023: MGI's DCS Lab Initiative stimulated large-scale multiomics research by providing access to advanced technologies and encouraging collaboration among research institutions, impacting market adoption and expansion.
April 2023: Biomodal's new duet multiomics solution significantly improved efficiency by enabling simultaneous analysis of epigenetic and genetic information from a single sample, enhancing the speed and cost-effectiveness of multiomics research.
Strategic Multiomics Market Outlook
The multiomics market is poised for substantial growth in the coming years, driven by continuous technological innovation, increasing adoption in various applications, and the expanding awareness of the benefits of personalized medicine. Strategic opportunities exist for companies to develop integrated solutions that streamline workflows and reduce costs, as well as to focus on applications in rapidly growing areas such as oncology, infectious disease, and drug discovery. The development of user-friendly software and data analysis tools will also be crucial for wider adoption of multiomics technologies. Partnerships and collaborations across industry and academia will be essential in accelerating the translation of research into clinical practice.
Multiomics Market Segmentation
-
1. Product
- 1.1. Instruments
- 1.2. Reagents
- 1.3. Other Products
-
2. Type
- 2.1. Single-cell Multiomics
- 2.2. Bulk Multiomics
-
3. Platform
- 3.1. Genomics
- 3.2. Transcriptomics
- 3.3. Proteomics
- 3.4. Metabolomics
- 3.5. Integrated Omics Platforms
- 3.6. Other Platforms
-
4. Application
- 4.1. Cell Biology
- 4.2. Oncology
- 4.3. Neurology
- 4.4. Immunology
- 4.5. Other Applications
-
5. End User
- 5.1. Academic and Research Institutes
- 5.2. Pharmaceutical & Biotechnology Companies
- 5.3. Other End Users
Multiomics Market Segmentation By Geography
-
1. North America
- 1.1. United States
- 1.2. Canada
- 1.3. Mexico
-
2. Europe
- 2.1. Germany
- 2.2. United Kingdom
- 2.3. France
- 2.4. Italy
- 2.5. Spain
- 2.6. Rest of Europe
-
3. Asia Pacific
- 3.1. China
- 3.2. Japan
- 3.3. India
- 3.4. Australia
- 3.5. South Korea
- 3.6. Rest of Asia Pacific
-
4. Middle East and Africa
- 4.1. GCC
- 4.2. South Africa
- 4.3. Rest of Middle East and Africa
-
5. South America
- 5.1. Brazil
- 5.2. Argentina
- 5.3. Rest of South America
Multiomics Market REPORT HIGHLIGHTS
| Aspects | Details |
|---|---|
| Study Period | 2019-2033 |
| Base Year | 2024 |
| Estimated Year | 2025 |
| Forecast Period | 2025-2033 |
| Historical Period | 2019-2024 |
| Growth Rate | CAGR of 15.26% from 2019-2033 |
| Segmentation |
|
Table of Contents
- 1. Introduction
- 1.1. Research Scope
- 1.2. Market Segmentation
- 1.3. Research Methodology
- 1.4. Definitions and Assumptions
- 2. Executive Summary
- 2.1. Introduction
- 3. Market Dynamics
- 3.1. Introduction
- 3.2. Market Drivers
- 3.2.1. Rising Demand for Single-cell Multiomics and Advancements in Omics Technologies; Increasing Investment in Genomics R&D; Growing Demand for Personalized Medicine
- 3.3. Market Restrains
- 3.3.1. Rising Demand for Single-cell Multiomics and Advancements in Omics Technologies; Increasing Investment in Genomics R&D; Growing Demand for Personalized Medicine
- 3.4. Market Trends
- 3.4.1. The Bulk Multiomics Segment is Expected to Hold the Largest Share of the Market
- 4. Market Factor Analysis
- 4.1. Porters Five Forces
- 4.2. Supply/Value Chain
- 4.3. PESTEL analysis
- 4.4. Market Entropy
- 4.5. Patent/Trademark Analysis
- 5. Global Multiomics Market Analysis, Insights and Forecast, 2019-2031
- 5.1. Market Analysis, Insights and Forecast - by Product
- 5.1.1. Instruments
- 5.1.2. Reagents
- 5.1.3. Other Products
- 5.2. Market Analysis, Insights and Forecast - by Type
- 5.2.1. Single-cell Multiomics
- 5.2.2. Bulk Multiomics
- 5.3. Market Analysis, Insights and Forecast - by Platform
- 5.3.1. Genomics
- 5.3.2. Transcriptomics
- 5.3.3. Proteomics
- 5.3.4. Metabolomics
- 5.3.5. Integrated Omics Platforms
- 5.3.6. Other Platforms
- 5.4. Market Analysis, Insights and Forecast - by Application
- 5.4.1. Cell Biology
- 5.4.2. Oncology
- 5.4.3. Neurology
- 5.4.4. Immunology
- 5.4.5. Other Applications
- 5.5. Market Analysis, Insights and Forecast - by End User
- 5.5.1. Academic and Research Institutes
- 5.5.2. Pharmaceutical & Biotechnology Companies
- 5.5.3. Other End Users
- 5.6. Market Analysis, Insights and Forecast - by Region
- 5.6.1. North America
- 5.6.2. Europe
- 5.6.3. Asia Pacific
- 5.6.4. Middle East and Africa
- 5.6.5. South America
- 5.1. Market Analysis, Insights and Forecast - by Product
- 6. North America Multiomics Market Analysis, Insights and Forecast, 2019-2031
- 6.1. Market Analysis, Insights and Forecast - by Product
- 6.1.1. Instruments
- 6.1.2. Reagents
- 6.1.3. Other Products
- 6.2. Market Analysis, Insights and Forecast - by Type
- 6.2.1. Single-cell Multiomics
- 6.2.2. Bulk Multiomics
- 6.3. Market Analysis, Insights and Forecast - by Platform
- 6.3.1. Genomics
- 6.3.2. Transcriptomics
- 6.3.3. Proteomics
- 6.3.4. Metabolomics
- 6.3.5. Integrated Omics Platforms
- 6.3.6. Other Platforms
- 6.4. Market Analysis, Insights and Forecast - by Application
- 6.4.1. Cell Biology
- 6.4.2. Oncology
- 6.4.3. Neurology
- 6.4.4. Immunology
- 6.4.5. Other Applications
- 6.5. Market Analysis, Insights and Forecast - by End User
- 6.5.1. Academic and Research Institutes
- 6.5.2. Pharmaceutical & Biotechnology Companies
- 6.5.3. Other End Users
- 6.1. Market Analysis, Insights and Forecast - by Product
- 7. Europe Multiomics Market Analysis, Insights and Forecast, 2019-2031
- 7.1. Market Analysis, Insights and Forecast - by Product
- 7.1.1. Instruments
- 7.1.2. Reagents
- 7.1.3. Other Products
- 7.2. Market Analysis, Insights and Forecast - by Type
- 7.2.1. Single-cell Multiomics
- 7.2.2. Bulk Multiomics
- 7.3. Market Analysis, Insights and Forecast - by Platform
- 7.3.1. Genomics
- 7.3.2. Transcriptomics
- 7.3.3. Proteomics
- 7.3.4. Metabolomics
- 7.3.5. Integrated Omics Platforms
- 7.3.6. Other Platforms
- 7.4. Market Analysis, Insights and Forecast - by Application
- 7.4.1. Cell Biology
- 7.4.2. Oncology
- 7.4.3. Neurology
- 7.4.4. Immunology
- 7.4.5. Other Applications
- 7.5. Market Analysis, Insights and Forecast - by End User
- 7.5.1. Academic and Research Institutes
- 7.5.2. Pharmaceutical & Biotechnology Companies
- 7.5.3. Other End Users
- 7.1. Market Analysis, Insights and Forecast - by Product
- 8. Asia Pacific Multiomics Market Analysis, Insights and Forecast, 2019-2031
- 8.1. Market Analysis, Insights and Forecast - by Product
- 8.1.1. Instruments
- 8.1.2. Reagents
- 8.1.3. Other Products
- 8.2. Market Analysis, Insights and Forecast - by Type
- 8.2.1. Single-cell Multiomics
- 8.2.2. Bulk Multiomics
- 8.3. Market Analysis, Insights and Forecast - by Platform
- 8.3.1. Genomics
- 8.3.2. Transcriptomics
- 8.3.3. Proteomics
- 8.3.4. Metabolomics
- 8.3.5. Integrated Omics Platforms
- 8.3.6. Other Platforms
- 8.4. Market Analysis, Insights and Forecast - by Application
- 8.4.1. Cell Biology
- 8.4.2. Oncology
- 8.4.3. Neurology
- 8.4.4. Immunology
- 8.4.5. Other Applications
- 8.5. Market Analysis, Insights and Forecast - by End User
- 8.5.1. Academic and Research Institutes
- 8.5.2. Pharmaceutical & Biotechnology Companies
- 8.5.3. Other End Users
- 8.1. Market Analysis, Insights and Forecast - by Product
- 9. Middle East and Africa Multiomics Market Analysis, Insights and Forecast, 2019-2031
- 9.1. Market Analysis, Insights and Forecast - by Product
- 9.1.1. Instruments
- 9.1.2. Reagents
- 9.1.3. Other Products
- 9.2. Market Analysis, Insights and Forecast - by Type
- 9.2.1. Single-cell Multiomics
- 9.2.2. Bulk Multiomics
- 9.3. Market Analysis, Insights and Forecast - by Platform
- 9.3.1. Genomics
- 9.3.2. Transcriptomics
- 9.3.3. Proteomics
- 9.3.4. Metabolomics
- 9.3.5. Integrated Omics Platforms
- 9.3.6. Other Platforms
- 9.4. Market Analysis, Insights and Forecast - by Application
- 9.4.1. Cell Biology
- 9.4.2. Oncology
- 9.4.3. Neurology
- 9.4.4. Immunology
- 9.4.5. Other Applications
- 9.5. Market Analysis, Insights and Forecast - by End User
- 9.5.1. Academic and Research Institutes
- 9.5.2. Pharmaceutical & Biotechnology Companies
- 9.5.3. Other End Users
- 9.1. Market Analysis, Insights and Forecast - by Product
- 10. South America Multiomics Market Analysis, Insights and Forecast, 2019-2031
- 10.1. Market Analysis, Insights and Forecast - by Product
- 10.1.1. Instruments
- 10.1.2. Reagents
- 10.1.3. Other Products
- 10.2. Market Analysis, Insights and Forecast - by Type
- 10.2.1. Single-cell Multiomics
- 10.2.2. Bulk Multiomics
- 10.3. Market Analysis, Insights and Forecast - by Platform
- 10.3.1. Genomics
- 10.3.2. Transcriptomics
- 10.3.3. Proteomics
- 10.3.4. Metabolomics
- 10.3.5. Integrated Omics Platforms
- 10.3.6. Other Platforms
- 10.4. Market Analysis, Insights and Forecast - by Application
- 10.4.1. Cell Biology
- 10.4.2. Oncology
- 10.4.3. Neurology
- 10.4.4. Immunology
- 10.4.5. Other Applications
- 10.5. Market Analysis, Insights and Forecast - by End User
- 10.5.1. Academic and Research Institutes
- 10.5.2. Pharmaceutical & Biotechnology Companies
- 10.5.3. Other End Users
- 10.1. Market Analysis, Insights and Forecast - by Product
- 11. Competitive Analysis
- 11.1. Global Market Share Analysis 2024
- 11.2. Company Profiles
- 11.2.1 Agilent Technologies Inc
- 11.2.1.1. Overview
- 11.2.1.2. Products
- 11.2.1.3. SWOT Analysis
- 11.2.1.4. Recent Developments
- 11.2.1.5. Financials (Based on Availability)
- 11.2.2 BD
- 11.2.2.1. Overview
- 11.2.2.2. Products
- 11.2.2.3. SWOT Analysis
- 11.2.2.4. Recent Developments
- 11.2.2.5. Financials (Based on Availability)
- 11.2.3 BGI
- 11.2.3.1. Overview
- 11.2.3.2. Products
- 11.2.3.3. SWOT Analysis
- 11.2.3.4. Recent Developments
- 11.2.3.5. Financials (Based on Availability)
- 11.2.4 Bruker
- 11.2.4.1. Overview
- 11.2.4.2. Products
- 11.2.4.3. SWOT Analysis
- 11.2.4.4. Recent Developments
- 11.2.4.5. Financials (Based on Availability)
- 11.2.5 DH Life Sciences LLC
- 11.2.5.1. Overview
- 11.2.5.2. Products
- 11.2.5.3. SWOT Analysis
- 11.2.5.4. Recent Developments
- 11.2.5.5. Financials (Based on Availability)
- 11.2.6 Illumina Inc
- 11.2.6.1. Overview
- 11.2.6.2. Products
- 11.2.6.3. SWOT Analysis
- 11.2.6.4. Recent Developments
- 11.2.6.5. Financials (Based on Availability)
- 11.2.7 Mission Bio
- 11.2.7.1. Overview
- 11.2.7.2. Products
- 11.2.7.3. SWOT Analysis
- 11.2.7.4. Recent Developments
- 11.2.7.5. Financials (Based on Availability)
- 11.2.8 NanoCellect Biomedical
- 11.2.8.1. Overview
- 11.2.8.2. Products
- 11.2.8.3. SWOT Analysis
- 11.2.8.4. Recent Developments
- 11.2.8.5. Financials (Based on Availability)
- 11.2.9 PerkinElmer Inc
- 11.2.9.1. Overview
- 11.2.9.2. Products
- 11.2.9.3. SWOT Analysis
- 11.2.9.4. Recent Developments
- 11.2.9.5. Financials (Based on Availability)
- 11.2.10 QIAGEN
- 11.2.10.1. Overview
- 11.2.10.2. Products
- 11.2.10.3. SWOT Analysis
- 11.2.10.4. Recent Developments
- 11.2.10.5. Financials (Based on Availability)
- 11.2.11 Shimadzu Corporation
- 11.2.11.1. Overview
- 11.2.11.2. Products
- 11.2.11.3. SWOT Analysis
- 11.2.11.4. Recent Developments
- 11.2.11.5. Financials (Based on Availability)
- 11.2.12 Singleron Biotechnologies
- 11.2.12.1. Overview
- 11.2.12.2. Products
- 11.2.12.3. SWOT Analysis
- 11.2.12.4. Recent Developments
- 11.2.12.5. Financials (Based on Availability)
- 11.2.13 Standard BioTools
- 11.2.13.1. Overview
- 11.2.13.2. Products
- 11.2.13.3. SWOT Analysis
- 11.2.13.4. Recent Developments
- 11.2.13.5. Financials (Based on Availability)
- 11.2.14 Thermo Fisher Scientific Inc *List Not Exhaustive
- 11.2.14.1. Overview
- 11.2.14.2. Products
- 11.2.14.3. SWOT Analysis
- 11.2.14.4. Recent Developments
- 11.2.14.5. Financials (Based on Availability)
- 11.2.1 Agilent Technologies Inc
List of Figures
- Figure 1: Global Multiomics Market Revenue Breakdown (Million, %) by Region 2024 & 2032
- Figure 2: Global Multiomics Market Volume Breakdown (Billion, %) by Region 2024 & 2032
- Figure 3: North America Multiomics Market Revenue (Million), by Product 2024 & 2032
- Figure 4: North America Multiomics Market Volume (Billion), by Product 2024 & 2032
- Figure 5: North America Multiomics Market Revenue Share (%), by Product 2024 & 2032
- Figure 6: North America Multiomics Market Volume Share (%), by Product 2024 & 2032
- Figure 7: North America Multiomics Market Revenue (Million), by Type 2024 & 2032
- Figure 8: North America Multiomics Market Volume (Billion), by Type 2024 & 2032
- Figure 9: North America Multiomics Market Revenue Share (%), by Type 2024 & 2032
- Figure 10: North America Multiomics Market Volume Share (%), by Type 2024 & 2032
- Figure 11: North America Multiomics Market Revenue (Million), by Platform 2024 & 2032
- Figure 12: North America Multiomics Market Volume (Billion), by Platform 2024 & 2032
- Figure 13: North America Multiomics Market Revenue Share (%), by Platform 2024 & 2032
- Figure 14: North America Multiomics Market Volume Share (%), by Platform 2024 & 2032
- Figure 15: North America Multiomics Market Revenue (Million), by Application 2024 & 2032
- Figure 16: North America Multiomics Market Volume (Billion), by Application 2024 & 2032
- Figure 17: North America Multiomics Market Revenue Share (%), by Application 2024 & 2032
- Figure 18: North America Multiomics Market Volume Share (%), by Application 2024 & 2032
- Figure 19: North America Multiomics Market Revenue (Million), by End User 2024 & 2032
- Figure 20: North America Multiomics Market Volume (Billion), by End User 2024 & 2032
- Figure 21: North America Multiomics Market Revenue Share (%), by End User 2024 & 2032
- Figure 22: North America Multiomics Market Volume Share (%), by End User 2024 & 2032
- Figure 23: North America Multiomics Market Revenue (Million), by Country 2024 & 2032
- Figure 24: North America Multiomics Market Volume (Billion), by Country 2024 & 2032
- Figure 25: North America Multiomics Market Revenue Share (%), by Country 2024 & 2032
- Figure 26: North America Multiomics Market Volume Share (%), by Country 2024 & 2032
- Figure 27: Europe Multiomics Market Revenue (Million), by Product 2024 & 2032
- Figure 28: Europe Multiomics Market Volume (Billion), by Product 2024 & 2032
- Figure 29: Europe Multiomics Market Revenue Share (%), by Product 2024 & 2032
- Figure 30: Europe Multiomics Market Volume Share (%), by Product 2024 & 2032
- Figure 31: Europe Multiomics Market Revenue (Million), by Type 2024 & 2032
- Figure 32: Europe Multiomics Market Volume (Billion), by Type 2024 & 2032
- Figure 33: Europe Multiomics Market Revenue Share (%), by Type 2024 & 2032
- Figure 34: Europe Multiomics Market Volume Share (%), by Type 2024 & 2032
- Figure 35: Europe Multiomics Market Revenue (Million), by Platform 2024 & 2032
- Figure 36: Europe Multiomics Market Volume (Billion), by Platform 2024 & 2032
- Figure 37: Europe Multiomics Market Revenue Share (%), by Platform 2024 & 2032
- Figure 38: Europe Multiomics Market Volume Share (%), by Platform 2024 & 2032
- Figure 39: Europe Multiomics Market Revenue (Million), by Application 2024 & 2032
- Figure 40: Europe Multiomics Market Volume (Billion), by Application 2024 & 2032
- Figure 41: Europe Multiomics Market Revenue Share (%), by Application 2024 & 2032
- Figure 42: Europe Multiomics Market Volume Share (%), by Application 2024 & 2032
- Figure 43: Europe Multiomics Market Revenue (Million), by End User 2024 & 2032
- Figure 44: Europe Multiomics Market Volume (Billion), by End User 2024 & 2032
- Figure 45: Europe Multiomics Market Revenue Share (%), by End User 2024 & 2032
- Figure 46: Europe Multiomics Market Volume Share (%), by End User 2024 & 2032
- Figure 47: Europe Multiomics Market Revenue (Million), by Country 2024 & 2032
- Figure 48: Europe Multiomics Market Volume (Billion), by Country 2024 & 2032
- Figure 49: Europe Multiomics Market Revenue Share (%), by Country 2024 & 2032
- Figure 50: Europe Multiomics Market Volume Share (%), by Country 2024 & 2032
- Figure 51: Asia Pacific Multiomics Market Revenue (Million), by Product 2024 & 2032
- Figure 52: Asia Pacific Multiomics Market Volume (Billion), by Product 2024 & 2032
- Figure 53: Asia Pacific Multiomics Market Revenue Share (%), by Product 2024 & 2032
- Figure 54: Asia Pacific Multiomics Market Volume Share (%), by Product 2024 & 2032
- Figure 55: Asia Pacific Multiomics Market Revenue (Million), by Type 2024 & 2032
- Figure 56: Asia Pacific Multiomics Market Volume (Billion), by Type 2024 & 2032
- Figure 57: Asia Pacific Multiomics Market Revenue Share (%), by Type 2024 & 2032
- Figure 58: Asia Pacific Multiomics Market Volume Share (%), by Type 2024 & 2032
- Figure 59: Asia Pacific Multiomics Market Revenue (Million), by Platform 2024 & 2032
- Figure 60: Asia Pacific Multiomics Market Volume (Billion), by Platform 2024 & 2032
- Figure 61: Asia Pacific Multiomics Market Revenue Share (%), by Platform 2024 & 2032
- Figure 62: Asia Pacific Multiomics Market Volume Share (%), by Platform 2024 & 2032
- Figure 63: Asia Pacific Multiomics Market Revenue (Million), by Application 2024 & 2032
- Figure 64: Asia Pacific Multiomics Market Volume (Billion), by Application 2024 & 2032
- Figure 65: Asia Pacific Multiomics Market Revenue Share (%), by Application 2024 & 2032
- Figure 66: Asia Pacific Multiomics Market Volume Share (%), by Application 2024 & 2032
- Figure 67: Asia Pacific Multiomics Market Revenue (Million), by End User 2024 & 2032
- Figure 68: Asia Pacific Multiomics Market Volume (Billion), by End User 2024 & 2032
- Figure 69: Asia Pacific Multiomics Market Revenue Share (%), by End User 2024 & 2032
- Figure 70: Asia Pacific Multiomics Market Volume Share (%), by End User 2024 & 2032
- Figure 71: Asia Pacific Multiomics Market Revenue (Million), by Country 2024 & 2032
- Figure 72: Asia Pacific Multiomics Market Volume (Billion), by Country 2024 & 2032
- Figure 73: Asia Pacific Multiomics Market Revenue Share (%), by Country 2024 & 2032
- Figure 74: Asia Pacific Multiomics Market Volume Share (%), by Country 2024 & 2032
- Figure 75: Middle East and Africa Multiomics Market Revenue (Million), by Product 2024 & 2032
- Figure 76: Middle East and Africa Multiomics Market Volume (Billion), by Product 2024 & 2032
- Figure 77: Middle East and Africa Multiomics Market Revenue Share (%), by Product 2024 & 2032
- Figure 78: Middle East and Africa Multiomics Market Volume Share (%), by Product 2024 & 2032
- Figure 79: Middle East and Africa Multiomics Market Revenue (Million), by Type 2024 & 2032
- Figure 80: Middle East and Africa Multiomics Market Volume (Billion), by Type 2024 & 2032
- Figure 81: Middle East and Africa Multiomics Market Revenue Share (%), by Type 2024 & 2032
- Figure 82: Middle East and Africa Multiomics Market Volume Share (%), by Type 2024 & 2032
- Figure 83: Middle East and Africa Multiomics Market Revenue (Million), by Platform 2024 & 2032
- Figure 84: Middle East and Africa Multiomics Market Volume (Billion), by Platform 2024 & 2032
- Figure 85: Middle East and Africa Multiomics Market Revenue Share (%), by Platform 2024 & 2032
- Figure 86: Middle East and Africa Multiomics Market Volume Share (%), by Platform 2024 & 2032
- Figure 87: Middle East and Africa Multiomics Market Revenue (Million), by Application 2024 & 2032
- Figure 88: Middle East and Africa Multiomics Market Volume (Billion), by Application 2024 & 2032
- Figure 89: Middle East and Africa Multiomics Market Revenue Share (%), by Application 2024 & 2032
- Figure 90: Middle East and Africa Multiomics Market Volume Share (%), by Application 2024 & 2032
- Figure 91: Middle East and Africa Multiomics Market Revenue (Million), by End User 2024 & 2032
- Figure 92: Middle East and Africa Multiomics Market Volume (Billion), by End User 2024 & 2032
- Figure 93: Middle East and Africa Multiomics Market Revenue Share (%), by End User 2024 & 2032
- Figure 94: Middle East and Africa Multiomics Market Volume Share (%), by End User 2024 & 2032
- Figure 95: Middle East and Africa Multiomics Market Revenue (Million), by Country 2024 & 2032
- Figure 96: Middle East and Africa Multiomics Market Volume (Billion), by Country 2024 & 2032
- Figure 97: Middle East and Africa Multiomics Market Revenue Share (%), by Country 2024 & 2032
- Figure 98: Middle East and Africa Multiomics Market Volume Share (%), by Country 2024 & 2032
- Figure 99: South America Multiomics Market Revenue (Million), by Product 2024 & 2032
- Figure 100: South America Multiomics Market Volume (Billion), by Product 2024 & 2032
- Figure 101: South America Multiomics Market Revenue Share (%), by Product 2024 & 2032
- Figure 102: South America Multiomics Market Volume Share (%), by Product 2024 & 2032
- Figure 103: South America Multiomics Market Revenue (Million), by Type 2024 & 2032
- Figure 104: South America Multiomics Market Volume (Billion), by Type 2024 & 2032
- Figure 105: South America Multiomics Market Revenue Share (%), by Type 2024 & 2032
- Figure 106: South America Multiomics Market Volume Share (%), by Type 2024 & 2032
- Figure 107: South America Multiomics Market Revenue (Million), by Platform 2024 & 2032
- Figure 108: South America Multiomics Market Volume (Billion), by Platform 2024 & 2032
- Figure 109: South America Multiomics Market Revenue Share (%), by Platform 2024 & 2032
- Figure 110: South America Multiomics Market Volume Share (%), by Platform 2024 & 2032
- Figure 111: South America Multiomics Market Revenue (Million), by Application 2024 & 2032
- Figure 112: South America Multiomics Market Volume (Billion), by Application 2024 & 2032
- Figure 113: South America Multiomics Market Revenue Share (%), by Application 2024 & 2032
- Figure 114: South America Multiomics Market Volume Share (%), by Application 2024 & 2032
- Figure 115: South America Multiomics Market Revenue (Million), by End User 2024 & 2032
- Figure 116: South America Multiomics Market Volume (Billion), by End User 2024 & 2032
- Figure 117: South America Multiomics Market Revenue Share (%), by End User 2024 & 2032
- Figure 118: South America Multiomics Market Volume Share (%), by End User 2024 & 2032
- Figure 119: South America Multiomics Market Revenue (Million), by Country 2024 & 2032
- Figure 120: South America Multiomics Market Volume (Billion), by Country 2024 & 2032
- Figure 121: South America Multiomics Market Revenue Share (%), by Country 2024 & 2032
- Figure 122: South America Multiomics Market Volume Share (%), by Country 2024 & 2032
List of Tables
- Table 1: Global Multiomics Market Revenue Million Forecast, by Region 2019 & 2032
- Table 2: Global Multiomics Market Volume Billion Forecast, by Region 2019 & 2032
- Table 3: Global Multiomics Market Revenue Million Forecast, by Product 2019 & 2032
- Table 4: Global Multiomics Market Volume Billion Forecast, by Product 2019 & 2032
- Table 5: Global Multiomics Market Revenue Million Forecast, by Type 2019 & 2032
- Table 6: Global Multiomics Market Volume Billion Forecast, by Type 2019 & 2032
- Table 7: Global Multiomics Market Revenue Million Forecast, by Platform 2019 & 2032
- Table 8: Global Multiomics Market Volume Billion Forecast, by Platform 2019 & 2032
- Table 9: Global Multiomics Market Revenue Million Forecast, by Application 2019 & 2032
- Table 10: Global Multiomics Market Volume Billion Forecast, by Application 2019 & 2032
- Table 11: Global Multiomics Market Revenue Million Forecast, by End User 2019 & 2032
- Table 12: Global Multiomics Market Volume Billion Forecast, by End User 2019 & 2032
- Table 13: Global Multiomics Market Revenue Million Forecast, by Region 2019 & 2032
- Table 14: Global Multiomics Market Volume Billion Forecast, by Region 2019 & 2032
- Table 15: Global Multiomics Market Revenue Million Forecast, by Product 2019 & 2032
- Table 16: Global Multiomics Market Volume Billion Forecast, by Product 2019 & 2032
- Table 17: Global Multiomics Market Revenue Million Forecast, by Type 2019 & 2032
- Table 18: Global Multiomics Market Volume Billion Forecast, by Type 2019 & 2032
- Table 19: Global Multiomics Market Revenue Million Forecast, by Platform 2019 & 2032
- Table 20: Global Multiomics Market Volume Billion Forecast, by Platform 2019 & 2032
- Table 21: Global Multiomics Market Revenue Million Forecast, by Application 2019 & 2032
- Table 22: Global Multiomics Market Volume Billion Forecast, by Application 2019 & 2032
- Table 23: Global Multiomics Market Revenue Million Forecast, by End User 2019 & 2032
- Table 24: Global Multiomics Market Volume Billion Forecast, by End User 2019 & 2032
- Table 25: Global Multiomics Market Revenue Million Forecast, by Country 2019 & 2032
- Table 26: Global Multiomics Market Volume Billion Forecast, by Country 2019 & 2032
- Table 27: United States Multiomics Market Revenue (Million) Forecast, by Application 2019 & 2032
- Table 28: United States Multiomics Market Volume (Billion) Forecast, by Application 2019 & 2032
- Table 29: Canada Multiomics Market Revenue (Million) Forecast, by Application 2019 & 2032
- Table 30: Canada Multiomics Market Volume (Billion) Forecast, by Application 2019 & 2032
- Table 31: Mexico Multiomics Market Revenue (Million) Forecast, by Application 2019 & 2032
- Table 32: Mexico Multiomics Market Volume (Billion) Forecast, by Application 2019 & 2032
- Table 33: Global Multiomics Market Revenue Million Forecast, by Product 2019 & 2032
- Table 34: Global Multiomics Market Volume Billion Forecast, by Product 2019 & 2032
- Table 35: Global Multiomics Market Revenue Million Forecast, by Type 2019 & 2032
- Table 36: Global Multiomics Market Volume Billion Forecast, by Type 2019 & 2032
- Table 37: Global Multiomics Market Revenue Million Forecast, by Platform 2019 & 2032
- Table 38: Global Multiomics Market Volume Billion Forecast, by Platform 2019 & 2032
- Table 39: Global Multiomics Market Revenue Million Forecast, by Application 2019 & 2032
- Table 40: Global Multiomics Market Volume Billion Forecast, by Application 2019 & 2032
- Table 41: Global Multiomics Market Revenue Million Forecast, by End User 2019 & 2032
- Table 42: Global Multiomics Market Volume Billion Forecast, by End User 2019 & 2032
- Table 43: Global Multiomics Market Revenue Million Forecast, by Country 2019 & 2032
- Table 44: Global Multiomics Market Volume Billion Forecast, by Country 2019 & 2032
- Table 45: Germany Multiomics Market Revenue (Million) Forecast, by Application 2019 & 2032
- Table 46: Germany Multiomics Market Volume (Billion) Forecast, by Application 2019 & 2032
- Table 47: United Kingdom Multiomics Market Revenue (Million) Forecast, by Application 2019 & 2032
- Table 48: United Kingdom Multiomics Market Volume (Billion) Forecast, by Application 2019 & 2032
- Table 49: France Multiomics Market Revenue (Million) Forecast, by Application 2019 & 2032
- Table 50: France Multiomics Market Volume (Billion) Forecast, by Application 2019 & 2032
- Table 51: Italy Multiomics Market Revenue (Million) Forecast, by Application 2019 & 2032
- Table 52: Italy Multiomics Market Volume (Billion) Forecast, by Application 2019 & 2032
- Table 53: Spain Multiomics Market Revenue (Million) Forecast, by Application 2019 & 2032
- Table 54: Spain Multiomics Market Volume (Billion) Forecast, by Application 2019 & 2032
- Table 55: Rest of Europe Multiomics Market Revenue (Million) Forecast, by Application 2019 & 2032
- Table 56: Rest of Europe Multiomics Market Volume (Billion) Forecast, by Application 2019 & 2032
- Table 57: Global Multiomics Market Revenue Million Forecast, by Product 2019 & 2032
- Table 58: Global Multiomics Market Volume Billion Forecast, by Product 2019 & 2032
- Table 59: Global Multiomics Market Revenue Million Forecast, by Type 2019 & 2032
- Table 60: Global Multiomics Market Volume Billion Forecast, by Type 2019 & 2032
- Table 61: Global Multiomics Market Revenue Million Forecast, by Platform 2019 & 2032
- Table 62: Global Multiomics Market Volume Billion Forecast, by Platform 2019 & 2032
- Table 63: Global Multiomics Market Revenue Million Forecast, by Application 2019 & 2032
- Table 64: Global Multiomics Market Volume Billion Forecast, by Application 2019 & 2032
- Table 65: Global Multiomics Market Revenue Million Forecast, by End User 2019 & 2032
- Table 66: Global Multiomics Market Volume Billion Forecast, by End User 2019 & 2032
- Table 67: Global Multiomics Market Revenue Million Forecast, by Country 2019 & 2032
- Table 68: Global Multiomics Market Volume Billion Forecast, by Country 2019 & 2032
- Table 69: China Multiomics Market Revenue (Million) Forecast, by Application 2019 & 2032
- Table 70: China Multiomics Market Volume (Billion) Forecast, by Application 2019 & 2032
- Table 71: Japan Multiomics Market Revenue (Million) Forecast, by Application 2019 & 2032
- Table 72: Japan Multiomics Market Volume (Billion) Forecast, by Application 2019 & 2032
- Table 73: India Multiomics Market Revenue (Million) Forecast, by Application 2019 & 2032
- Table 74: India Multiomics Market Volume (Billion) Forecast, by Application 2019 & 2032
- Table 75: Australia Multiomics Market Revenue (Million) Forecast, by Application 2019 & 2032
- Table 76: Australia Multiomics Market Volume (Billion) Forecast, by Application 2019 & 2032
- Table 77: South Korea Multiomics Market Revenue (Million) Forecast, by Application 2019 & 2032
- Table 78: South Korea Multiomics Market Volume (Billion) Forecast, by Application 2019 & 2032
- Table 79: Rest of Asia Pacific Multiomics Market Revenue (Million) Forecast, by Application 2019 & 2032
- Table 80: Rest of Asia Pacific Multiomics Market Volume (Billion) Forecast, by Application 2019 & 2032
- Table 81: Global Multiomics Market Revenue Million Forecast, by Product 2019 & 2032
- Table 82: Global Multiomics Market Volume Billion Forecast, by Product 2019 & 2032
- Table 83: Global Multiomics Market Revenue Million Forecast, by Type 2019 & 2032
- Table 84: Global Multiomics Market Volume Billion Forecast, by Type 2019 & 2032
- Table 85: Global Multiomics Market Revenue Million Forecast, by Platform 2019 & 2032
- Table 86: Global Multiomics Market Volume Billion Forecast, by Platform 2019 & 2032
- Table 87: Global Multiomics Market Revenue Million Forecast, by Application 2019 & 2032
- Table 88: Global Multiomics Market Volume Billion Forecast, by Application 2019 & 2032
- Table 89: Global Multiomics Market Revenue Million Forecast, by End User 2019 & 2032
- Table 90: Global Multiomics Market Volume Billion Forecast, by End User 2019 & 2032
- Table 91: Global Multiomics Market Revenue Million Forecast, by Country 2019 & 2032
- Table 92: Global Multiomics Market Volume Billion Forecast, by Country 2019 & 2032
- Table 93: GCC Multiomics Market Revenue (Million) Forecast, by Application 2019 & 2032
- Table 94: GCC Multiomics Market Volume (Billion) Forecast, by Application 2019 & 2032
- Table 95: South Africa Multiomics Market Revenue (Million) Forecast, by Application 2019 & 2032
- Table 96: South Africa Multiomics Market Volume (Billion) Forecast, by Application 2019 & 2032
- Table 97: Rest of Middle East and Africa Multiomics Market Revenue (Million) Forecast, by Application 2019 & 2032
- Table 98: Rest of Middle East and Africa Multiomics Market Volume (Billion) Forecast, by Application 2019 & 2032
- Table 99: Global Multiomics Market Revenue Million Forecast, by Product 2019 & 2032
- Table 100: Global Multiomics Market Volume Billion Forecast, by Product 2019 & 2032
- Table 101: Global Multiomics Market Revenue Million Forecast, by Type 2019 & 2032
- Table 102: Global Multiomics Market Volume Billion Forecast, by Type 2019 & 2032
- Table 103: Global Multiomics Market Revenue Million Forecast, by Platform 2019 & 2032
- Table 104: Global Multiomics Market Volume Billion Forecast, by Platform 2019 & 2032
- Table 105: Global Multiomics Market Revenue Million Forecast, by Application 2019 & 2032
- Table 106: Global Multiomics Market Volume Billion Forecast, by Application 2019 & 2032
- Table 107: Global Multiomics Market Revenue Million Forecast, by End User 2019 & 2032
- Table 108: Global Multiomics Market Volume Billion Forecast, by End User 2019 & 2032
- Table 109: Global Multiomics Market Revenue Million Forecast, by Country 2019 & 2032
- Table 110: Global Multiomics Market Volume Billion Forecast, by Country 2019 & 2032
- Table 111: Brazil Multiomics Market Revenue (Million) Forecast, by Application 2019 & 2032
- Table 112: Brazil Multiomics Market Volume (Billion) Forecast, by Application 2019 & 2032
- Table 113: Argentina Multiomics Market Revenue (Million) Forecast, by Application 2019 & 2032
- Table 114: Argentina Multiomics Market Volume (Billion) Forecast, by Application 2019 & 2032
- Table 115: Rest of South America Multiomics Market Revenue (Million) Forecast, by Application 2019 & 2032
- Table 116: Rest of South America Multiomics Market Volume (Billion) Forecast, by Application 2019 & 2032
Frequently Asked Questions
1. What is the projected Compound Annual Growth Rate (CAGR) of the Multiomics Market?
The projected CAGR is approximately 15.26%.
2. Which companies are prominent players in the Multiomics Market?
Key companies in the market include Agilent Technologies Inc, BD, BGI, Bruker, DH Life Sciences LLC, Illumina Inc, Mission Bio, NanoCellect Biomedical, PerkinElmer Inc, QIAGEN, Shimadzu Corporation, Singleron Biotechnologies, Standard BioTools, Thermo Fisher Scientific Inc *List Not Exhaustive.
3. What are the main segments of the Multiomics Market?
The market segments include Product, Type, Platform, Application, End User.
4. Can you provide details about the market size?
The market size is estimated to be USD 3.11 Million as of 2022.
5. What are some drivers contributing to market growth?
Rising Demand for Single-cell Multiomics and Advancements in Omics Technologies; Increasing Investment in Genomics R&D; Growing Demand for Personalized Medicine.
6. What are the notable trends driving market growth?
The Bulk Multiomics Segment is Expected to Hold the Largest Share of the Market.
7. Are there any restraints impacting market growth?
Rising Demand for Single-cell Multiomics and Advancements in Omics Technologies; Increasing Investment in Genomics R&D; Growing Demand for Personalized Medicine.
8. Can you provide examples of recent developments in the market?
February 2024: Vizzhy Inc. launched the world's inaugural Multiomics Lab in Bengaluru, India, heralding a major advancement in healthcare innovation. Equipped with cutting-edge tools and health AI technology, the lab enables physicians to pinpoint root causes and offer personalized recommendations for their patients.September 2023: MGI, a provider of technology and tools for life science, introduced the DCS Lab Initiative to stimulate crucial scientific research. This initiative encourages large-scale multiomics laboratories. Under the initiative, the organization offers products for numerous applications, including cell omics, DNA sequencing, and spatial omics based on DNBSEQ technologies, to specified research institutions globally.April 2023: Biomodal, formerly Cambridge Epigenetix, introduced a new duet multiomics solution that can enable simultaneous phased reading of epigenetic and genetic information in a single, low-volume sample.
9. What pricing options are available for accessing the report?
Pricing options include single-user, multi-user, and enterprise licenses priced at USD 4750, USD 5250, and USD 8750 respectively.
10. Is the market size provided in terms of value or volume?
The market size is provided in terms of value, measured in Million and volume, measured in Billion.
11. Are there any specific market keywords associated with the report?
Yes, the market keyword associated with the report is "Multiomics Market," which aids in identifying and referencing the specific market segment covered.
12. How do I determine which pricing option suits my needs best?
The pricing options vary based on user requirements and access needs. Individual users may opt for single-user licenses, while businesses requiring broader access may choose multi-user or enterprise licenses for cost-effective access to the report.
13. Are there any additional resources or data provided in the Multiomics Market report?
While the report offers comprehensive insights, it's advisable to review the specific contents or supplementary materials provided to ascertain if additional resources or data are available.
14. How can I stay updated on further developments or reports in the Multiomics Market?
To stay informed about further developments, trends, and reports in the Multiomics Market, consider subscribing to industry newsletters, following relevant companies and organizations, or regularly checking reputable industry news sources and publications.
Methodology
Step 1 - Identification of Relevant Samples Size from Population Database


Step 2 - Approaches for Defining Global Market Size (Value, Volume* & Price*)

Note*: In applicable scenarios
Step 3 - Data Sources
Primary Research
- Web Analytics
- Survey Reports
- Research Institute
- Latest Research Reports
- Opinion Leaders
Secondary Research
- Annual Reports
- White Paper
- Latest Press Release
- Industry Association
- Paid Database
- Investor Presentations

Step 4 - Data Triangulation
Involves using different sources of information in order to increase the validity of a study
These sources are likely to be stakeholders in a program - participants, other researchers, program staff, other community members, and so on.
Then we put all data in single framework & apply various statistical tools to find out the dynamic on the market.
During the analysis stage, feedback from the stakeholder groups would be compared to determine areas of agreement as well as areas of divergence


