
Key Insights
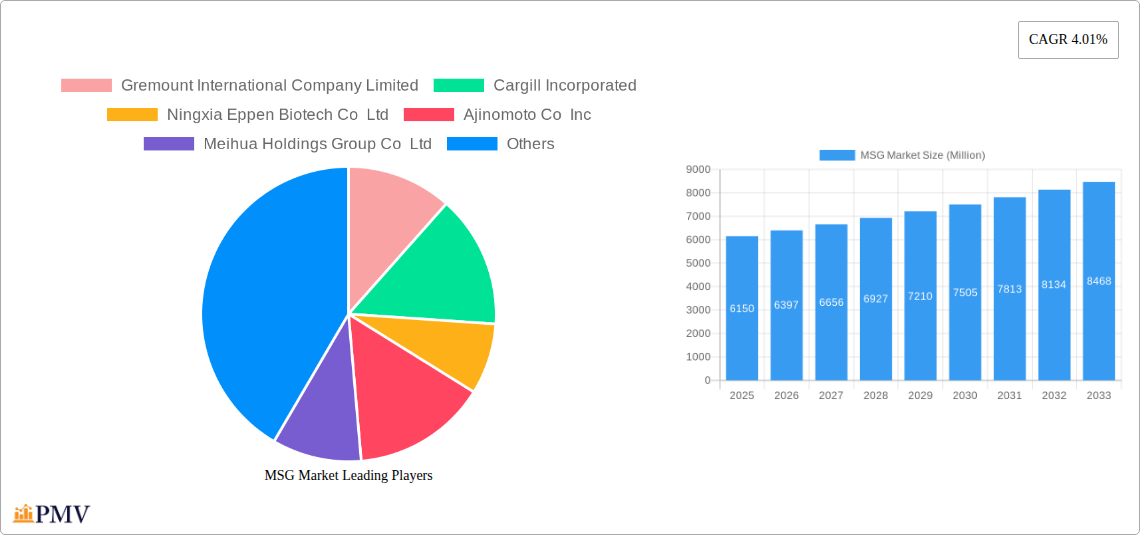
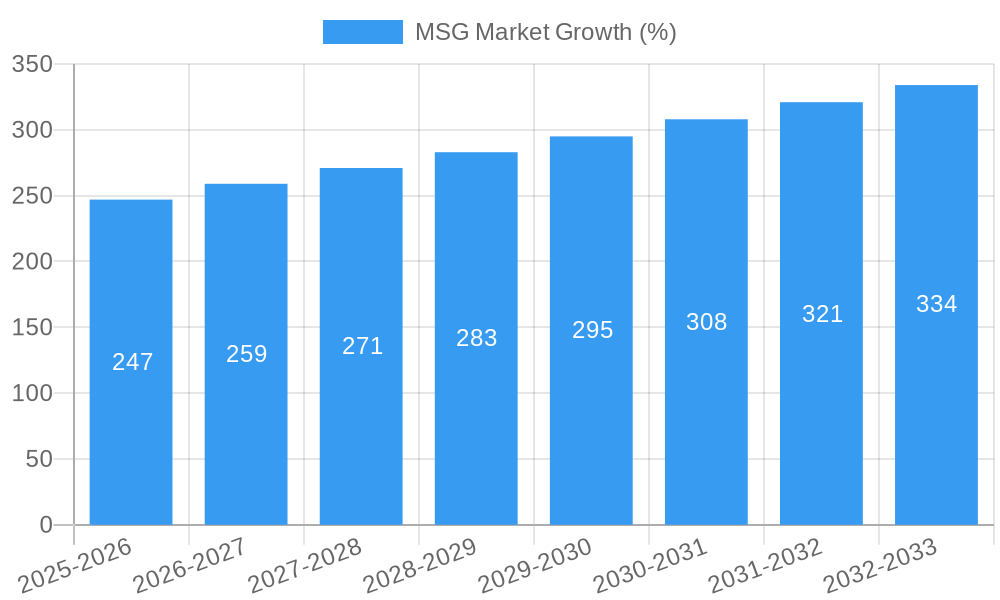
The global monosodium glutamate (MSG) market, valued at $6.15 billion in 2025, is projected to experience robust growth, driven by increasing demand from the food and beverage industry. This growth is fueled by several key factors. The rising popularity of processed foods, particularly noodles, soups, and savory snacks, significantly boosts MSG consumption. Furthermore, MSG's crucial role as a flavor enhancer in meat products and seasonings contributes to market expansion. The Asia-Pacific region, with its established culinary traditions incorporating MSG, remains a dominant market segment. However, growing consumer awareness regarding health concerns associated with excessive MSG intake presents a significant restraint. This necessitates the industry's focus on promoting responsible consumption and highlighting MSG's role as a safe and effective flavor enhancer when used in moderation. The market is expected to witness innovation in MSG production, with a focus on sustainable and cost-effective methods. This includes exploring alternative production processes and utilizing byproducts to minimize environmental impact and reduce costs. Competition among major players such as Ajinomoto, Cargill, and Meihua Holdings is intensifying, leading to strategic partnerships, mergers, and acquisitions, and driving further market evolution. The projected Compound Annual Growth Rate (CAGR) of 4.01% from 2025 to 2033 suggests a steady and consistent market expansion, indicating significant opportunities for growth and investment in the MSG sector.
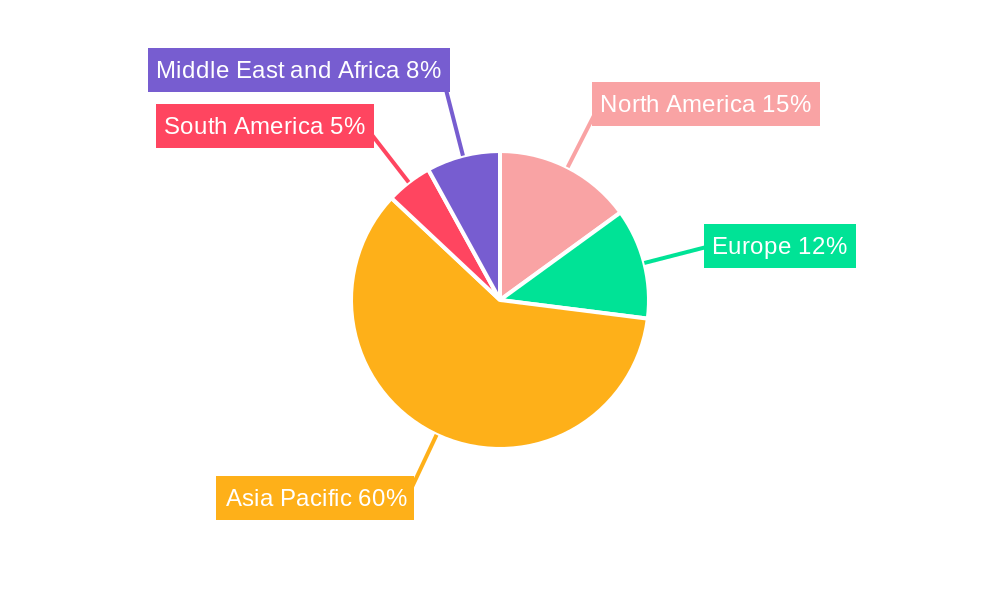
The segmentation of the MSG market by application reveals noodles, soups, and broth as leading consumers. Meat products and seasonings & dressings represent further significant segments, underscoring the versatility of MSG in enhancing the taste of diverse food products. North America and Europe, while possessing a smaller market share compared to the Asia-Pacific region, are expected to witness growth driven by the increasing demand for convenience foods and processed snacks. The Middle East and Africa are projected to experience moderate growth, driven by evolving consumer preferences and increasing urbanization. Strategies for future market penetration might focus on educating consumers about responsible MSG usage, coupled with the development of innovative and healthier MSG-based products. Furthermore, strategic partnerships with food manufacturers are key to expand the reach and application of MSG in various food categories.
MSG Market: A Comprehensive Market Analysis (2019-2033)
This comprehensive report provides an in-depth analysis of the global MSG (monosodium glutamate) market, offering invaluable insights for industry stakeholders seeking to navigate the complexities of this dynamic sector. With a study period spanning from 2019 to 2033, including a base year of 2025 and a forecast period from 2025 to 2033, this report presents a meticulously researched overview of market trends, competitive dynamics, and growth prospects. The global MSG market is projected to reach xx Million by 2033, exhibiting a CAGR of xx% during the forecast period.
MSG Market Market Structure & Competitive Dynamics
The global MSG market exhibits a moderately concentrated structure, with a few major players holding significant market share. Key players such as Ajinomoto Co Inc, Cargill Incorporated, and Meihua Holdings Group Co Ltd, control a combined xx% of the market (2024). The market’s competitive landscape is characterized by intense rivalry, driven by factors such as product innovation, pricing strategies, and geographical expansion. Innovation ecosystems are primarily focused on enhancing production efficiency, improving product quality (e.g., reduced impurities, improved taste), and developing new applications for MSG.
Regulatory frameworks vary across different regions, impacting production and labeling requirements. The presence of viable substitutes, such as yeast extract and other natural flavor enhancers, poses a moderate competitive threat. End-user trends indicate growing demand from the food processing industry, particularly in rapidly developing economies. M&A activities within the MSG market have been relatively frequent in recent years, with deal values totaling approximately xx Million during the historical period (2019-2024). These mergers and acquisitions frequently focus on expanding geographical reach, consolidating market share, and accessing new technologies.
- Market Concentration: High, with top 5 players accounting for xx% of global revenue.
- M&A Activity: Significant, with deal values totaling approximately xx Million between 2019 and 2024.
- Innovation Focus: Production efficiency, product quality, and new applications.
- Regulatory Landscape: Varies across regions, impacting production and labeling.
- Substitute Products: Yeast extract and other natural flavor enhancers pose a moderate competitive threat.
MSG Market Industry Trends & Insights
The MSG market is driven by several key factors, including increasing global population, rising disposable incomes, particularly in emerging markets, and the growing preference for convenience foods. Technological advancements in MSG production, focusing on sustainability and efficiency, are contributing to cost reductions and enhanced product quality. Consumer preferences are evolving towards healthier and more natural food products, prompting some MSG manufacturers to focus on cleaner labeling and enhanced transparency.
Competitive dynamics are shaped by ongoing innovations, strategic partnerships, and the relentless pursuit of market share. The market is witnessing a shift towards more sustainable and ethical sourcing of raw materials, reflecting growing consumer awareness of environmental and social issues. The CAGR for the MSG market during the forecast period is estimated at xx%, driven primarily by growth in emerging economies. Market penetration of MSG in various food applications continues to increase, particularly in regions with high consumption of processed foods.
Dominant Markets & Segments in MSG Market
The Asia-Pacific region dominates the global MSG market, accounting for approximately xx% of global revenue in 2024. This dominance is largely attributed to high consumption of MSG-containing foods and the presence of major MSG producers within the region. China specifically holds the largest national market share due to its vast population and high demand for processed foods.
- Key Drivers in Asia-Pacific:
- High consumption of MSG-containing foods (Noodles, Soups and Broth).
- Established manufacturing base.
- Rapid economic growth and urbanization.
- Segment Dominance:
- Noodles: This segment holds the largest share of the MSG market due to the widespread consumption of noodles globally.
- Soups and Broth: The convenient nature of soups and broths, frequently seasoned with MSG, also drives substantial demand.
- Meat Products: MSG enhances the flavor of processed meat products, contributing significant demand.
The "Noodles" application segment displays the highest growth rate due to expanding noodle consumption in Asia and globally. This is followed closely by "Soups and Broth," also benefiting from high consumption rates in various cultures. The "Meat Products" segment contributes significantly, showcasing the ubiquitous use of MSG in enhancing meat flavor. Economic policies promoting food processing industries in emerging markets further amplify demand. Developed infrastructure supporting efficient food distribution networks also enhances the widespread use of MSG across varied applications.
MSG Market Product Innovations
Recent product innovations in the MSG market focus on enhancing the quality and functionality of MSG products. This includes developing MSG with improved flavor profiles, extended shelf life, and enhanced solubility. Technological advancements have also led to improved production processes, resulting in reduced costs and increased sustainability. These innovations contribute to a more competitive landscape, attracting various consumer segments and expanding market penetration.
Report Segmentation & Scope
This report segments the MSG market by application:
- Noodles: This segment accounts for xx% of market revenue in 2024 and is projected to grow at a CAGR of xx% during the forecast period. Competitive dynamics are characterized by a mix of large and small players.
- Soups and Broth: This segment accounts for xx% of market revenue in 2024 and is projected to grow at a CAGR of xx% during the forecast period. Competition is similar to the noodles segment, with a mix of players.
- Meat Products: This segment represents xx% of the market revenue in 2024, projected to grow at a CAGR of xx% during the forecast period. Competition is relatively intense in this segment.
- Seasonings and Dressings: This segment constitutes xx% of market revenue in 2024 and is projected to grow at a CAGR of xx% during the forecast period. Growth is fueled by increasing demand for convenience foods.
- Other Applications: This segment includes various minor applications, collectively representing xx% of the market in 2024, with a projected CAGR of xx% during the forecast period.
Key Drivers of MSG Market Growth
Key drivers for the MSG market's growth include the surging global population requiring food sources, the increasing preference for ready-to-eat meals and processed foods, and expanding food processing industries, particularly in developing economies. Furthermore, technological advancements in manufacturing, leading to cost reductions and enhanced product quality, also fuel market expansion. Government support for the food processing sector in several regions provides further impetus.
Challenges in the MSG Market Sector
The MSG market faces challenges such as stringent regulatory requirements regarding labeling and food additives in certain regions. Fluctuations in raw material prices and supply chain disruptions can impact production costs and profitability. Intense competition among manufacturers necessitates continuous innovation and efficiency improvements to maintain market share. Consumer perceptions regarding the health implications of MSG consumption also pose a challenge, though this is mitigated by increased transparency and education efforts by producers.
Leading Players in the MSG Market Market
- Ajinomoto Co Inc
- Cargill Incorporated
- Gremount International Company Limited
- Ningxia Eppen Biotech Co Ltd
- Meihua Holdings Group Co Ltd
- Shandong Xinle Monosodium Glutamate Limited Company
- COFCO
- Fufeng Group
- Shandong Qilu Biotechnology Group Co
- Henan Lotus Flower Gourmet Powder Co
Key Developments in MSG Market Sector
- 2022-Q4: Ajinomoto Co Inc launched a new line of MSG products with enhanced flavor profiles.
- 2023-Q1: Cargill Incorporated announced a significant investment in expanding its MSG production capacity in Asia.
- 2023-Q3: Meihua Holdings Group Co Ltd acquired a smaller MSG producer, expanding its market share. (Further developments would be detailed in the full report.)
Strategic MSG Market Market Outlook
The MSG market exhibits significant future potential, driven by continued growth in the food processing industry and increasing demand for convenient and flavorful foods globally. Strategic opportunities lie in developing innovative MSG products with enhanced functionality and health benefits, expanding into new geographical markets, and investing in sustainable and efficient production methods. Focus on transparency regarding ingredients and health concerns will remain critical for sustained growth and market acceptance.
MSG Market Segmentation
-
1. Application
- 1.1. Noodles, Soups and Broth
- 1.2. Meat Products
- 1.3. Seasonings and Dressings
- 1.4. Other Applications
MSG Market Segmentation By Geography
-
1. North America
- 1.1. United States
- 1.2. Canada
- 1.3. Mexico
- 1.4. Rest of North America
-
2. Europe
- 2.1. Germany
- 2.2. United Kingdom
- 2.3. France
- 2.4. Russia
- 2.5. Rest of Europe
-
3. Asia Pacific
- 3.1. China
- 3.2. Japan
- 3.3. India
- 3.4. Australia
- 3.5. Rest of Asia Pacific
-
4. South America
- 4.1. Brazil
- 4.2. Argentina
- 4.3. Rest of South America
-
5. Middle East and Africa
- 5.1. South Africa
- 5.2. United Arab Emirates
- 5.3. Rest of Middle East and Africa
MSG Market REPORT HIGHLIGHTS
| Aspects | Details |
|---|---|
| Study Period | 2019-2033 |
| Base Year | 2024 |
| Estimated Year | 2025 |
| Forecast Period | 2025-2033 |
| Historical Period | 2019-2024 |
| Growth Rate | CAGR of 4.01% from 2019-2033 |
| Segmentation |
|
Table of Contents
- 1. Introduction
- 1.1. Research Scope
- 1.2. Market Segmentation
- 1.3. Research Methodology
- 1.4. Definitions and Assumptions
- 2. Executive Summary
- 2.1. Introduction
- 3. Market Dynamics
- 3.1. Introduction
- 3.2. Market Drivers
- 3.2.1. Consumer inclination toward functional food and beverages; Increasing Number of Applications and Growing Industrial Use
- 3.3. Market Restrains
- 3.3.1. Increasing Shift Toward Plant-Based Protein
- 3.4. Market Trends
- 3.4.1. Rising Demand for Ready -To-Eat and Processed Food
- 4. Market Factor Analysis
- 4.1. Porters Five Forces
- 4.2. Supply/Value Chain
- 4.3. PESTEL analysis
- 4.4. Market Entropy
- 4.5. Patent/Trademark Analysis
- 5. Global MSG Market Analysis, Insights and Forecast, 2019-2031
- 5.1. Market Analysis, Insights and Forecast - by Application
- 5.1.1. Noodles, Soups and Broth
- 5.1.2. Meat Products
- 5.1.3. Seasonings and Dressings
- 5.1.4. Other Applications
- 5.2. Market Analysis, Insights and Forecast - by Region
- 5.2.1. North America
- 5.2.2. Europe
- 5.2.3. Asia Pacific
- 5.2.4. South America
- 5.2.5. Middle East and Africa
- 5.1. Market Analysis, Insights and Forecast - by Application
- 6. North America MSG Market Analysis, Insights and Forecast, 2019-2031
- 6.1. Market Analysis, Insights and Forecast - by Application
- 6.1.1. Noodles, Soups and Broth
- 6.1.2. Meat Products
- 6.1.3. Seasonings and Dressings
- 6.1.4. Other Applications
- 6.1. Market Analysis, Insights and Forecast - by Application
- 7. Europe MSG Market Analysis, Insights and Forecast, 2019-2031
- 7.1. Market Analysis, Insights and Forecast - by Application
- 7.1.1. Noodles, Soups and Broth
- 7.1.2. Meat Products
- 7.1.3. Seasonings and Dressings
- 7.1.4. Other Applications
- 7.1. Market Analysis, Insights and Forecast - by Application
- 8. Asia Pacific MSG Market Analysis, Insights and Forecast, 2019-2031
- 8.1. Market Analysis, Insights and Forecast - by Application
- 8.1.1. Noodles, Soups and Broth
- 8.1.2. Meat Products
- 8.1.3. Seasonings and Dressings
- 8.1.4. Other Applications
- 8.1. Market Analysis, Insights and Forecast - by Application
- 9. South America MSG Market Analysis, Insights and Forecast, 2019-2031
- 9.1. Market Analysis, Insights and Forecast - by Application
- 9.1.1. Noodles, Soups and Broth
- 9.1.2. Meat Products
- 9.1.3. Seasonings and Dressings
- 9.1.4. Other Applications
- 9.1. Market Analysis, Insights and Forecast - by Application
- 10. Middle East and Africa MSG Market Analysis, Insights and Forecast, 2019-2031
- 10.1. Market Analysis, Insights and Forecast - by Application
- 10.1.1. Noodles, Soups and Broth
- 10.1.2. Meat Products
- 10.1.3. Seasonings and Dressings
- 10.1.4. Other Applications
- 10.1. Market Analysis, Insights and Forecast - by Application
- 11. North America MSG Market Analysis, Insights and Forecast, 2019-2031
- 11.1. Market Analysis, Insights and Forecast - By Country/Sub-region
- 11.1.1. undefined
- 12. Europe MSG Market Analysis, Insights and Forecast, 2019-2031
- 12.1. Market Analysis, Insights and Forecast - By Country/Sub-region
- 12.1.1. undefined
- 13. Asia Pacific MSG Market Analysis, Insights and Forecast, 2019-2031
- 13.1. Market Analysis, Insights and Forecast - By Country/Sub-region
- 13.1.1. undefined
- 14. South America MSG Market Analysis, Insights and Forecast, 2019-2031
- 14.1. Market Analysis, Insights and Forecast - By Country/Sub-region
- 14.1.1. undefined
- 15. Middle East and Africa MSG Market Analysis, Insights and Forecast, 2019-2031
- 15.1. Market Analysis, Insights and Forecast - By Country/Sub-region
- 15.1.1. undefined
- 16. Competitive Analysis
- 16.1. Global Market Share Analysis 2024
- 16.2. Company Profiles
- 16.2.1 Gremount International Company Limited
- 16.2.1.1. Overview
- 16.2.1.2. Products
- 16.2.1.3. SWOT Analysis
- 16.2.1.4. Recent Developments
- 16.2.1.5. Financials (Based on Availability)
- 16.2.2 Cargill Incorporated
- 16.2.2.1. Overview
- 16.2.2.2. Products
- 16.2.2.3. SWOT Analysis
- 16.2.2.4. Recent Developments
- 16.2.2.5. Financials (Based on Availability)
- 16.2.3 Ningxia Eppen Biotech Co Ltd
- 16.2.3.1. Overview
- 16.2.3.2. Products
- 16.2.3.3. SWOT Analysis
- 16.2.3.4. Recent Developments
- 16.2.3.5. Financials (Based on Availability)
- 16.2.4 Ajinomoto Co Inc
- 16.2.4.1. Overview
- 16.2.4.2. Products
- 16.2.4.3. SWOT Analysis
- 16.2.4.4. Recent Developments
- 16.2.4.5. Financials (Based on Availability)
- 16.2.5 Meihua Holdings Group Co Ltd
- 16.2.5.1. Overview
- 16.2.5.2. Products
- 16.2.5.3. SWOT Analysis
- 16.2.5.4. Recent Developments
- 16.2.5.5. Financials (Based on Availability)
- 16.2.6 Shandong Xinle Monosodium Glutamate Limited Company*List Not Exhaustive
- 16.2.6.1. Overview
- 16.2.6.2. Products
- 16.2.6.3. SWOT Analysis
- 16.2.6.4. Recent Developments
- 16.2.6.5. Financials (Based on Availability)
- 16.2.7 COFCO
- 16.2.7.1. Overview
- 16.2.7.2. Products
- 16.2.7.3. SWOT Analysis
- 16.2.7.4. Recent Developments
- 16.2.7.5. Financials (Based on Availability)
- 16.2.8 Fufeng Group
- 16.2.8.1. Overview
- 16.2.8.2. Products
- 16.2.8.3. SWOT Analysis
- 16.2.8.4. Recent Developments
- 16.2.8.5. Financials (Based on Availability)
- 16.2.9 Shandong Qilu Biotechnology Group Co
- 16.2.9.1. Overview
- 16.2.9.2. Products
- 16.2.9.3. SWOT Analysis
- 16.2.9.4. Recent Developments
- 16.2.9.5. Financials (Based on Availability)
- 16.2.10 Henan Lotus Flower Gourmet Powder Co
- 16.2.10.1. Overview
- 16.2.10.2. Products
- 16.2.10.3. SWOT Analysis
- 16.2.10.4. Recent Developments
- 16.2.10.5. Financials (Based on Availability)
- 16.2.1 Gremount International Company Limited
List of Figures
- Figure 1: Global MSG Market Revenue Breakdown (Million, %) by Region 2024 & 2032
- Figure 2: Global MSG Market Volume Breakdown (K Tons, %) by Region 2024 & 2032
- Figure 3: North America MSG Market Revenue (Million), by Country 2024 & 2032
- Figure 4: North America MSG Market Volume (K Tons), by Country 2024 & 2032
- Figure 5: North America MSG Market Revenue Share (%), by Country 2024 & 2032
- Figure 6: North America MSG Market Volume Share (%), by Country 2024 & 2032
- Figure 7: Europe MSG Market Revenue (Million), by Country 2024 & 2032
- Figure 8: Europe MSG Market Volume (K Tons), by Country 2024 & 2032
- Figure 9: Europe MSG Market Revenue Share (%), by Country 2024 & 2032
- Figure 10: Europe MSG Market Volume Share (%), by Country 2024 & 2032
- Figure 11: Asia Pacific MSG Market Revenue (Million), by Country 2024 & 2032
- Figure 12: Asia Pacific MSG Market Volume (K Tons), by Country 2024 & 2032
- Figure 13: Asia Pacific MSG Market Revenue Share (%), by Country 2024 & 2032
- Figure 14: Asia Pacific MSG Market Volume Share (%), by Country 2024 & 2032
- Figure 15: South America MSG Market Revenue (Million), by Country 2024 & 2032
- Figure 16: South America MSG Market Volume (K Tons), by Country 2024 & 2032
- Figure 17: South America MSG Market Revenue Share (%), by Country 2024 & 2032
- Figure 18: South America MSG Market Volume Share (%), by Country 2024 & 2032
- Figure 19: Middle East and Africa MSG Market Revenue (Million), by Country 2024 & 2032
- Figure 20: Middle East and Africa MSG Market Volume (K Tons), by Country 2024 & 2032
- Figure 21: Middle East and Africa MSG Market Revenue Share (%), by Country 2024 & 2032
- Figure 22: Middle East and Africa MSG Market Volume Share (%), by Country 2024 & 2032
- Figure 23: North America MSG Market Revenue (Million), by Application 2024 & 2032
- Figure 24: North America MSG Market Volume (K Tons), by Application 2024 & 2032
- Figure 25: North America MSG Market Revenue Share (%), by Application 2024 & 2032
- Figure 26: North America MSG Market Volume Share (%), by Application 2024 & 2032
- Figure 27: North America MSG Market Revenue (Million), by Country 2024 & 2032
- Figure 28: North America MSG Market Volume (K Tons), by Country 2024 & 2032
- Figure 29: North America MSG Market Revenue Share (%), by Country 2024 & 2032
- Figure 30: North America MSG Market Volume Share (%), by Country 2024 & 2032
- Figure 31: Europe MSG Market Revenue (Million), by Application 2024 & 2032
- Figure 32: Europe MSG Market Volume (K Tons), by Application 2024 & 2032
- Figure 33: Europe MSG Market Revenue Share (%), by Application 2024 & 2032
- Figure 34: Europe MSG Market Volume Share (%), by Application 2024 & 2032
- Figure 35: Europe MSG Market Revenue (Million), by Country 2024 & 2032
- Figure 36: Europe MSG Market Volume (K Tons), by Country 2024 & 2032
- Figure 37: Europe MSG Market Revenue Share (%), by Country 2024 & 2032
- Figure 38: Europe MSG Market Volume Share (%), by Country 2024 & 2032
- Figure 39: Asia Pacific MSG Market Revenue (Million), by Application 2024 & 2032
- Figure 40: Asia Pacific MSG Market Volume (K Tons), by Application 2024 & 2032
- Figure 41: Asia Pacific MSG Market Revenue Share (%), by Application 2024 & 2032
- Figure 42: Asia Pacific MSG Market Volume Share (%), by Application 2024 & 2032
- Figure 43: Asia Pacific MSG Market Revenue (Million), by Country 2024 & 2032
- Figure 44: Asia Pacific MSG Market Volume (K Tons), by Country 2024 & 2032
- Figure 45: Asia Pacific MSG Market Revenue Share (%), by Country 2024 & 2032
- Figure 46: Asia Pacific MSG Market Volume Share (%), by Country 2024 & 2032
- Figure 47: South America MSG Market Revenue (Million), by Application 2024 & 2032
- Figure 48: South America MSG Market Volume (K Tons), by Application 2024 & 2032
- Figure 49: South America MSG Market Revenue Share (%), by Application 2024 & 2032
- Figure 50: South America MSG Market Volume Share (%), by Application 2024 & 2032
- Figure 51: South America MSG Market Revenue (Million), by Country 2024 & 2032
- Figure 52: South America MSG Market Volume (K Tons), by Country 2024 & 2032
- Figure 53: South America MSG Market Revenue Share (%), by Country 2024 & 2032
- Figure 54: South America MSG Market Volume Share (%), by Country 2024 & 2032
- Figure 55: Middle East and Africa MSG Market Revenue (Million), by Application 2024 & 2032
- Figure 56: Middle East and Africa MSG Market Volume (K Tons), by Application 2024 & 2032
- Figure 57: Middle East and Africa MSG Market Revenue Share (%), by Application 2024 & 2032
- Figure 58: Middle East and Africa MSG Market Volume Share (%), by Application 2024 & 2032
- Figure 59: Middle East and Africa MSG Market Revenue (Million), by Country 2024 & 2032
- Figure 60: Middle East and Africa MSG Market Volume (K Tons), by Country 2024 & 2032
- Figure 61: Middle East and Africa MSG Market Revenue Share (%), by Country 2024 & 2032
- Figure 62: Middle East and Africa MSG Market Volume Share (%), by Country 2024 & 2032
List of Tables
- Table 1: Global MSG Market Revenue Million Forecast, by Region 2019 & 2032
- Table 2: Global MSG Market Volume K Tons Forecast, by Region 2019 & 2032
- Table 3: Global MSG Market Revenue Million Forecast, by Application 2019 & 2032
- Table 4: Global MSG Market Volume K Tons Forecast, by Application 2019 & 2032
- Table 5: Global MSG Market Revenue Million Forecast, by Region 2019 & 2032
- Table 6: Global MSG Market Volume K Tons Forecast, by Region 2019 & 2032
- Table 7: Global MSG Market Revenue Million Forecast, by Country 2019 & 2032
- Table 8: Global MSG Market Volume K Tons Forecast, by Country 2019 & 2032
- Table 9: Global MSG Market Revenue Million Forecast, by Country 2019 & 2032
- Table 10: Global MSG Market Volume K Tons Forecast, by Country 2019 & 2032
- Table 11: Global MSG Market Revenue Million Forecast, by Country 2019 & 2032
- Table 12: Global MSG Market Volume K Tons Forecast, by Country 2019 & 2032
- Table 13: Global MSG Market Revenue Million Forecast, by Country 2019 & 2032
- Table 14: Global MSG Market Volume K Tons Forecast, by Country 2019 & 2032
- Table 15: Global MSG Market Revenue Million Forecast, by Country 2019 & 2032
- Table 16: Global MSG Market Volume K Tons Forecast, by Country 2019 & 2032
- Table 17: Global MSG Market Revenue Million Forecast, by Application 2019 & 2032
- Table 18: Global MSG Market Volume K Tons Forecast, by Application 2019 & 2032
- Table 19: Global MSG Market Revenue Million Forecast, by Country 2019 & 2032
- Table 20: Global MSG Market Volume K Tons Forecast, by Country 2019 & 2032
- Table 21: United States MSG Market Revenue (Million) Forecast, by Application 2019 & 2032
- Table 22: United States MSG Market Volume (K Tons) Forecast, by Application 2019 & 2032
- Table 23: Canada MSG Market Revenue (Million) Forecast, by Application 2019 & 2032
- Table 24: Canada MSG Market Volume (K Tons) Forecast, by Application 2019 & 2032
- Table 25: Mexico MSG Market Revenue (Million) Forecast, by Application 2019 & 2032
- Table 26: Mexico MSG Market Volume (K Tons) Forecast, by Application 2019 & 2032
- Table 27: Rest of North America MSG Market Revenue (Million) Forecast, by Application 2019 & 2032
- Table 28: Rest of North America MSG Market Volume (K Tons) Forecast, by Application 2019 & 2032
- Table 29: Global MSG Market Revenue Million Forecast, by Application 2019 & 2032
- Table 30: Global MSG Market Volume K Tons Forecast, by Application 2019 & 2032
- Table 31: Global MSG Market Revenue Million Forecast, by Country 2019 & 2032
- Table 32: Global MSG Market Volume K Tons Forecast, by Country 2019 & 2032
- Table 33: Germany MSG Market Revenue (Million) Forecast, by Application 2019 & 2032
- Table 34: Germany MSG Market Volume (K Tons) Forecast, by Application 2019 & 2032
- Table 35: United Kingdom MSG Market Revenue (Million) Forecast, by Application 2019 & 2032
- Table 36: United Kingdom MSG Market Volume (K Tons) Forecast, by Application 2019 & 2032
- Table 37: France MSG Market Revenue (Million) Forecast, by Application 2019 & 2032
- Table 38: France MSG Market Volume (K Tons) Forecast, by Application 2019 & 2032
- Table 39: Russia MSG Market Revenue (Million) Forecast, by Application 2019 & 2032
- Table 40: Russia MSG Market Volume (K Tons) Forecast, by Application 2019 & 2032
- Table 41: Rest of Europe MSG Market Revenue (Million) Forecast, by Application 2019 & 2032
- Table 42: Rest of Europe MSG Market Volume (K Tons) Forecast, by Application 2019 & 2032
- Table 43: Global MSG Market Revenue Million Forecast, by Application 2019 & 2032
- Table 44: Global MSG Market Volume K Tons Forecast, by Application 2019 & 2032
- Table 45: Global MSG Market Revenue Million Forecast, by Country 2019 & 2032
- Table 46: Global MSG Market Volume K Tons Forecast, by Country 2019 & 2032
- Table 47: China MSG Market Revenue (Million) Forecast, by Application 2019 & 2032
- Table 48: China MSG Market Volume (K Tons) Forecast, by Application 2019 & 2032
- Table 49: Japan MSG Market Revenue (Million) Forecast, by Application 2019 & 2032
- Table 50: Japan MSG Market Volume (K Tons) Forecast, by Application 2019 & 2032
- Table 51: India MSG Market Revenue (Million) Forecast, by Application 2019 & 2032
- Table 52: India MSG Market Volume (K Tons) Forecast, by Application 2019 & 2032
- Table 53: Australia MSG Market Revenue (Million) Forecast, by Application 2019 & 2032
- Table 54: Australia MSG Market Volume (K Tons) Forecast, by Application 2019 & 2032
- Table 55: Rest of Asia Pacific MSG Market Revenue (Million) Forecast, by Application 2019 & 2032
- Table 56: Rest of Asia Pacific MSG Market Volume (K Tons) Forecast, by Application 2019 & 2032
- Table 57: Global MSG Market Revenue Million Forecast, by Application 2019 & 2032
- Table 58: Global MSG Market Volume K Tons Forecast, by Application 2019 & 2032
- Table 59: Global MSG Market Revenue Million Forecast, by Country 2019 & 2032
- Table 60: Global MSG Market Volume K Tons Forecast, by Country 2019 & 2032
- Table 61: Brazil MSG Market Revenue (Million) Forecast, by Application 2019 & 2032
- Table 62: Brazil MSG Market Volume (K Tons) Forecast, by Application 2019 & 2032
- Table 63: Argentina MSG Market Revenue (Million) Forecast, by Application 2019 & 2032
- Table 64: Argentina MSG Market Volume (K Tons) Forecast, by Application 2019 & 2032
- Table 65: Rest of South America MSG Market Revenue (Million) Forecast, by Application 2019 & 2032
- Table 66: Rest of South America MSG Market Volume (K Tons) Forecast, by Application 2019 & 2032
- Table 67: Global MSG Market Revenue Million Forecast, by Application 2019 & 2032
- Table 68: Global MSG Market Volume K Tons Forecast, by Application 2019 & 2032
- Table 69: Global MSG Market Revenue Million Forecast, by Country 2019 & 2032
- Table 70: Global MSG Market Volume K Tons Forecast, by Country 2019 & 2032
- Table 71: South Africa MSG Market Revenue (Million) Forecast, by Application 2019 & 2032
- Table 72: South Africa MSG Market Volume (K Tons) Forecast, by Application 2019 & 2032
- Table 73: United Arab Emirates MSG Market Revenue (Million) Forecast, by Application 2019 & 2032
- Table 74: United Arab Emirates MSG Market Volume (K Tons) Forecast, by Application 2019 & 2032
- Table 75: Rest of Middle East and Africa MSG Market Revenue (Million) Forecast, by Application 2019 & 2032
- Table 76: Rest of Middle East and Africa MSG Market Volume (K Tons) Forecast, by Application 2019 & 2032
Frequently Asked Questions
1. What is the projected Compound Annual Growth Rate (CAGR) of the MSG Market?
The projected CAGR is approximately 4.01%.
2. Which companies are prominent players in the MSG Market?
Key companies in the market include Gremount International Company Limited, Cargill Incorporated, Ningxia Eppen Biotech Co Ltd, Ajinomoto Co Inc, Meihua Holdings Group Co Ltd, Shandong Xinle Monosodium Glutamate Limited Company*List Not Exhaustive, COFCO, Fufeng Group, Shandong Qilu Biotechnology Group Co, Henan Lotus Flower Gourmet Powder Co.
3. What are the main segments of the MSG Market?
The market segments include Application.
4. Can you provide details about the market size?
The market size is estimated to be USD 6.15 Million as of 2022.
5. What are some drivers contributing to market growth?
Consumer inclination toward functional food and beverages; Increasing Number of Applications and Growing Industrial Use.
6. What are the notable trends driving market growth?
Rising Demand for Ready -To-Eat and Processed Food.
7. Are there any restraints impacting market growth?
Increasing Shift Toward Plant-Based Protein.
8. Can you provide examples of recent developments in the market?
N/A
9. What pricing options are available for accessing the report?
Pricing options include single-user, multi-user, and enterprise licenses priced at USD 4750, USD 5250, and USD 8750 respectively.
10. Is the market size provided in terms of value or volume?
The market size is provided in terms of value, measured in Million and volume, measured in K Tons.
11. Are there any specific market keywords associated with the report?
Yes, the market keyword associated with the report is "MSG Market," which aids in identifying and referencing the specific market segment covered.
12. How do I determine which pricing option suits my needs best?
The pricing options vary based on user requirements and access needs. Individual users may opt for single-user licenses, while businesses requiring broader access may choose multi-user or enterprise licenses for cost-effective access to the report.
13. Are there any additional resources or data provided in the MSG Market report?
While the report offers comprehensive insights, it's advisable to review the specific contents or supplementary materials provided to ascertain if additional resources or data are available.
14. How can I stay updated on further developments or reports in the MSG Market?
To stay informed about further developments, trends, and reports in the MSG Market, consider subscribing to industry newsletters, following relevant companies and organizations, or regularly checking reputable industry news sources and publications.
Methodology
Step 1 - Identification of Relevant Samples Size from Population Database


Step 2 - Approaches for Defining Global Market Size (Value, Volume* & Price*)

Note*: In applicable scenarios
Step 3 - Data Sources
Primary Research
- Web Analytics
- Survey Reports
- Research Institute
- Latest Research Reports
- Opinion Leaders
Secondary Research
- Annual Reports
- White Paper
- Latest Press Release
- Industry Association
- Paid Database
- Investor Presentations

Step 4 - Data Triangulation
Involves using different sources of information in order to increase the validity of a study
These sources are likely to be stakeholders in a program - participants, other researchers, program staff, other community members, and so on.
Then we put all data in single framework & apply various statistical tools to find out the dynamic on the market.
During the analysis stage, feedback from the stakeholder groups would be compared to determine areas of agreement as well as areas of divergence


