
Key Insights
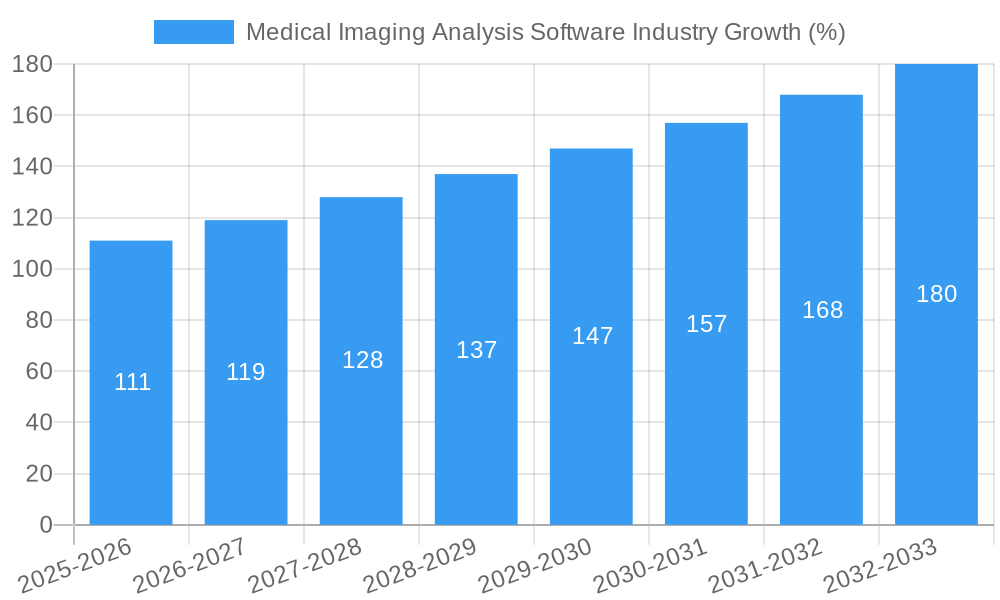
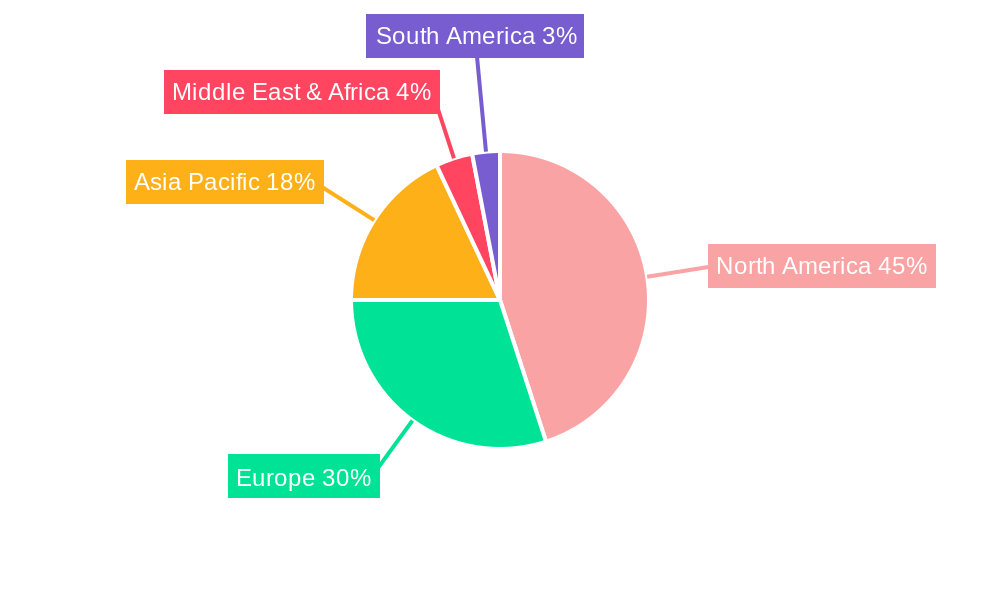
The medical imaging analysis software market is experiencing robust growth, driven by the increasing prevalence of chronic diseases, technological advancements in imaging modalities (such as AI-powered image analysis), and a rising demand for efficient and accurate diagnostic tools. The market's Compound Annual Growth Rate (CAGR) of 7.60% from 2019 to 2024 indicates significant expansion, projecting a substantial market size by 2033. Key market segments include 2D, 3D, and 4D image analysis software across modalities like tomography, ultrasound, radiography, X-ray, and MRI. Integrated and standalone software cater to various end-users, primarily hospitals, diagnostic centers, and research institutions. Geographic expansion is also a key driver, with North America and Europe currently dominating the market due to advanced healthcare infrastructure and high adoption rates of advanced technologies. However, the Asia-Pacific region is poised for significant growth, fueled by increasing healthcare spending and a rising number of diagnostic centers. While the market faces certain restraints, such as high initial investment costs and the need for skilled professionals to operate the software, the overall trend points toward continued expansion driven by technological innovation and the imperative for improved patient care.
The competitive landscape is characterized by a mix of established players like Siemens Healthcare, GE Healthcare, and Philips, alongside emerging technology companies focusing on AI-driven solutions. These companies are strategically investing in research and development to enhance software capabilities, integrate advanced analytics, and expand their product portfolios to cater to diverse imaging needs. The market's future trajectory will be shaped by the continued integration of artificial intelligence and machine learning into image analysis, enabling faster and more accurate diagnoses. Furthermore, the increasing adoption of cloud-based solutions and the focus on interoperability between different imaging systems will further drive market growth. The market's continued expansion hinges on the successful integration of these advanced technologies with robust data security and privacy measures to ensure patient confidentiality.
Medical Imaging Analysis Software Industry: A Comprehensive Market Report (2019-2033)
This in-depth report provides a comprehensive analysis of the Medical Imaging Analysis Software market, offering valuable insights for stakeholders across the value chain. The report covers the period from 2019 to 2033, with a focus on the forecast period (2025-2033), a base year of 2025, and an estimated year of 2025. The market is segmented by image type (2D, 3D, 4D), modality (Tomography, Ultrasound Imaging, Radiographic Imaging, X-ray Imaging, MRI, Other), software type (Integrated, Standalone), and end-user (Hospital, Diagnostic Center, Research Center). The report analyzes market size (in Millions), growth drivers, challenges, competitive landscape, and key industry developments, projecting a robust market expansion throughout the forecast period.
Medical Imaging Analysis Software Industry Market Structure & Competitive Dynamics
The global Medical Imaging Analysis Software market exhibits a moderately consolidated structure, with a handful of major players holding significant market share. Competition is fierce, driven by technological innovation, strategic partnerships, and mergers & acquisitions (M&A) activity. The industry is characterized by a complex innovation ecosystem involving software developers, medical device manufacturers, and research institutions. Regulatory frameworks, particularly those concerning data privacy and medical device approvals, significantly influence market dynamics. Product substitutes, such as traditional manual image analysis techniques, are increasingly challenged by the efficiency and accuracy of software solutions. End-user trends favor the adoption of advanced analytics capabilities for improved diagnostic accuracy and workflow optimization.
- Market Concentration: The top 5 players account for approximately xx% of the global market share in 2025.
- M&A Activity: The industry witnessed significant M&A activity in recent years, with deal values exceeding xx Million in 2022 alone. Strategic acquisitions focus on expanding product portfolios and enhancing technological capabilities. For example, Canon Medical Systems’ acquisition of Nordisk Rontgen Teknik in March 2022 strengthened its X-ray imaging segment.
- Regulatory Landscape: Stringent regulatory requirements for software validation and data security pose both challenges and opportunities, incentivizing investment in compliance and driving adoption of robust security protocols.
Medical Imaging Analysis Software Industry Industry Trends & Insights
The Medical Imaging Analysis Software market is experiencing robust growth, driven by several key factors. The increasing prevalence of chronic diseases, the rising demand for improved diagnostic accuracy, technological advancements (like AI and deep learning integration), and the growing adoption of advanced imaging modalities are major contributors to market expansion. The market is witnessing a shift towards cloud-based solutions and the increasing use of Artificial Intelligence (AI) for automated image analysis. Consumer preferences prioritize user-friendly interfaces, seamless integration with existing hospital information systems, and comprehensive reporting capabilities. The competitive landscape is highly dynamic, with companies investing heavily in R&D and strategic collaborations to maintain market leadership.
The Compound Annual Growth Rate (CAGR) for the global Medical Imaging Analysis Software market is projected to be xx% during the forecast period (2025-2033). Market penetration is expected to increase significantly in developing economies due to rising healthcare expenditure and technological advancements. The market penetration rate for AI-powered medical imaging analysis software is expected to reach approximately xx% by 2033.
Dominant Markets & Segments in Medical Imaging Analysis Software Industry
The North American region currently dominates the Medical Imaging Analysis Software market, followed by Europe and Asia Pacific. This dominance is attributed to factors such as:
- North America: High healthcare expenditure, early adoption of advanced technologies, strong regulatory frameworks (though stringent), and a well-established healthcare infrastructure.
- Europe: Growing demand for advanced diagnostic tools, presence of major players, and increasing investment in R&D activities.
- Asia Pacific: Rapidly expanding healthcare sector, rising disposable incomes, and a growing preference for technologically advanced medical solutions.
Leading Segments:
- Image Type: 2D image analysis software currently holds the largest market share, followed by 3D and 4D imaging solutions, with the latter experiencing faster growth due to their enhanced capabilities.
- Modality: MRI and CT scan analysis software segments exhibit high growth potential due to rising demand for detailed diagnostic information.
- Software Type: Integrated software solutions are preferred due to their ability to streamline workflows and integrate with other healthcare systems.
- End-User: Hospitals remain the largest consumer of Medical Imaging Analysis Software, followed by diagnostic centers and research institutions.
Key Drivers:
- Technological Advancements: Integration of AI and deep learning for improved diagnostic accuracy and automation.
- Economic Factors: Rising healthcare expenditure and government initiatives supporting digital health transformation.
- Infrastructure Development: Expansion of healthcare infrastructure, particularly in developing countries.
Medical Imaging Analysis Software Industry Product Innovations
Recent product innovations focus on enhanced image processing algorithms, seamless integration with existing medical imaging workflows, cloud-based accessibility, and incorporation of AI/ML for automated analysis and improved diagnostic accuracy. These innovations target faster analysis times, improved diagnostic accuracy, enhanced ease of use, and reduction in diagnostic errors, aligning perfectly with market needs.
Report Segmentation & Scope
This report segments the Medical Imaging Analysis Software market based on image type (2D, 3D, 4D), modality (Tomography, Ultrasound, Radiographic, X-ray, MRI, Other), software type (Integrated, Standalone), and end-user (Hospital, Diagnostic Center, Research Center). Each segment's growth projection, market size (in Millions), and competitive dynamics are analyzed in detail. The forecast period extends to 2033, allowing stakeholders to anticipate future trends and make strategic decisions.
Image Type: The market is split into 2D, 3D, and 4D image analysis software, with significant growth anticipated in 3D and 4D segments.
Modality: Detailed analysis of each modality including projections for MRI, CT, Ultrasound, and others.
Software Type: The report explores the market size and growth potential for both integrated and standalone software solutions.
End-User: A breakdown of the market across hospitals, diagnostic centers, and research institutions, along with regional market analysis.
Key Drivers of Medical Imaging Analysis Software Growth
The Medical Imaging Analysis Software market is driven by several key factors: the growing prevalence of chronic diseases necessitating improved diagnostic accuracy, advancements in AI and machine learning enhancing image analysis capabilities, rising healthcare expenditure fueling technological adoption, and government initiatives supporting digital health transformation. The increasing demand for efficient and accurate diagnostic tools, particularly in resource-constrained settings, further contributes to market expansion.
Challenges in the Medical Imaging Analysis Software Industry Sector
Significant challenges include stringent regulatory compliance requirements for software validation and data security, the need for continuous investment in R&D to maintain competitiveness, potential supply chain disruptions impacting hardware and software components, and the risk of data breaches and cybersecurity threats. These challenges impact market growth, but innovative solutions and strategic partnerships can mitigate these risks.
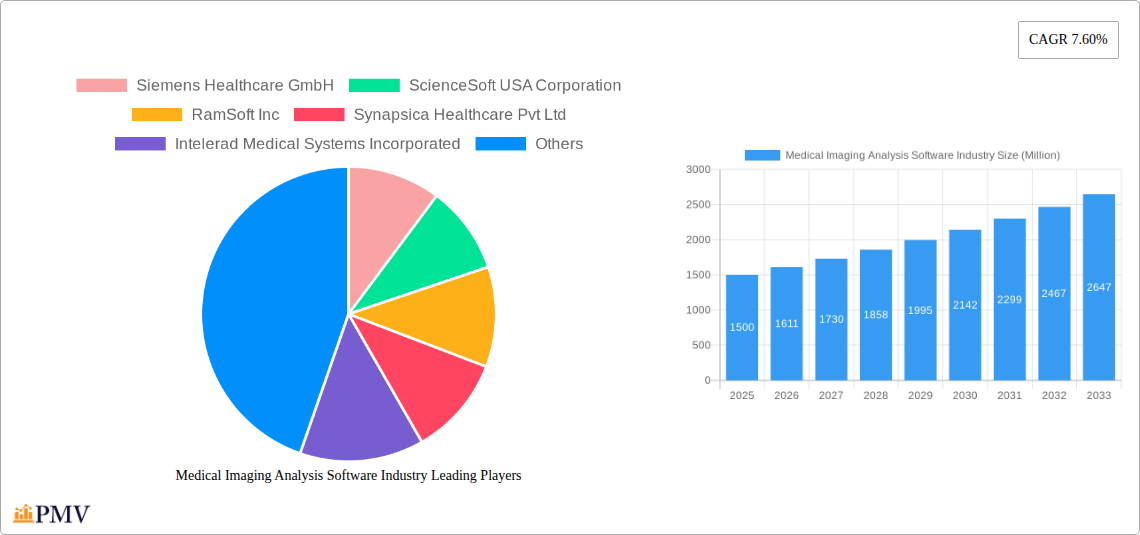
Leading Players in the Medical Imaging Analysis Software Industry Market
- Siemens Healthcare GmbH
- ScienceSoft USA Corporation
- RamSoft Inc
- Synapsica Healthcare Pvt Ltd
- Intelerad Medical Systems Incorporated
- Carestream Health
- Xinapse Systems Ltd
- General Electric Company (GE Healthcare)
- Canon Inc (Canon Medical Systems USA)
- Koninklijke Philips NV
- International Business Machines Corporation (IBM)
- AQUILAB SAS
- Agfa-Gevaert Group
Key Developments in Medical Imaging Analysis Software Industry Sector
- July 2022: Siemens Healthineers integrated Subtle Medical's SubtleMR software into its Open Recon pipeline, enhancing MRI image quality.
- March 2022: Canon Medical Systems acquired Nordisk Rontgen Teknik to strengthen its X-ray business.
Strategic Medical Imaging Analysis Software Industry Market Outlook
The Medical Imaging Analysis Software market exhibits strong growth potential, driven by continuous technological advancements, rising healthcare spending, and the increasing demand for improved diagnostic accuracy. Strategic partnerships, collaborations, and investments in R&D are crucial for maintaining a competitive edge. The integration of AI and big data analytics will play a significant role in shaping the future of the industry. Expansion into emerging markets presents substantial opportunities for growth.
Medical Imaging Analysis Software Industry Segmentation
-
1. Image Type
- 1.1. 2D Image
- 1.2. 3D Image
- 1.3. 4D Image
-
2. Modality
- 2.1. Tomography
- 2.2. Ultrasound Imaging
- 2.3. Radiographic Imaging
- 2.4. X-ray Imaging
- 2.5. Magnetic Resonance Imaging (MRI)
- 2.6. Other Modalities
-
3. Software Type
- 3.1. Integrated Software
- 3.2. Standalone Software
-
4. End User
- 4.1. Hospital
- 4.2. Diagnostic Center
- 4.3. Research Center
Medical Imaging Analysis Software Industry Segmentation By Geography
-
1. North America
- 1.1. United States
- 1.2. Canada
- 1.3. Mexico
-
2. Europe
- 2.1. Germany
- 2.2. United Kingdom
- 2.3. France
- 2.4. Italy
- 2.5. Spain
- 2.6. Rest of Europe
-
3. Asia Pacific
- 3.1. China
- 3.2. Japan
- 3.3. India
- 3.4. Australia
- 3.5. South Korea
- 3.6. Rest of Asia Pacific
-
4. Middle East and Africa
- 4.1. GCC
- 4.2. South Africa
- 4.3. Rest of Middle East and Africa
-
5. South America
- 5.1. Brazil
- 5.2. Argentina
- 5.3. Rest of South America
Medical Imaging Analysis Software Industry REPORT HIGHLIGHTS
| Aspects | Details |
|---|---|
| Study Period | 2019-2033 |
| Base Year | 2024 |
| Estimated Year | 2025 |
| Forecast Period | 2025-2033 |
| Historical Period | 2019-2024 |
| Growth Rate | CAGR of 7.60% from 2019-2033 |
| Segmentation |
|
Table of Contents
- 1. Introduction
- 1.1. Research Scope
- 1.2. Market Segmentation
- 1.3. Research Methodology
- 1.4. Definitions and Assumptions
- 2. Executive Summary
- 2.1. Introduction
- 3. Market Dynamics
- 3.1. Introduction
- 3.2. Market Drivers
- 3.2.1. Technological Advancements in Medical Imaging Systems and Analysis Software; Increasing Usage of Imaging Equipment Due to Rising Prevalence of Chronic Diseases; Rising Applications of Computer-aided Diagnosis
- 3.3. Market Restrains
- 3.3.1. Budgetary Constraints
- 3.4. Market Trends
- 3.4.1. The X-ray Imaging Segment is Expected to Witness Significant Growth Over the Forecast Period
- 4. Market Factor Analysis
- 4.1. Porters Five Forces
- 4.2. Supply/Value Chain
- 4.3. PESTEL analysis
- 4.4. Market Entropy
- 4.5. Patent/Trademark Analysis
- 5. Global Medical Imaging Analysis Software Industry Analysis, Insights and Forecast, 2019-2031
- 5.1. Market Analysis, Insights and Forecast - by Image Type
- 5.1.1. 2D Image
- 5.1.2. 3D Image
- 5.1.3. 4D Image
- 5.2. Market Analysis, Insights and Forecast - by Modality
- 5.2.1. Tomography
- 5.2.2. Ultrasound Imaging
- 5.2.3. Radiographic Imaging
- 5.2.4. X-ray Imaging
- 5.2.5. Magnetic Resonance Imaging (MRI)
- 5.2.6. Other Modalities
- 5.3. Market Analysis, Insights and Forecast - by Software Type
- 5.3.1. Integrated Software
- 5.3.2. Standalone Software
- 5.4. Market Analysis, Insights and Forecast - by End User
- 5.4.1. Hospital
- 5.4.2. Diagnostic Center
- 5.4.3. Research Center
- 5.5. Market Analysis, Insights and Forecast - by Region
- 5.5.1. North America
- 5.5.2. Europe
- 5.5.3. Asia Pacific
- 5.5.4. Middle East and Africa
- 5.5.5. South America
- 5.1. Market Analysis, Insights and Forecast - by Image Type
- 6. North America Medical Imaging Analysis Software Industry Analysis, Insights and Forecast, 2019-2031
- 6.1. Market Analysis, Insights and Forecast - by Image Type
- 6.1.1. 2D Image
- 6.1.2. 3D Image
- 6.1.3. 4D Image
- 6.2. Market Analysis, Insights and Forecast - by Modality
- 6.2.1. Tomography
- 6.2.2. Ultrasound Imaging
- 6.2.3. Radiographic Imaging
- 6.2.4. X-ray Imaging
- 6.2.5. Magnetic Resonance Imaging (MRI)
- 6.2.6. Other Modalities
- 6.3. Market Analysis, Insights and Forecast - by Software Type
- 6.3.1. Integrated Software
- 6.3.2. Standalone Software
- 6.4. Market Analysis, Insights and Forecast - by End User
- 6.4.1. Hospital
- 6.4.2. Diagnostic Center
- 6.4.3. Research Center
- 6.1. Market Analysis, Insights and Forecast - by Image Type
- 7. Europe Medical Imaging Analysis Software Industry Analysis, Insights and Forecast, 2019-2031
- 7.1. Market Analysis, Insights and Forecast - by Image Type
- 7.1.1. 2D Image
- 7.1.2. 3D Image
- 7.1.3. 4D Image
- 7.2. Market Analysis, Insights and Forecast - by Modality
- 7.2.1. Tomography
- 7.2.2. Ultrasound Imaging
- 7.2.3. Radiographic Imaging
- 7.2.4. X-ray Imaging
- 7.2.5. Magnetic Resonance Imaging (MRI)
- 7.2.6. Other Modalities
- 7.3. Market Analysis, Insights and Forecast - by Software Type
- 7.3.1. Integrated Software
- 7.3.2. Standalone Software
- 7.4. Market Analysis, Insights and Forecast - by End User
- 7.4.1. Hospital
- 7.4.2. Diagnostic Center
- 7.4.3. Research Center
- 7.1. Market Analysis, Insights and Forecast - by Image Type
- 8. Asia Pacific Medical Imaging Analysis Software Industry Analysis, Insights and Forecast, 2019-2031
- 8.1. Market Analysis, Insights and Forecast - by Image Type
- 8.1.1. 2D Image
- 8.1.2. 3D Image
- 8.1.3. 4D Image
- 8.2. Market Analysis, Insights and Forecast - by Modality
- 8.2.1. Tomography
- 8.2.2. Ultrasound Imaging
- 8.2.3. Radiographic Imaging
- 8.2.4. X-ray Imaging
- 8.2.5. Magnetic Resonance Imaging (MRI)
- 8.2.6. Other Modalities
- 8.3. Market Analysis, Insights and Forecast - by Software Type
- 8.3.1. Integrated Software
- 8.3.2. Standalone Software
- 8.4. Market Analysis, Insights and Forecast - by End User
- 8.4.1. Hospital
- 8.4.2. Diagnostic Center
- 8.4.3. Research Center
- 8.1. Market Analysis, Insights and Forecast - by Image Type
- 9. Middle East and Africa Medical Imaging Analysis Software Industry Analysis, Insights and Forecast, 2019-2031
- 9.1. Market Analysis, Insights and Forecast - by Image Type
- 9.1.1. 2D Image
- 9.1.2. 3D Image
- 9.1.3. 4D Image
- 9.2. Market Analysis, Insights and Forecast - by Modality
- 9.2.1. Tomography
- 9.2.2. Ultrasound Imaging
- 9.2.3. Radiographic Imaging
- 9.2.4. X-ray Imaging
- 9.2.5. Magnetic Resonance Imaging (MRI)
- 9.2.6. Other Modalities
- 9.3. Market Analysis, Insights and Forecast - by Software Type
- 9.3.1. Integrated Software
- 9.3.2. Standalone Software
- 9.4. Market Analysis, Insights and Forecast - by End User
- 9.4.1. Hospital
- 9.4.2. Diagnostic Center
- 9.4.3. Research Center
- 9.1. Market Analysis, Insights and Forecast - by Image Type
- 10. South America Medical Imaging Analysis Software Industry Analysis, Insights and Forecast, 2019-2031
- 10.1. Market Analysis, Insights and Forecast - by Image Type
- 10.1.1. 2D Image
- 10.1.2. 3D Image
- 10.1.3. 4D Image
- 10.2. Market Analysis, Insights and Forecast - by Modality
- 10.2.1. Tomography
- 10.2.2. Ultrasound Imaging
- 10.2.3. Radiographic Imaging
- 10.2.4. X-ray Imaging
- 10.2.5. Magnetic Resonance Imaging (MRI)
- 10.2.6. Other Modalities
- 10.3. Market Analysis, Insights and Forecast - by Software Type
- 10.3.1. Integrated Software
- 10.3.2. Standalone Software
- 10.4. Market Analysis, Insights and Forecast - by End User
- 10.4.1. Hospital
- 10.4.2. Diagnostic Center
- 10.4.3. Research Center
- 10.1. Market Analysis, Insights and Forecast - by Image Type
- 11. North America Medical Imaging Analysis Software Industry Analysis, Insights and Forecast, 2019-2031
- 11.1. Market Analysis, Insights and Forecast - By Country/Sub-region
- 11.1.1 United States
- 11.1.2 Canada
- 11.1.3 Mexico
- 12. Europe Medical Imaging Analysis Software Industry Analysis, Insights and Forecast, 2019-2031
- 12.1. Market Analysis, Insights and Forecast - By Country/Sub-region
- 12.1.1 Germany
- 12.1.2 United Kingdom
- 12.1.3 France
- 12.1.4 Italy
- 12.1.5 Spain
- 12.1.6 Rest of Europe
- 13. Asia Pacific Medical Imaging Analysis Software Industry Analysis, Insights and Forecast, 2019-2031
- 13.1. Market Analysis, Insights and Forecast - By Country/Sub-region
- 13.1.1 China
- 13.1.2 Japan
- 13.1.3 India
- 13.1.4 Australia
- 13.1.5 South Korea
- 13.1.6 Rest of Asia Pacific
- 14. Middle East and Africa Medical Imaging Analysis Software Industry Analysis, Insights and Forecast, 2019-2031
- 14.1. Market Analysis, Insights and Forecast - By Country/Sub-region
- 14.1.1 GCC
- 14.1.2 South Africa
- 14.1.3 Rest of Middle East and Africa
- 15. South America Medical Imaging Analysis Software Industry Analysis, Insights and Forecast, 2019-2031
- 15.1. Market Analysis, Insights and Forecast - By Country/Sub-region
- 15.1.1 Brazil
- 15.1.2 Argentina
- 15.1.3 Rest of South America
- 16. Competitive Analysis
- 16.1. Global Market Share Analysis 2024
- 16.2. Company Profiles
- 16.2.1 Siemens Healthcare GmbH
- 16.2.1.1. Overview
- 16.2.1.2. Products
- 16.2.1.3. SWOT Analysis
- 16.2.1.4. Recent Developments
- 16.2.1.5. Financials (Based on Availability)
- 16.2.2 ScienceSoft USA Corporation
- 16.2.2.1. Overview
- 16.2.2.2. Products
- 16.2.2.3. SWOT Analysis
- 16.2.2.4. Recent Developments
- 16.2.2.5. Financials (Based on Availability)
- 16.2.3 RamSoft Inc
- 16.2.3.1. Overview
- 16.2.3.2. Products
- 16.2.3.3. SWOT Analysis
- 16.2.3.4. Recent Developments
- 16.2.3.5. Financials (Based on Availability)
- 16.2.4 Synapsica Healthcare Pvt Ltd
- 16.2.4.1. Overview
- 16.2.4.2. Products
- 16.2.4.3. SWOT Analysis
- 16.2.4.4. Recent Developments
- 16.2.4.5. Financials (Based on Availability)
- 16.2.5 Intelerad Medical Systems Incorporated
- 16.2.5.1. Overview
- 16.2.5.2. Products
- 16.2.5.3. SWOT Analysis
- 16.2.5.4. Recent Developments
- 16.2.5.5. Financials (Based on Availability)
- 16.2.6 Carestream Health
- 16.2.6.1. Overview
- 16.2.6.2. Products
- 16.2.6.3. SWOT Analysis
- 16.2.6.4. Recent Developments
- 16.2.6.5. Financials (Based on Availability)
- 16.2.7 Xinapse Systems Ltd
- 16.2.7.1. Overview
- 16.2.7.2. Products
- 16.2.7.3. SWOT Analysis
- 16.2.7.4. Recent Developments
- 16.2.7.5. Financials (Based on Availability)
- 16.2.8 General Electric Company (GE Healthcare)
- 16.2.8.1. Overview
- 16.2.8.2. Products
- 16.2.8.3. SWOT Analysis
- 16.2.8.4. Recent Developments
- 16.2.8.5. Financials (Based on Availability)
- 16.2.9 Canon Inc (Canon Medical Systems USA)
- 16.2.9.1. Overview
- 16.2.9.2. Products
- 16.2.9.3. SWOT Analysis
- 16.2.9.4. Recent Developments
- 16.2.9.5. Financials (Based on Availability)
- 16.2.10 Koninklijke Philips NV
- 16.2.10.1. Overview
- 16.2.10.2. Products
- 16.2.10.3. SWOT Analysis
- 16.2.10.4. Recent Developments
- 16.2.10.5. Financials (Based on Availability)
- 16.2.11 International Business Machines Corporation (IBM)
- 16.2.11.1. Overview
- 16.2.11.2. Products
- 16.2.11.3. SWOT Analysis
- 16.2.11.4. Recent Developments
- 16.2.11.5. Financials (Based on Availability)
- 16.2.12 AQUILAB SAS
- 16.2.12.1. Overview
- 16.2.12.2. Products
- 16.2.12.3. SWOT Analysis
- 16.2.12.4. Recent Developments
- 16.2.12.5. Financials (Based on Availability)
- 16.2.13 Agfa-Gevaert Group
- 16.2.13.1. Overview
- 16.2.13.2. Products
- 16.2.13.3. SWOT Analysis
- 16.2.13.4. Recent Developments
- 16.2.13.5. Financials (Based on Availability)
- 16.2.1 Siemens Healthcare GmbH
List of Figures
- Figure 1: Global Medical Imaging Analysis Software Industry Revenue Breakdown (Million, %) by Region 2024 & 2032
- Figure 2: Global Medical Imaging Analysis Software Industry Volume Breakdown (K Unit, %) by Region 2024 & 2032
- Figure 3: North America Medical Imaging Analysis Software Industry Revenue (Million), by Country 2024 & 2032
- Figure 4: North America Medical Imaging Analysis Software Industry Volume (K Unit), by Country 2024 & 2032
- Figure 5: North America Medical Imaging Analysis Software Industry Revenue Share (%), by Country 2024 & 2032
- Figure 6: North America Medical Imaging Analysis Software Industry Volume Share (%), by Country 2024 & 2032
- Figure 7: Europe Medical Imaging Analysis Software Industry Revenue (Million), by Country 2024 & 2032
- Figure 8: Europe Medical Imaging Analysis Software Industry Volume (K Unit), by Country 2024 & 2032
- Figure 9: Europe Medical Imaging Analysis Software Industry Revenue Share (%), by Country 2024 & 2032
- Figure 10: Europe Medical Imaging Analysis Software Industry Volume Share (%), by Country 2024 & 2032
- Figure 11: Asia Pacific Medical Imaging Analysis Software Industry Revenue (Million), by Country 2024 & 2032
- Figure 12: Asia Pacific Medical Imaging Analysis Software Industry Volume (K Unit), by Country 2024 & 2032
- Figure 13: Asia Pacific Medical Imaging Analysis Software Industry Revenue Share (%), by Country 2024 & 2032
- Figure 14: Asia Pacific Medical Imaging Analysis Software Industry Volume Share (%), by Country 2024 & 2032
- Figure 15: Middle East and Africa Medical Imaging Analysis Software Industry Revenue (Million), by Country 2024 & 2032
- Figure 16: Middle East and Africa Medical Imaging Analysis Software Industry Volume (K Unit), by Country 2024 & 2032
- Figure 17: Middle East and Africa Medical Imaging Analysis Software Industry Revenue Share (%), by Country 2024 & 2032
- Figure 18: Middle East and Africa Medical Imaging Analysis Software Industry Volume Share (%), by Country 2024 & 2032
- Figure 19: South America Medical Imaging Analysis Software Industry Revenue (Million), by Country 2024 & 2032
- Figure 20: South America Medical Imaging Analysis Software Industry Volume (K Unit), by Country 2024 & 2032
- Figure 21: South America Medical Imaging Analysis Software Industry Revenue Share (%), by Country 2024 & 2032
- Figure 22: South America Medical Imaging Analysis Software Industry Volume Share (%), by Country 2024 & 2032
- Figure 23: North America Medical Imaging Analysis Software Industry Revenue (Million), by Image Type 2024 & 2032
- Figure 24: North America Medical Imaging Analysis Software Industry Volume (K Unit), by Image Type 2024 & 2032
- Figure 25: North America Medical Imaging Analysis Software Industry Revenue Share (%), by Image Type 2024 & 2032
- Figure 26: North America Medical Imaging Analysis Software Industry Volume Share (%), by Image Type 2024 & 2032
- Figure 27: North America Medical Imaging Analysis Software Industry Revenue (Million), by Modality 2024 & 2032
- Figure 28: North America Medical Imaging Analysis Software Industry Volume (K Unit), by Modality 2024 & 2032
- Figure 29: North America Medical Imaging Analysis Software Industry Revenue Share (%), by Modality 2024 & 2032
- Figure 30: North America Medical Imaging Analysis Software Industry Volume Share (%), by Modality 2024 & 2032
- Figure 31: North America Medical Imaging Analysis Software Industry Revenue (Million), by Software Type 2024 & 2032
- Figure 32: North America Medical Imaging Analysis Software Industry Volume (K Unit), by Software Type 2024 & 2032
- Figure 33: North America Medical Imaging Analysis Software Industry Revenue Share (%), by Software Type 2024 & 2032
- Figure 34: North America Medical Imaging Analysis Software Industry Volume Share (%), by Software Type 2024 & 2032
- Figure 35: North America Medical Imaging Analysis Software Industry Revenue (Million), by End User 2024 & 2032
- Figure 36: North America Medical Imaging Analysis Software Industry Volume (K Unit), by End User 2024 & 2032
- Figure 37: North America Medical Imaging Analysis Software Industry Revenue Share (%), by End User 2024 & 2032
- Figure 38: North America Medical Imaging Analysis Software Industry Volume Share (%), by End User 2024 & 2032
- Figure 39: North America Medical Imaging Analysis Software Industry Revenue (Million), by Country 2024 & 2032
- Figure 40: North America Medical Imaging Analysis Software Industry Volume (K Unit), by Country 2024 & 2032
- Figure 41: North America Medical Imaging Analysis Software Industry Revenue Share (%), by Country 2024 & 2032
- Figure 42: North America Medical Imaging Analysis Software Industry Volume Share (%), by Country 2024 & 2032
- Figure 43: Europe Medical Imaging Analysis Software Industry Revenue (Million), by Image Type 2024 & 2032
- Figure 44: Europe Medical Imaging Analysis Software Industry Volume (K Unit), by Image Type 2024 & 2032
- Figure 45: Europe Medical Imaging Analysis Software Industry Revenue Share (%), by Image Type 2024 & 2032
- Figure 46: Europe Medical Imaging Analysis Software Industry Volume Share (%), by Image Type 2024 & 2032
- Figure 47: Europe Medical Imaging Analysis Software Industry Revenue (Million), by Modality 2024 & 2032
- Figure 48: Europe Medical Imaging Analysis Software Industry Volume (K Unit), by Modality 2024 & 2032
- Figure 49: Europe Medical Imaging Analysis Software Industry Revenue Share (%), by Modality 2024 & 2032
- Figure 50: Europe Medical Imaging Analysis Software Industry Volume Share (%), by Modality 2024 & 2032
- Figure 51: Europe Medical Imaging Analysis Software Industry Revenue (Million), by Software Type 2024 & 2032
- Figure 52: Europe Medical Imaging Analysis Software Industry Volume (K Unit), by Software Type 2024 & 2032
- Figure 53: Europe Medical Imaging Analysis Software Industry Revenue Share (%), by Software Type 2024 & 2032
- Figure 54: Europe Medical Imaging Analysis Software Industry Volume Share (%), by Software Type 2024 & 2032
- Figure 55: Europe Medical Imaging Analysis Software Industry Revenue (Million), by End User 2024 & 2032
- Figure 56: Europe Medical Imaging Analysis Software Industry Volume (K Unit), by End User 2024 & 2032
- Figure 57: Europe Medical Imaging Analysis Software Industry Revenue Share (%), by End User 2024 & 2032
- Figure 58: Europe Medical Imaging Analysis Software Industry Volume Share (%), by End User 2024 & 2032
- Figure 59: Europe Medical Imaging Analysis Software Industry Revenue (Million), by Country 2024 & 2032
- Figure 60: Europe Medical Imaging Analysis Software Industry Volume (K Unit), by Country 2024 & 2032
- Figure 61: Europe Medical Imaging Analysis Software Industry Revenue Share (%), by Country 2024 & 2032
- Figure 62: Europe Medical Imaging Analysis Software Industry Volume Share (%), by Country 2024 & 2032
- Figure 63: Asia Pacific Medical Imaging Analysis Software Industry Revenue (Million), by Image Type 2024 & 2032
- Figure 64: Asia Pacific Medical Imaging Analysis Software Industry Volume (K Unit), by Image Type 2024 & 2032
- Figure 65: Asia Pacific Medical Imaging Analysis Software Industry Revenue Share (%), by Image Type 2024 & 2032
- Figure 66: Asia Pacific Medical Imaging Analysis Software Industry Volume Share (%), by Image Type 2024 & 2032
- Figure 67: Asia Pacific Medical Imaging Analysis Software Industry Revenue (Million), by Modality 2024 & 2032
- Figure 68: Asia Pacific Medical Imaging Analysis Software Industry Volume (K Unit), by Modality 2024 & 2032
- Figure 69: Asia Pacific Medical Imaging Analysis Software Industry Revenue Share (%), by Modality 2024 & 2032
- Figure 70: Asia Pacific Medical Imaging Analysis Software Industry Volume Share (%), by Modality 2024 & 2032
- Figure 71: Asia Pacific Medical Imaging Analysis Software Industry Revenue (Million), by Software Type 2024 & 2032
- Figure 72: Asia Pacific Medical Imaging Analysis Software Industry Volume (K Unit), by Software Type 2024 & 2032
- Figure 73: Asia Pacific Medical Imaging Analysis Software Industry Revenue Share (%), by Software Type 2024 & 2032
- Figure 74: Asia Pacific Medical Imaging Analysis Software Industry Volume Share (%), by Software Type 2024 & 2032
- Figure 75: Asia Pacific Medical Imaging Analysis Software Industry Revenue (Million), by End User 2024 & 2032
- Figure 76: Asia Pacific Medical Imaging Analysis Software Industry Volume (K Unit), by End User 2024 & 2032
- Figure 77: Asia Pacific Medical Imaging Analysis Software Industry Revenue Share (%), by End User 2024 & 2032
- Figure 78: Asia Pacific Medical Imaging Analysis Software Industry Volume Share (%), by End User 2024 & 2032
- Figure 79: Asia Pacific Medical Imaging Analysis Software Industry Revenue (Million), by Country 2024 & 2032
- Figure 80: Asia Pacific Medical Imaging Analysis Software Industry Volume (K Unit), by Country 2024 & 2032
- Figure 81: Asia Pacific Medical Imaging Analysis Software Industry Revenue Share (%), by Country 2024 & 2032
- Figure 82: Asia Pacific Medical Imaging Analysis Software Industry Volume Share (%), by Country 2024 & 2032
- Figure 83: Middle East and Africa Medical Imaging Analysis Software Industry Revenue (Million), by Image Type 2024 & 2032
- Figure 84: Middle East and Africa Medical Imaging Analysis Software Industry Volume (K Unit), by Image Type 2024 & 2032
- Figure 85: Middle East and Africa Medical Imaging Analysis Software Industry Revenue Share (%), by Image Type 2024 & 2032
- Figure 86: Middle East and Africa Medical Imaging Analysis Software Industry Volume Share (%), by Image Type 2024 & 2032
- Figure 87: Middle East and Africa Medical Imaging Analysis Software Industry Revenue (Million), by Modality 2024 & 2032
- Figure 88: Middle East and Africa Medical Imaging Analysis Software Industry Volume (K Unit), by Modality 2024 & 2032
- Figure 89: Middle East and Africa Medical Imaging Analysis Software Industry Revenue Share (%), by Modality 2024 & 2032
- Figure 90: Middle East and Africa Medical Imaging Analysis Software Industry Volume Share (%), by Modality 2024 & 2032
- Figure 91: Middle East and Africa Medical Imaging Analysis Software Industry Revenue (Million), by Software Type 2024 & 2032
- Figure 92: Middle East and Africa Medical Imaging Analysis Software Industry Volume (K Unit), by Software Type 2024 & 2032
- Figure 93: Middle East and Africa Medical Imaging Analysis Software Industry Revenue Share (%), by Software Type 2024 & 2032
- Figure 94: Middle East and Africa Medical Imaging Analysis Software Industry Volume Share (%), by Software Type 2024 & 2032
- Figure 95: Middle East and Africa Medical Imaging Analysis Software Industry Revenue (Million), by End User 2024 & 2032
- Figure 96: Middle East and Africa Medical Imaging Analysis Software Industry Volume (K Unit), by End User 2024 & 2032
- Figure 97: Middle East and Africa Medical Imaging Analysis Software Industry Revenue Share (%), by End User 2024 & 2032
- Figure 98: Middle East and Africa Medical Imaging Analysis Software Industry Volume Share (%), by End User 2024 & 2032
- Figure 99: Middle East and Africa Medical Imaging Analysis Software Industry Revenue (Million), by Country 2024 & 2032
- Figure 100: Middle East and Africa Medical Imaging Analysis Software Industry Volume (K Unit), by Country 2024 & 2032
- Figure 101: Middle East and Africa Medical Imaging Analysis Software Industry Revenue Share (%), by Country 2024 & 2032
- Figure 102: Middle East and Africa Medical Imaging Analysis Software Industry Volume Share (%), by Country 2024 & 2032
- Figure 103: South America Medical Imaging Analysis Software Industry Revenue (Million), by Image Type 2024 & 2032
- Figure 104: South America Medical Imaging Analysis Software Industry Volume (K Unit), by Image Type 2024 & 2032
- Figure 105: South America Medical Imaging Analysis Software Industry Revenue Share (%), by Image Type 2024 & 2032
- Figure 106: South America Medical Imaging Analysis Software Industry Volume Share (%), by Image Type 2024 & 2032
- Figure 107: South America Medical Imaging Analysis Software Industry Revenue (Million), by Modality 2024 & 2032
- Figure 108: South America Medical Imaging Analysis Software Industry Volume (K Unit), by Modality 2024 & 2032
- Figure 109: South America Medical Imaging Analysis Software Industry Revenue Share (%), by Modality 2024 & 2032
- Figure 110: South America Medical Imaging Analysis Software Industry Volume Share (%), by Modality 2024 & 2032
- Figure 111: South America Medical Imaging Analysis Software Industry Revenue (Million), by Software Type 2024 & 2032
- Figure 112: South America Medical Imaging Analysis Software Industry Volume (K Unit), by Software Type 2024 & 2032
- Figure 113: South America Medical Imaging Analysis Software Industry Revenue Share (%), by Software Type 2024 & 2032
- Figure 114: South America Medical Imaging Analysis Software Industry Volume Share (%), by Software Type 2024 & 2032
- Figure 115: South America Medical Imaging Analysis Software Industry Revenue (Million), by End User 2024 & 2032
- Figure 116: South America Medical Imaging Analysis Software Industry Volume (K Unit), by End User 2024 & 2032
- Figure 117: South America Medical Imaging Analysis Software Industry Revenue Share (%), by End User 2024 & 2032
- Figure 118: South America Medical Imaging Analysis Software Industry Volume Share (%), by End User 2024 & 2032
- Figure 119: South America Medical Imaging Analysis Software Industry Revenue (Million), by Country 2024 & 2032
- Figure 120: South America Medical Imaging Analysis Software Industry Volume (K Unit), by Country 2024 & 2032
- Figure 121: South America Medical Imaging Analysis Software Industry Revenue Share (%), by Country 2024 & 2032
- Figure 122: South America Medical Imaging Analysis Software Industry Volume Share (%), by Country 2024 & 2032
List of Tables
- Table 1: Global Medical Imaging Analysis Software Industry Revenue Million Forecast, by Region 2019 & 2032
- Table 2: Global Medical Imaging Analysis Software Industry Volume K Unit Forecast, by Region 2019 & 2032
- Table 3: Global Medical Imaging Analysis Software Industry Revenue Million Forecast, by Image Type 2019 & 2032
- Table 4: Global Medical Imaging Analysis Software Industry Volume K Unit Forecast, by Image Type 2019 & 2032
- Table 5: Global Medical Imaging Analysis Software Industry Revenue Million Forecast, by Modality 2019 & 2032
- Table 6: Global Medical Imaging Analysis Software Industry Volume K Unit Forecast, by Modality 2019 & 2032
- Table 7: Global Medical Imaging Analysis Software Industry Revenue Million Forecast, by Software Type 2019 & 2032
- Table 8: Global Medical Imaging Analysis Software Industry Volume K Unit Forecast, by Software Type 2019 & 2032
- Table 9: Global Medical Imaging Analysis Software Industry Revenue Million Forecast, by End User 2019 & 2032
- Table 10: Global Medical Imaging Analysis Software Industry Volume K Unit Forecast, by End User 2019 & 2032
- Table 11: Global Medical Imaging Analysis Software Industry Revenue Million Forecast, by Region 2019 & 2032
- Table 12: Global Medical Imaging Analysis Software Industry Volume K Unit Forecast, by Region 2019 & 2032
- Table 13: Global Medical Imaging Analysis Software Industry Revenue Million Forecast, by Country 2019 & 2032
- Table 14: Global Medical Imaging Analysis Software Industry Volume K Unit Forecast, by Country 2019 & 2032
- Table 15: United States Medical Imaging Analysis Software Industry Revenue (Million) Forecast, by Application 2019 & 2032
- Table 16: United States Medical Imaging Analysis Software Industry Volume (K Unit) Forecast, by Application 2019 & 2032
- Table 17: Canada Medical Imaging Analysis Software Industry Revenue (Million) Forecast, by Application 2019 & 2032
- Table 18: Canada Medical Imaging Analysis Software Industry Volume (K Unit) Forecast, by Application 2019 & 2032
- Table 19: Mexico Medical Imaging Analysis Software Industry Revenue (Million) Forecast, by Application 2019 & 2032
- Table 20: Mexico Medical Imaging Analysis Software Industry Volume (K Unit) Forecast, by Application 2019 & 2032
- Table 21: Global Medical Imaging Analysis Software Industry Revenue Million Forecast, by Country 2019 & 2032
- Table 22: Global Medical Imaging Analysis Software Industry Volume K Unit Forecast, by Country 2019 & 2032
- Table 23: Germany Medical Imaging Analysis Software Industry Revenue (Million) Forecast, by Application 2019 & 2032
- Table 24: Germany Medical Imaging Analysis Software Industry Volume (K Unit) Forecast, by Application 2019 & 2032
- Table 25: United Kingdom Medical Imaging Analysis Software Industry Revenue (Million) Forecast, by Application 2019 & 2032
- Table 26: United Kingdom Medical Imaging Analysis Software Industry Volume (K Unit) Forecast, by Application 2019 & 2032
- Table 27: France Medical Imaging Analysis Software Industry Revenue (Million) Forecast, by Application 2019 & 2032
- Table 28: France Medical Imaging Analysis Software Industry Volume (K Unit) Forecast, by Application 2019 & 2032
- Table 29: Italy Medical Imaging Analysis Software Industry Revenue (Million) Forecast, by Application 2019 & 2032
- Table 30: Italy Medical Imaging Analysis Software Industry Volume (K Unit) Forecast, by Application 2019 & 2032
- Table 31: Spain Medical Imaging Analysis Software Industry Revenue (Million) Forecast, by Application 2019 & 2032
- Table 32: Spain Medical Imaging Analysis Software Industry Volume (K Unit) Forecast, by Application 2019 & 2032
- Table 33: Rest of Europe Medical Imaging Analysis Software Industry Revenue (Million) Forecast, by Application 2019 & 2032
- Table 34: Rest of Europe Medical Imaging Analysis Software Industry Volume (K Unit) Forecast, by Application 2019 & 2032
- Table 35: Global Medical Imaging Analysis Software Industry Revenue Million Forecast, by Country 2019 & 2032
- Table 36: Global Medical Imaging Analysis Software Industry Volume K Unit Forecast, by Country 2019 & 2032
- Table 37: China Medical Imaging Analysis Software Industry Revenue (Million) Forecast, by Application 2019 & 2032
- Table 38: China Medical Imaging Analysis Software Industry Volume (K Unit) Forecast, by Application 2019 & 2032
- Table 39: Japan Medical Imaging Analysis Software Industry Revenue (Million) Forecast, by Application 2019 & 2032
- Table 40: Japan Medical Imaging Analysis Software Industry Volume (K Unit) Forecast, by Application 2019 & 2032
- Table 41: India Medical Imaging Analysis Software Industry Revenue (Million) Forecast, by Application 2019 & 2032
- Table 42: India Medical Imaging Analysis Software Industry Volume (K Unit) Forecast, by Application 2019 & 2032
- Table 43: Australia Medical Imaging Analysis Software Industry Revenue (Million) Forecast, by Application 2019 & 2032
- Table 44: Australia Medical Imaging Analysis Software Industry Volume (K Unit) Forecast, by Application 2019 & 2032
- Table 45: South Korea Medical Imaging Analysis Software Industry Revenue (Million) Forecast, by Application 2019 & 2032
- Table 46: South Korea Medical Imaging Analysis Software Industry Volume (K Unit) Forecast, by Application 2019 & 2032
- Table 47: Rest of Asia Pacific Medical Imaging Analysis Software Industry Revenue (Million) Forecast, by Application 2019 & 2032
- Table 48: Rest of Asia Pacific Medical Imaging Analysis Software Industry Volume (K Unit) Forecast, by Application 2019 & 2032
- Table 49: Global Medical Imaging Analysis Software Industry Revenue Million Forecast, by Country 2019 & 2032
- Table 50: Global Medical Imaging Analysis Software Industry Volume K Unit Forecast, by Country 2019 & 2032
- Table 51: GCC Medical Imaging Analysis Software Industry Revenue (Million) Forecast, by Application 2019 & 2032
- Table 52: GCC Medical Imaging Analysis Software Industry Volume (K Unit) Forecast, by Application 2019 & 2032
- Table 53: South Africa Medical Imaging Analysis Software Industry Revenue (Million) Forecast, by Application 2019 & 2032
- Table 54: South Africa Medical Imaging Analysis Software Industry Volume (K Unit) Forecast, by Application 2019 & 2032
- Table 55: Rest of Middle East and Africa Medical Imaging Analysis Software Industry Revenue (Million) Forecast, by Application 2019 & 2032
- Table 56: Rest of Middle East and Africa Medical Imaging Analysis Software Industry Volume (K Unit) Forecast, by Application 2019 & 2032
- Table 57: Global Medical Imaging Analysis Software Industry Revenue Million Forecast, by Country 2019 & 2032
- Table 58: Global Medical Imaging Analysis Software Industry Volume K Unit Forecast, by Country 2019 & 2032
- Table 59: Brazil Medical Imaging Analysis Software Industry Revenue (Million) Forecast, by Application 2019 & 2032
- Table 60: Brazil Medical Imaging Analysis Software Industry Volume (K Unit) Forecast, by Application 2019 & 2032
- Table 61: Argentina Medical Imaging Analysis Software Industry Revenue (Million) Forecast, by Application 2019 & 2032
- Table 62: Argentina Medical Imaging Analysis Software Industry Volume (K Unit) Forecast, by Application 2019 & 2032
- Table 63: Rest of South America Medical Imaging Analysis Software Industry Revenue (Million) Forecast, by Application 2019 & 2032
- Table 64: Rest of South America Medical Imaging Analysis Software Industry Volume (K Unit) Forecast, by Application 2019 & 2032
- Table 65: Global Medical Imaging Analysis Software Industry Revenue Million Forecast, by Image Type 2019 & 2032
- Table 66: Global Medical Imaging Analysis Software Industry Volume K Unit Forecast, by Image Type 2019 & 2032
- Table 67: Global Medical Imaging Analysis Software Industry Revenue Million Forecast, by Modality 2019 & 2032
- Table 68: Global Medical Imaging Analysis Software Industry Volume K Unit Forecast, by Modality 2019 & 2032
- Table 69: Global Medical Imaging Analysis Software Industry Revenue Million Forecast, by Software Type 2019 & 2032
- Table 70: Global Medical Imaging Analysis Software Industry Volume K Unit Forecast, by Software Type 2019 & 2032
- Table 71: Global Medical Imaging Analysis Software Industry Revenue Million Forecast, by End User 2019 & 2032
- Table 72: Global Medical Imaging Analysis Software Industry Volume K Unit Forecast, by End User 2019 & 2032
- Table 73: Global Medical Imaging Analysis Software Industry Revenue Million Forecast, by Country 2019 & 2032
- Table 74: Global Medical Imaging Analysis Software Industry Volume K Unit Forecast, by Country 2019 & 2032
- Table 75: United States Medical Imaging Analysis Software Industry Revenue (Million) Forecast, by Application 2019 & 2032
- Table 76: United States Medical Imaging Analysis Software Industry Volume (K Unit) Forecast, by Application 2019 & 2032
- Table 77: Canada Medical Imaging Analysis Software Industry Revenue (Million) Forecast, by Application 2019 & 2032
- Table 78: Canada Medical Imaging Analysis Software Industry Volume (K Unit) Forecast, by Application 2019 & 2032
- Table 79: Mexico Medical Imaging Analysis Software Industry Revenue (Million) Forecast, by Application 2019 & 2032
- Table 80: Mexico Medical Imaging Analysis Software Industry Volume (K Unit) Forecast, by Application 2019 & 2032
- Table 81: Global Medical Imaging Analysis Software Industry Revenue Million Forecast, by Image Type 2019 & 2032
- Table 82: Global Medical Imaging Analysis Software Industry Volume K Unit Forecast, by Image Type 2019 & 2032
- Table 83: Global Medical Imaging Analysis Software Industry Revenue Million Forecast, by Modality 2019 & 2032
- Table 84: Global Medical Imaging Analysis Software Industry Volume K Unit Forecast, by Modality 2019 & 2032
- Table 85: Global Medical Imaging Analysis Software Industry Revenue Million Forecast, by Software Type 2019 & 2032
- Table 86: Global Medical Imaging Analysis Software Industry Volume K Unit Forecast, by Software Type 2019 & 2032
- Table 87: Global Medical Imaging Analysis Software Industry Revenue Million Forecast, by End User 2019 & 2032
- Table 88: Global Medical Imaging Analysis Software Industry Volume K Unit Forecast, by End User 2019 & 2032
- Table 89: Global Medical Imaging Analysis Software Industry Revenue Million Forecast, by Country 2019 & 2032
- Table 90: Global Medical Imaging Analysis Software Industry Volume K Unit Forecast, by Country 2019 & 2032
- Table 91: Germany Medical Imaging Analysis Software Industry Revenue (Million) Forecast, by Application 2019 & 2032
- Table 92: Germany Medical Imaging Analysis Software Industry Volume (K Unit) Forecast, by Application 2019 & 2032
- Table 93: United Kingdom Medical Imaging Analysis Software Industry Revenue (Million) Forecast, by Application 2019 & 2032
- Table 94: United Kingdom Medical Imaging Analysis Software Industry Volume (K Unit) Forecast, by Application 2019 & 2032
- Table 95: France Medical Imaging Analysis Software Industry Revenue (Million) Forecast, by Application 2019 & 2032
- Table 96: France Medical Imaging Analysis Software Industry Volume (K Unit) Forecast, by Application 2019 & 2032
- Table 97: Italy Medical Imaging Analysis Software Industry Revenue (Million) Forecast, by Application 2019 & 2032
- Table 98: Italy Medical Imaging Analysis Software Industry Volume (K Unit) Forecast, by Application 2019 & 2032
- Table 99: Spain Medical Imaging Analysis Software Industry Revenue (Million) Forecast, by Application 2019 & 2032
- Table 100: Spain Medical Imaging Analysis Software Industry Volume (K Unit) Forecast, by Application 2019 & 2032
- Table 101: Rest of Europe Medical Imaging Analysis Software Industry Revenue (Million) Forecast, by Application 2019 & 2032
- Table 102: Rest of Europe Medical Imaging Analysis Software Industry Volume (K Unit) Forecast, by Application 2019 & 2032
- Table 103: Global Medical Imaging Analysis Software Industry Revenue Million Forecast, by Image Type 2019 & 2032
- Table 104: Global Medical Imaging Analysis Software Industry Volume K Unit Forecast, by Image Type 2019 & 2032
- Table 105: Global Medical Imaging Analysis Software Industry Revenue Million Forecast, by Modality 2019 & 2032
- Table 106: Global Medical Imaging Analysis Software Industry Volume K Unit Forecast, by Modality 2019 & 2032
- Table 107: Global Medical Imaging Analysis Software Industry Revenue Million Forecast, by Software Type 2019 & 2032
- Table 108: Global Medical Imaging Analysis Software Industry Volume K Unit Forecast, by Software Type 2019 & 2032
- Table 109: Global Medical Imaging Analysis Software Industry Revenue Million Forecast, by End User 2019 & 2032
- Table 110: Global Medical Imaging Analysis Software Industry Volume K Unit Forecast, by End User 2019 & 2032
- Table 111: Global Medical Imaging Analysis Software Industry Revenue Million Forecast, by Country 2019 & 2032
- Table 112: Global Medical Imaging Analysis Software Industry Volume K Unit Forecast, by Country 2019 & 2032
- Table 113: China Medical Imaging Analysis Software Industry Revenue (Million) Forecast, by Application 2019 & 2032
- Table 114: China Medical Imaging Analysis Software Industry Volume (K Unit) Forecast, by Application 2019 & 2032
- Table 115: Japan Medical Imaging Analysis Software Industry Revenue (Million) Forecast, by Application 2019 & 2032
- Table 116: Japan Medical Imaging Analysis Software Industry Volume (K Unit) Forecast, by Application 2019 & 2032
- Table 117: India Medical Imaging Analysis Software Industry Revenue (Million) Forecast, by Application 2019 & 2032
- Table 118: India Medical Imaging Analysis Software Industry Volume (K Unit) Forecast, by Application 2019 & 2032
- Table 119: Australia Medical Imaging Analysis Software Industry Revenue (Million) Forecast, by Application 2019 & 2032
- Table 120: Australia Medical Imaging Analysis Software Industry Volume (K Unit) Forecast, by Application 2019 & 2032
- Table 121: South Korea Medical Imaging Analysis Software Industry Revenue (Million) Forecast, by Application 2019 & 2032
- Table 122: South Korea Medical Imaging Analysis Software Industry Volume (K Unit) Forecast, by Application 2019 & 2032
- Table 123: Rest of Asia Pacific Medical Imaging Analysis Software Industry Revenue (Million) Forecast, by Application 2019 & 2032
- Table 124: Rest of Asia Pacific Medical Imaging Analysis Software Industry Volume (K Unit) Forecast, by Application 2019 & 2032
- Table 125: Global Medical Imaging Analysis Software Industry Revenue Million Forecast, by Image Type 2019 & 2032
- Table 126: Global Medical Imaging Analysis Software Industry Volume K Unit Forecast, by Image Type 2019 & 2032
- Table 127: Global Medical Imaging Analysis Software Industry Revenue Million Forecast, by Modality 2019 & 2032
- Table 128: Global Medical Imaging Analysis Software Industry Volume K Unit Forecast, by Modality 2019 & 2032
- Table 129: Global Medical Imaging Analysis Software Industry Revenue Million Forecast, by Software Type 2019 & 2032
- Table 130: Global Medical Imaging Analysis Software Industry Volume K Unit Forecast, by Software Type 2019 & 2032
- Table 131: Global Medical Imaging Analysis Software Industry Revenue Million Forecast, by End User 2019 & 2032
- Table 132: Global Medical Imaging Analysis Software Industry Volume K Unit Forecast, by End User 2019 & 2032
- Table 133: Global Medical Imaging Analysis Software Industry Revenue Million Forecast, by Country 2019 & 2032
- Table 134: Global Medical Imaging Analysis Software Industry Volume K Unit Forecast, by Country 2019 & 2032
- Table 135: GCC Medical Imaging Analysis Software Industry Revenue (Million) Forecast, by Application 2019 & 2032
- Table 136: GCC Medical Imaging Analysis Software Industry Volume (K Unit) Forecast, by Application 2019 & 2032
- Table 137: South Africa Medical Imaging Analysis Software Industry Revenue (Million) Forecast, by Application 2019 & 2032
- Table 138: South Africa Medical Imaging Analysis Software Industry Volume (K Unit) Forecast, by Application 2019 & 2032
- Table 139: Rest of Middle East and Africa Medical Imaging Analysis Software Industry Revenue (Million) Forecast, by Application 2019 & 2032
- Table 140: Rest of Middle East and Africa Medical Imaging Analysis Software Industry Volume (K Unit) Forecast, by Application 2019 & 2032
- Table 141: Global Medical Imaging Analysis Software Industry Revenue Million Forecast, by Image Type 2019 & 2032
- Table 142: Global Medical Imaging Analysis Software Industry Volume K Unit Forecast, by Image Type 2019 & 2032
- Table 143: Global Medical Imaging Analysis Software Industry Revenue Million Forecast, by Modality 2019 & 2032
- Table 144: Global Medical Imaging Analysis Software Industry Volume K Unit Forecast, by Modality 2019 & 2032
- Table 145: Global Medical Imaging Analysis Software Industry Revenue Million Forecast, by Software Type 2019 & 2032
- Table 146: Global Medical Imaging Analysis Software Industry Volume K Unit Forecast, by Software Type 2019 & 2032
- Table 147: Global Medical Imaging Analysis Software Industry Revenue Million Forecast, by End User 2019 & 2032
- Table 148: Global Medical Imaging Analysis Software Industry Volume K Unit Forecast, by End User 2019 & 2032
- Table 149: Global Medical Imaging Analysis Software Industry Revenue Million Forecast, by Country 2019 & 2032
- Table 150: Global Medical Imaging Analysis Software Industry Volume K Unit Forecast, by Country 2019 & 2032
- Table 151: Brazil Medical Imaging Analysis Software Industry Revenue (Million) Forecast, by Application 2019 & 2032
- Table 152: Brazil Medical Imaging Analysis Software Industry Volume (K Unit) Forecast, by Application 2019 & 2032
- Table 153: Argentina Medical Imaging Analysis Software Industry Revenue (Million) Forecast, by Application 2019 & 2032
- Table 154: Argentina Medical Imaging Analysis Software Industry Volume (K Unit) Forecast, by Application 2019 & 2032
- Table 155: Rest of South America Medical Imaging Analysis Software Industry Revenue (Million) Forecast, by Application 2019 & 2032
- Table 156: Rest of South America Medical Imaging Analysis Software Industry Volume (K Unit) Forecast, by Application 2019 & 2032
Frequently Asked Questions
1. What is the projected Compound Annual Growth Rate (CAGR) of the Medical Imaging Analysis Software Industry?
The projected CAGR is approximately 7.60%.
2. Which companies are prominent players in the Medical Imaging Analysis Software Industry?
Key companies in the market include Siemens Healthcare GmbH, ScienceSoft USA Corporation, RamSoft Inc, Synapsica Healthcare Pvt Ltd, Intelerad Medical Systems Incorporated, Carestream Health, Xinapse Systems Ltd, General Electric Company (GE Healthcare), Canon Inc (Canon Medical Systems USA), Koninklijke Philips NV, International Business Machines Corporation (IBM), AQUILAB SAS, Agfa-Gevaert Group.
3. What are the main segments of the Medical Imaging Analysis Software Industry?
The market segments include Image Type, Modality, Software Type, End User.
4. Can you provide details about the market size?
The market size is estimated to be USD XX Million as of 2022.
5. What are some drivers contributing to market growth?
Technological Advancements in Medical Imaging Systems and Analysis Software; Increasing Usage of Imaging Equipment Due to Rising Prevalence of Chronic Diseases; Rising Applications of Computer-aided Diagnosis.
6. What are the notable trends driving market growth?
The X-ray Imaging Segment is Expected to Witness Significant Growth Over the Forecast Period.
7. Are there any restraints impacting market growth?
Budgetary Constraints.
8. Can you provide examples of recent developments in the market?
In July 2022, Siemens Healthineers, a medical technology company, officially integrated Subtle Medical's SubtleMR image-enhancement software into the new reconstruction pipeline of Siemens Healthineers, Open Recon. SubtleMR offers DL (deep learning) post-processing for denoising and increased sharpness on faster MRI sequences, enabling improved image quality, optimized workflow, and a better patient experience.
9. What pricing options are available for accessing the report?
Pricing options include single-user, multi-user, and enterprise licenses priced at USD 4750, USD 5250, and USD 8750 respectively.
10. Is the market size provided in terms of value or volume?
The market size is provided in terms of value, measured in Million and volume, measured in K Unit.
11. Are there any specific market keywords associated with the report?
Yes, the market keyword associated with the report is "Medical Imaging Analysis Software Industry," which aids in identifying and referencing the specific market segment covered.
12. How do I determine which pricing option suits my needs best?
The pricing options vary based on user requirements and access needs. Individual users may opt for single-user licenses, while businesses requiring broader access may choose multi-user or enterprise licenses for cost-effective access to the report.
13. Are there any additional resources or data provided in the Medical Imaging Analysis Software Industry report?
While the report offers comprehensive insights, it's advisable to review the specific contents or supplementary materials provided to ascertain if additional resources or data are available.
14. How can I stay updated on further developments or reports in the Medical Imaging Analysis Software Industry?
To stay informed about further developments, trends, and reports in the Medical Imaging Analysis Software Industry, consider subscribing to industry newsletters, following relevant companies and organizations, or regularly checking reputable industry news sources and publications.
Methodology
Step 1 - Identification of Relevant Samples Size from Population Database


Step 2 - Approaches for Defining Global Market Size (Value, Volume* & Price*)

Note*: In applicable scenarios
Step 3 - Data Sources
Primary Research
- Web Analytics
- Survey Reports
- Research Institute
- Latest Research Reports
- Opinion Leaders
Secondary Research
- Annual Reports
- White Paper
- Latest Press Release
- Industry Association
- Paid Database
- Investor Presentations

Step 4 - Data Triangulation
Involves using different sources of information in order to increase the validity of a study
These sources are likely to be stakeholders in a program - participants, other researchers, program staff, other community members, and so on.
Then we put all data in single framework & apply various statistical tools to find out the dynamic on the market.
During the analysis stage, feedback from the stakeholder groups would be compared to determine areas of agreement as well as areas of divergence


