
Key Insights
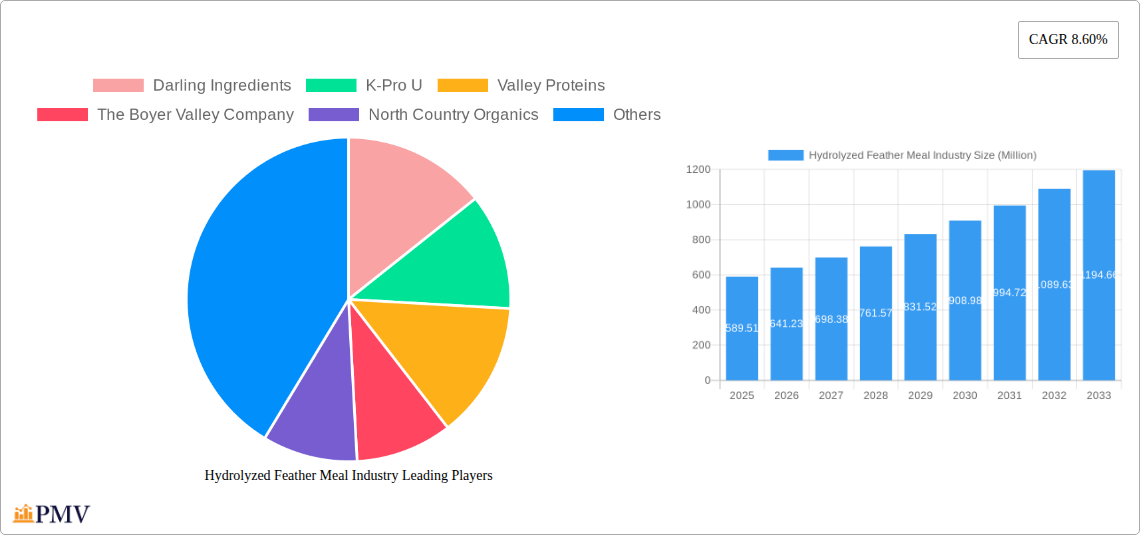
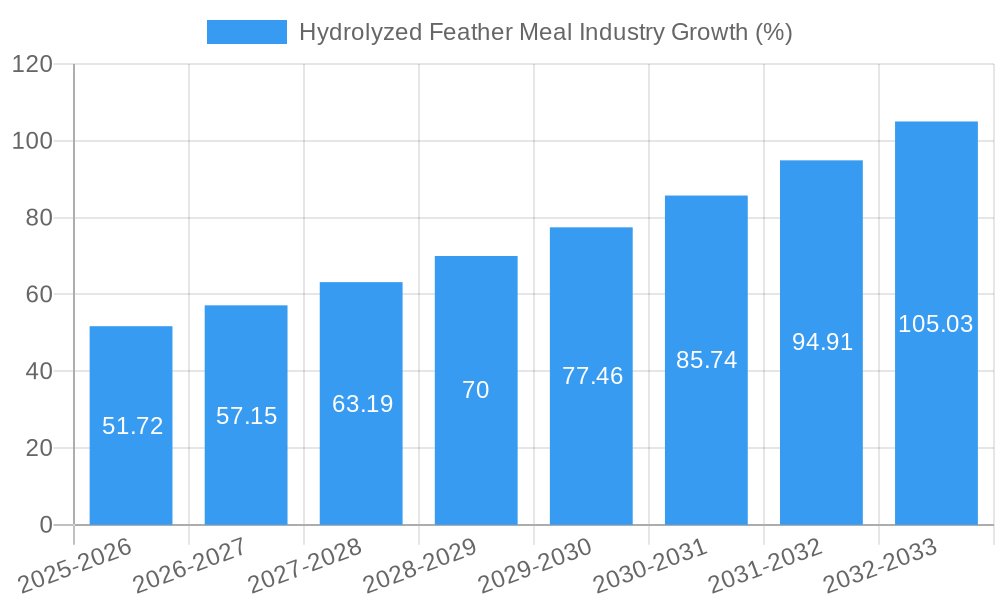
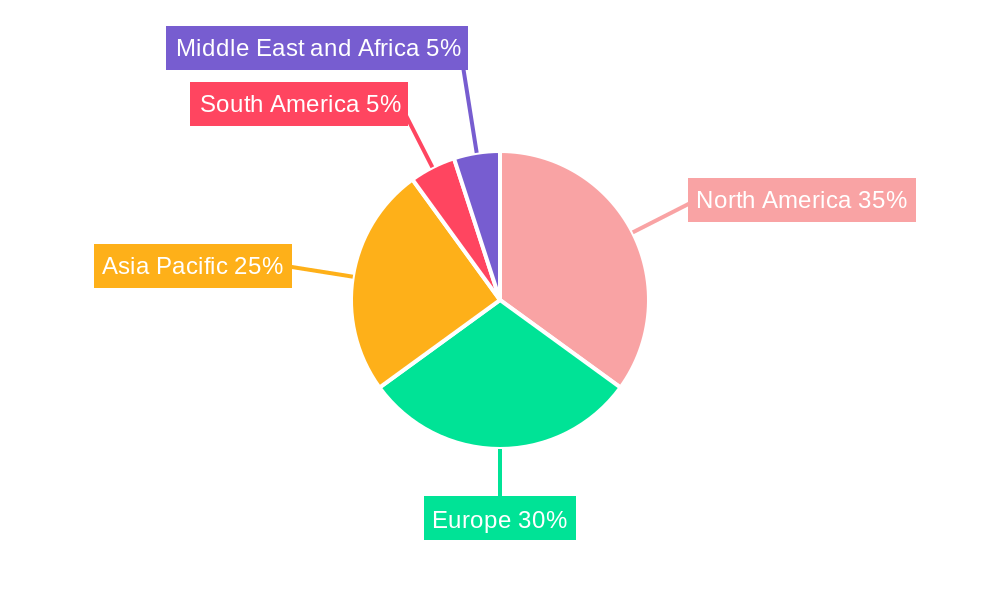
The hydrolyzed feather meal market, valued at $589.51 million in 2025, is projected to experience robust growth, driven by increasing demand for sustainable and cost-effective protein sources in animal feed. The market's Compound Annual Growth Rate (CAGR) of 8.60% from 2025 to 2033 indicates a significant expansion, fueled by the rising global population and the consequent surge in demand for meat and poultry products. The growing awareness of sustainable agricultural practices and the need to reduce reliance on traditional protein sources are further propelling market expansion. Organic hydrolyzed feather meal is witnessing particularly strong growth, driven by consumer preference for naturally sourced products in animal feed. Application-wise, animal feed dominates the market, owing to the high protein content and nutritional benefits of hydrolyzed feather meal. However, increasing applications in agrochemicals and other industrial segments are expected to contribute to market diversification and growth in the coming years. Major players such as Darling Ingredients, K-Pro U, and Valley Proteins are actively investing in research and development to improve product quality and expand their market presence. Geographical analysis reveals that North America and Europe currently hold significant market shares, but the Asia-Pacific region is anticipated to witness substantial growth in the forecast period due to increasing poultry farming and rising demand for animal protein.
Market restraints include regulatory hurdles concerning the use of hydrolyzed feather meal in certain regions and potential concerns regarding the presence of contaminants. However, continuous technological advancements in processing and purification techniques are mitigating these concerns. The industry is also witnessing increased focus on traceability and transparency, bolstering consumer confidence. The overall market outlook remains positive, with consistent growth anticipated throughout the forecast period. Strategic partnerships, mergers and acquisitions, and investments in advanced processing technologies are expected to shape the competitive landscape in the coming years. The increasing integration of hydrolyzed feather meal within sustainable agricultural practices further reinforces its long-term growth prospects.
Hydrolyzed Feather Meal Industry: A Comprehensive Market Analysis (2019-2033)
This in-depth report provides a comprehensive analysis of the global hydrolyzed feather meal industry, offering valuable insights for stakeholders across the value chain. The report covers the period 2019-2033, with a focus on the forecast period 2025-2033 and a base year of 2025. The study meticulously analyzes market dynamics, competitive landscapes, and future growth prospects, providing actionable intelligence for informed decision-making. The global market size is estimated at XX Million in 2025 and is projected to reach XX Million by 2033, exhibiting a CAGR of XX%.
Hydrolyzed Feather Meal Industry Market Structure & Competitive Dynamics
The hydrolyzed feather meal market exhibits a moderately concentrated structure, with key players holding significant market shares. Darling Ingredients, Valley Proteins, and K-Pro U are among the leading global producers, collectively accounting for an estimated XX% of the market in 2025. The industry’s innovation ecosystem is characterized by ongoing research and development efforts focused on improving the efficiency and sustainability of feather hydrolysis processes. This includes advancements in enzymatic hydrolysis techniques and the development of value-added products.
Regulatory frameworks governing the production and use of hydrolyzed feather meal vary across different regions, impacting market dynamics. Stringent environmental regulations in certain areas drive the adoption of sustainable production methods. Product substitutes, such as soy meal and fish meal, compete with hydrolyzed feather meal, particularly in the animal feed application segment. However, the increasing cost and environmental concerns associated with these alternatives present opportunities for hydrolyzed feather meal to gain market share.
End-user trends toward sustainable and cost-effective animal feed solutions are a key growth driver. The industry has witnessed a notable increase in mergers and acquisitions (M&A) activity in recent years, with deal values exceeding XX Million in the period 2019-2024. These strategic acquisitions have primarily focused on expanding production capacity, geographical reach, and product portfolios. Further consolidation is expected, driven by the pursuit of economies of scale and enhanced market competitiveness.
- Market Concentration: Moderately concentrated, with top three players holding XX% market share (2025).
- Innovation: Focus on sustainable production, improved hydrolysis techniques, and value-added product development.
- Regulatory Landscape: Varied across regions, driving adoption of sustainable practices.
- Substitutes: Soy meal, fish meal; however, cost and environmental concerns create opportunities for hydrolyzed feather meal.
- M&A Activity: Significant activity in 2019-2024, exceeding XX Million in deal value, with further consolidation anticipated.
Hydrolyzed Feather Meal Industry Industry Trends & Insights
The global hydrolyzed feather meal market is experiencing robust growth, fueled by several key trends. The increasing demand for sustainable and cost-effective protein sources in animal feed is a primary driver. The growing poultry industry, a significant source of feather waste, further contributes to market expansion. Technological advancements in hydrolysis processes, including enzymatic methods, enhance efficiency and reduce environmental impact.
Consumer preferences for sustainably produced animal products are increasingly influencing market demand. This is driving the growth of the organic segment within the hydrolyzed feather meal market. Competitive dynamics are marked by continuous innovation, investments in capacity expansion, and efforts to enhance product quality and consistency.
The market is segmented by type (conventional and organic) and application (animal feed, agrochemicals, and other applications). The animal feed segment dominates, holding the largest market share, driven by the growing demand for protein-rich feed ingredients. Technological advancements are focused on enhancing the nutritional value and digestibility of hydrolyzed feather meal. Furthermore, the rising awareness of environmental sustainability is promoting the adoption of this byproduct-based protein source, boosting its acceptance across diverse applications. The market is expected to experience a compound annual growth rate (CAGR) of XX% during the forecast period (2025-2033). Market penetration is projected to reach XX% by 2033, driven by increasing awareness and adoption among key end-users.
Dominant Markets & Segments in Hydrolyzed Feather Meal Industry
The animal feed application segment is the dominant market for hydrolyzed feather meal, accounting for approximately XX% of the global market in 2025. This is primarily driven by the high protein content of the product and its cost-effectiveness compared to other protein sources. Geographically, North America and Europe represent significant markets, driven by strong demand from the livestock and poultry industries.
Key Drivers of Dominance in Animal Feed Segment:
- High protein content and cost-effectiveness compared to alternatives like soy and fish meal.
- Growing demand from the livestock and poultry industries.
- Increasing focus on sustainable and environmentally friendly feed solutions.
Key Drivers of Dominance in North America and Europe:
- Established livestock and poultry industries.
- Strong regulatory frameworks supporting the use of hydrolyzed feather meal.
- Advanced infrastructure and supply chains.
The conventional type segment accounts for the largest share within the product type segment. However, the organic segment is experiencing robust growth, driven by growing consumer demand for organic animal products. The other applications segment, while currently smaller, shows potential for future growth, particularly in areas like biofertilizers and biomaterials.
Hydrolyzed Feather Meal Industry Product Innovations
Recent innovations focus on improving the digestibility and bioavailability of hydrolyzed feather meal through optimized hydrolysis processes. Advanced enzymatic hydrolysis techniques are gaining traction, enhancing the nutritional value and palatability of the product for animal feed applications. These advancements also reduce processing time and energy consumption, enhancing the economic and environmental profile of the product. The development of value-added products derived from hydrolyzed feather meal, such as specialized amino acid blends, further expands market opportunities. This tailored approach caters to specific end-user requirements, offering competitive advantages in niche segments.
Report Segmentation & Scope
The report segments the hydrolyzed feather meal market based on type and application.
Type:
Conventional: This segment currently holds the largest market share, driven by its cost-effectiveness and wide availability. Growth is projected to be steady, driven by ongoing demand in animal feed applications. Competitive dynamics in this segment are characterized by price competition and efficiency improvements.
Organic: This segment is experiencing rapid growth, driven by the rising consumer preference for organic and sustainably produced animal products. Growth projections are higher than the conventional segment, reflecting the increasing demand for organic feed ingredients. Competitive dynamics focus on certifications and sustainable sourcing practices.
Application:
Animal Feed: This segment constitutes the dominant application, with a significant market share in 2025. Growth is projected to be driven by increasing livestock and poultry production. Competitive dynamics involve ensuring nutritional value and cost-effectiveness compared to alternative protein sources.
Agrochemicals: This segment showcases promising potential, although it currently holds a smaller market share. Growth is projected to be influenced by the increasing demand for eco-friendly fertilizers. Competitive dynamics focus on the efficacy of hydrolyzed feather meal as a fertilizer ingredient.
Other Applications: This category encompasses emerging applications, such as in biomaterials and other niche uses. Growth prospects are highly dependent on the development of new technologies and market adoption in these sectors. Competitive dynamics are influenced by the novelty and potential of these applications.
Key Drivers of Hydrolyzed Feather Meal Industry Growth
Several factors propel the growth of the hydrolyzed feather meal industry. These include the increasing demand for sustainable and affordable protein sources in animal feed, the growing global population driving higher protein demand, advancements in hydrolysis technologies improving product quality and efficiency, and growing environmental awareness encouraging the utilization of poultry waste for resource-efficient and sustainable solutions. Favorable government policies promoting sustainable waste management further incentivize the industry's growth.
Challenges in the Hydrolyzed Feather Meal Industry Sector
Challenges include inconsistent product quality across different suppliers, stringent environmental regulations in certain regions impacting processing and disposal, competition from established protein sources like soy meal and fish meal, and fluctuations in raw material availability due to variations in poultry production impacting supply chain stability. Overcoming these challenges requires improvements in standardization, technological advancements to improve the consistency and quality of the product, and proactive strategies to navigate environmental regulations.
Leading Players in the Hydrolyzed Feather Meal Industry Market
- Darling Ingredients
- K-Pro U
- Valley Proteins
- The Boyer Valley Company
- North Country Organics
- JG Pears
- Kleingarn Agrarprodukte
- FASA Group
Key Developments in Hydrolyzed Feather Meal Industry Sector
September 2021: Indian scientists developed a new hydrodynamic sustainable, affordable technique to turn poultry feathers & animal hair into fertilizer. This development promotes the adoption of hydrolyzed feather meal as a sustainable fertilizer, expanding its application beyond animal feed.
August 2022: The University of Danang - University of Science and Technology successfully created a bio-organic fertilizer from chicken feathers. This further validates the potential of hydrolyzed feather meal in sustainable agriculture. These developments highlight the industry's commitment to innovation and sustainability, opening new avenues for growth and market expansion.
Strategic Hydrolyzed Feather Meal Industry Market Outlook
The hydrolyzed feather meal industry presents significant growth potential driven by the global demand for sustainable protein sources and advancements in hydrolysis technology. Strategic opportunities exist in expanding into emerging markets, developing value-added products, and capitalizing on the increasing consumer awareness of sustainable practices. Companies focusing on innovation, sustainability, and strategic partnerships will be best positioned to capitalize on the industry’s future growth trajectory.
Hydrolyzed Feather Meal Industry Segmentation
- 1. Production Analysis
- 2. Consumption Analysis
- 3. Import Market Analysis (Value & Volume)
- 4. Export Market Analysis (Value & Volume)
- 5. Price Trend Analysis
Hydrolyzed Feather Meal Industry Segmentation By Geography
-
1. North America
- 1.1. United States
- 1.2. Canada
- 1.3. Mexico
-
2. South America
- 2.1. Brazil
- 2.2. Argentina
- 2.3. Rest of South America
-
3. Europe
- 3.1. United Kingdom
- 3.2. Germany
- 3.3. France
- 3.4. Italy
- 3.5. Spain
- 3.6. Russia
- 3.7. Benelux
- 3.8. Nordics
- 3.9. Rest of Europe
-
4. Middle East & Africa
- 4.1. Turkey
- 4.2. Israel
- 4.3. GCC
- 4.4. North Africa
- 4.5. South Africa
- 4.6. Rest of Middle East & Africa
-
5. Asia Pacific
- 5.1. China
- 5.2. India
- 5.3. Japan
- 5.4. South Korea
- 5.5. ASEAN
- 5.6. Oceania
- 5.7. Rest of Asia Pacific
Hydrolyzed Feather Meal Industry REPORT HIGHLIGHTS
| Aspects | Details |
|---|---|
| Study Period | 2019-2033 |
| Base Year | 2024 |
| Estimated Year | 2025 |
| Forecast Period | 2025-2033 |
| Historical Period | 2019-2024 |
| Growth Rate | CAGR of 8.60% from 2019-2033 |
| Segmentation |
|
Table of Contents
- 1. Introduction
- 1.1. Research Scope
- 1.2. Market Segmentation
- 1.3. Research Methodology
- 1.4. Definitions and Assumptions
- 2. Executive Summary
- 2.1. Introduction
- 3. Market Dynamics
- 3.1. Introduction
- 3.2. Market Drivers
- 3.2.1. Adoption of Organic and Eco-friendly Farming Practices; Declining Area of Arable Land and Rising Food Security Concerns
- 3.3. Market Restrains
- 3.3.1. High Demand for Conventional and Synthetic Products; Lack of Awareness and Other Factors Limiting the Adoption of Agricultural Inoculants
- 3.4. Market Trends
- 3.4.1. Increasing demand for organic farming accelerating feather meal market
- 4. Market Factor Analysis
- 4.1. Porters Five Forces
- 4.2. Supply/Value Chain
- 4.3. PESTEL analysis
- 4.4. Market Entropy
- 4.5. Patent/Trademark Analysis
- 5. Global Hydrolyzed Feather Meal Industry Analysis, Insights and Forecast, 2019-2031
- 5.1. Market Analysis, Insights and Forecast - by Production Analysis
- 5.2. Market Analysis, Insights and Forecast - by Consumption Analysis
- 5.3. Market Analysis, Insights and Forecast - by Import Market Analysis (Value & Volume)
- 5.4. Market Analysis, Insights and Forecast - by Export Market Analysis (Value & Volume)
- 5.5. Market Analysis, Insights and Forecast - by Price Trend Analysis
- 5.6. Market Analysis, Insights and Forecast - by Region
- 5.6.1. North America
- 5.6.2. South America
- 5.6.3. Europe
- 5.6.4. Middle East & Africa
- 5.6.5. Asia Pacific
- 5.1. Market Analysis, Insights and Forecast - by Production Analysis
- 6. North America Hydrolyzed Feather Meal Industry Analysis, Insights and Forecast, 2019-2031
- 6.1. Market Analysis, Insights and Forecast - by Production Analysis
- 6.2. Market Analysis, Insights and Forecast - by Consumption Analysis
- 6.3. Market Analysis, Insights and Forecast - by Import Market Analysis (Value & Volume)
- 6.4. Market Analysis, Insights and Forecast - by Export Market Analysis (Value & Volume)
- 6.5. Market Analysis, Insights and Forecast - by Price Trend Analysis
- 6.1. Market Analysis, Insights and Forecast - by Production Analysis
- 7. South America Hydrolyzed Feather Meal Industry Analysis, Insights and Forecast, 2019-2031
- 7.1. Market Analysis, Insights and Forecast - by Production Analysis
- 7.2. Market Analysis, Insights and Forecast - by Consumption Analysis
- 7.3. Market Analysis, Insights and Forecast - by Import Market Analysis (Value & Volume)
- 7.4. Market Analysis, Insights and Forecast - by Export Market Analysis (Value & Volume)
- 7.5. Market Analysis, Insights and Forecast - by Price Trend Analysis
- 7.1. Market Analysis, Insights and Forecast - by Production Analysis
- 8. Europe Hydrolyzed Feather Meal Industry Analysis, Insights and Forecast, 2019-2031
- 8.1. Market Analysis, Insights and Forecast - by Production Analysis
- 8.2. Market Analysis, Insights and Forecast - by Consumption Analysis
- 8.3. Market Analysis, Insights and Forecast - by Import Market Analysis (Value & Volume)
- 8.4. Market Analysis, Insights and Forecast - by Export Market Analysis (Value & Volume)
- 8.5. Market Analysis, Insights and Forecast - by Price Trend Analysis
- 8.1. Market Analysis, Insights and Forecast - by Production Analysis
- 9. Middle East & Africa Hydrolyzed Feather Meal Industry Analysis, Insights and Forecast, 2019-2031
- 9.1. Market Analysis, Insights and Forecast - by Production Analysis
- 9.2. Market Analysis, Insights and Forecast - by Consumption Analysis
- 9.3. Market Analysis, Insights and Forecast - by Import Market Analysis (Value & Volume)
- 9.4. Market Analysis, Insights and Forecast - by Export Market Analysis (Value & Volume)
- 9.5. Market Analysis, Insights and Forecast - by Price Trend Analysis
- 9.1. Market Analysis, Insights and Forecast - by Production Analysis
- 10. Asia Pacific Hydrolyzed Feather Meal Industry Analysis, Insights and Forecast, 2019-2031
- 10.1. Market Analysis, Insights and Forecast - by Production Analysis
- 10.2. Market Analysis, Insights and Forecast - by Consumption Analysis
- 10.3. Market Analysis, Insights and Forecast - by Import Market Analysis (Value & Volume)
- 10.4. Market Analysis, Insights and Forecast - by Export Market Analysis (Value & Volume)
- 10.5. Market Analysis, Insights and Forecast - by Price Trend Analysis
- 10.1. Market Analysis, Insights and Forecast - by Production Analysis
- 11. North America Hydrolyzed Feather Meal Industry Analysis, Insights and Forecast, 2019-2031
- 11.1. Market Analysis, Insights and Forecast - By Country/Sub-region
- 11.1.1 United States
- 11.1.2 Canada
- 11.1.3 Mexico
- 11.1.4 Rest of North America
- 12. Europe Hydrolyzed Feather Meal Industry Analysis, Insights and Forecast, 2019-2031
- 12.1. Market Analysis, Insights and Forecast - By Country/Sub-region
- 12.1.1 Germany
- 12.1.2 United Kingdom
- 12.1.3 France
- 12.1.4 Russia
- 12.1.5 Spain
- 12.1.6 Rest of Europe
- 13. Asia Pacific Hydrolyzed Feather Meal Industry Analysis, Insights and Forecast, 2019-2031
- 13.1. Market Analysis, Insights and Forecast - By Country/Sub-region
- 13.1.1 China
- 13.1.2 India
- 13.1.3 Japan
- 13.1.4 Indonesia
- 13.1.5 Rest of Asia Pacific
- 14. South America Hydrolyzed Feather Meal Industry Analysis, Insights and Forecast, 2019-2031
- 14.1. Market Analysis, Insights and Forecast - By Country/Sub-region
- 14.1.1 Brazil
- 14.1.2 Argentina
- 14.1.3 Rest of South America
- 15. Middle East and Africa Hydrolyzed Feather Meal Industry Analysis, Insights and Forecast, 2019-2031
- 15.1. Market Analysis, Insights and Forecast - By Country/Sub-region
- 15.1.1 South Africa
- 15.1.2 Egypt
- 15.1.3 Rest of Middle East and Africa
- 16. Competitive Analysis
- 16.1. Global Market Share Analysis 2024
- 16.2. Company Profiles
- 16.2.1 Darling Ingredients
- 16.2.1.1. Overview
- 16.2.1.2. Products
- 16.2.1.3. SWOT Analysis
- 16.2.1.4. Recent Developments
- 16.2.1.5. Financials (Based on Availability)
- 16.2.2 K-Pro U
- 16.2.2.1. Overview
- 16.2.2.2. Products
- 16.2.2.3. SWOT Analysis
- 16.2.2.4. Recent Developments
- 16.2.2.5. Financials (Based on Availability)
- 16.2.3 Valley Proteins
- 16.2.3.1. Overview
- 16.2.3.2. Products
- 16.2.3.3. SWOT Analysis
- 16.2.3.4. Recent Developments
- 16.2.3.5. Financials (Based on Availability)
- 16.2.4 The Boyer Valley Company
- 16.2.4.1. Overview
- 16.2.4.2. Products
- 16.2.4.3. SWOT Analysis
- 16.2.4.4. Recent Developments
- 16.2.4.5. Financials (Based on Availability)
- 16.2.5 North Country Organics
- 16.2.5.1. Overview
- 16.2.5.2. Products
- 16.2.5.3. SWOT Analysis
- 16.2.5.4. Recent Developments
- 16.2.5.5. Financials (Based on Availability)
- 16.2.6 JG Pears
- 16.2.6.1. Overview
- 16.2.6.2. Products
- 16.2.6.3. SWOT Analysis
- 16.2.6.4. Recent Developments
- 16.2.6.5. Financials (Based on Availability)
- 16.2.7 Kleingarn Agrarprodukte
- 16.2.7.1. Overview
- 16.2.7.2. Products
- 16.2.7.3. SWOT Analysis
- 16.2.7.4. Recent Developments
- 16.2.7.5. Financials (Based on Availability)
- 16.2.8 FASA Group
- 16.2.8.1. Overview
- 16.2.8.2. Products
- 16.2.8.3. SWOT Analysis
- 16.2.8.4. Recent Developments
- 16.2.8.5. Financials (Based on Availability)
- 16.2.1 Darling Ingredients
List of Figures
- Figure 1: Global Hydrolyzed Feather Meal Industry Revenue Breakdown (Million, %) by Region 2024 & 2032
- Figure 2: North America Hydrolyzed Feather Meal Industry Revenue (Million), by Country 2024 & 2032
- Figure 3: North America Hydrolyzed Feather Meal Industry Revenue Share (%), by Country 2024 & 2032
- Figure 4: Europe Hydrolyzed Feather Meal Industry Revenue (Million), by Country 2024 & 2032
- Figure 5: Europe Hydrolyzed Feather Meal Industry Revenue Share (%), by Country 2024 & 2032
- Figure 6: Asia Pacific Hydrolyzed Feather Meal Industry Revenue (Million), by Country 2024 & 2032
- Figure 7: Asia Pacific Hydrolyzed Feather Meal Industry Revenue Share (%), by Country 2024 & 2032
- Figure 8: South America Hydrolyzed Feather Meal Industry Revenue (Million), by Country 2024 & 2032
- Figure 9: South America Hydrolyzed Feather Meal Industry Revenue Share (%), by Country 2024 & 2032
- Figure 10: Middle East and Africa Hydrolyzed Feather Meal Industry Revenue (Million), by Country 2024 & 2032
- Figure 11: Middle East and Africa Hydrolyzed Feather Meal Industry Revenue Share (%), by Country 2024 & 2032
- Figure 12: North America Hydrolyzed Feather Meal Industry Revenue (Million), by Production Analysis 2024 & 2032
- Figure 13: North America Hydrolyzed Feather Meal Industry Revenue Share (%), by Production Analysis 2024 & 2032
- Figure 14: North America Hydrolyzed Feather Meal Industry Revenue (Million), by Consumption Analysis 2024 & 2032
- Figure 15: North America Hydrolyzed Feather Meal Industry Revenue Share (%), by Consumption Analysis 2024 & 2032
- Figure 16: North America Hydrolyzed Feather Meal Industry Revenue (Million), by Import Market Analysis (Value & Volume) 2024 & 2032
- Figure 17: North America Hydrolyzed Feather Meal Industry Revenue Share (%), by Import Market Analysis (Value & Volume) 2024 & 2032
- Figure 18: North America Hydrolyzed Feather Meal Industry Revenue (Million), by Export Market Analysis (Value & Volume) 2024 & 2032
- Figure 19: North America Hydrolyzed Feather Meal Industry Revenue Share (%), by Export Market Analysis (Value & Volume) 2024 & 2032
- Figure 20: North America Hydrolyzed Feather Meal Industry Revenue (Million), by Price Trend Analysis 2024 & 2032
- Figure 21: North America Hydrolyzed Feather Meal Industry Revenue Share (%), by Price Trend Analysis 2024 & 2032
- Figure 22: North America Hydrolyzed Feather Meal Industry Revenue (Million), by Country 2024 & 2032
- Figure 23: North America Hydrolyzed Feather Meal Industry Revenue Share (%), by Country 2024 & 2032
- Figure 24: South America Hydrolyzed Feather Meal Industry Revenue (Million), by Production Analysis 2024 & 2032
- Figure 25: South America Hydrolyzed Feather Meal Industry Revenue Share (%), by Production Analysis 2024 & 2032
- Figure 26: South America Hydrolyzed Feather Meal Industry Revenue (Million), by Consumption Analysis 2024 & 2032
- Figure 27: South America Hydrolyzed Feather Meal Industry Revenue Share (%), by Consumption Analysis 2024 & 2032
- Figure 28: South America Hydrolyzed Feather Meal Industry Revenue (Million), by Import Market Analysis (Value & Volume) 2024 & 2032
- Figure 29: South America Hydrolyzed Feather Meal Industry Revenue Share (%), by Import Market Analysis (Value & Volume) 2024 & 2032
- Figure 30: South America Hydrolyzed Feather Meal Industry Revenue (Million), by Export Market Analysis (Value & Volume) 2024 & 2032
- Figure 31: South America Hydrolyzed Feather Meal Industry Revenue Share (%), by Export Market Analysis (Value & Volume) 2024 & 2032
- Figure 32: South America Hydrolyzed Feather Meal Industry Revenue (Million), by Price Trend Analysis 2024 & 2032
- Figure 33: South America Hydrolyzed Feather Meal Industry Revenue Share (%), by Price Trend Analysis 2024 & 2032
- Figure 34: South America Hydrolyzed Feather Meal Industry Revenue (Million), by Country 2024 & 2032
- Figure 35: South America Hydrolyzed Feather Meal Industry Revenue Share (%), by Country 2024 & 2032
- Figure 36: Europe Hydrolyzed Feather Meal Industry Revenue (Million), by Production Analysis 2024 & 2032
- Figure 37: Europe Hydrolyzed Feather Meal Industry Revenue Share (%), by Production Analysis 2024 & 2032
- Figure 38: Europe Hydrolyzed Feather Meal Industry Revenue (Million), by Consumption Analysis 2024 & 2032
- Figure 39: Europe Hydrolyzed Feather Meal Industry Revenue Share (%), by Consumption Analysis 2024 & 2032
- Figure 40: Europe Hydrolyzed Feather Meal Industry Revenue (Million), by Import Market Analysis (Value & Volume) 2024 & 2032
- Figure 41: Europe Hydrolyzed Feather Meal Industry Revenue Share (%), by Import Market Analysis (Value & Volume) 2024 & 2032
- Figure 42: Europe Hydrolyzed Feather Meal Industry Revenue (Million), by Export Market Analysis (Value & Volume) 2024 & 2032
- Figure 43: Europe Hydrolyzed Feather Meal Industry Revenue Share (%), by Export Market Analysis (Value & Volume) 2024 & 2032
- Figure 44: Europe Hydrolyzed Feather Meal Industry Revenue (Million), by Price Trend Analysis 2024 & 2032
- Figure 45: Europe Hydrolyzed Feather Meal Industry Revenue Share (%), by Price Trend Analysis 2024 & 2032
- Figure 46: Europe Hydrolyzed Feather Meal Industry Revenue (Million), by Country 2024 & 2032
- Figure 47: Europe Hydrolyzed Feather Meal Industry Revenue Share (%), by Country 2024 & 2032
- Figure 48: Middle East & Africa Hydrolyzed Feather Meal Industry Revenue (Million), by Production Analysis 2024 & 2032
- Figure 49: Middle East & Africa Hydrolyzed Feather Meal Industry Revenue Share (%), by Production Analysis 2024 & 2032
- Figure 50: Middle East & Africa Hydrolyzed Feather Meal Industry Revenue (Million), by Consumption Analysis 2024 & 2032
- Figure 51: Middle East & Africa Hydrolyzed Feather Meal Industry Revenue Share (%), by Consumption Analysis 2024 & 2032
- Figure 52: Middle East & Africa Hydrolyzed Feather Meal Industry Revenue (Million), by Import Market Analysis (Value & Volume) 2024 & 2032
- Figure 53: Middle East & Africa Hydrolyzed Feather Meal Industry Revenue Share (%), by Import Market Analysis (Value & Volume) 2024 & 2032
- Figure 54: Middle East & Africa Hydrolyzed Feather Meal Industry Revenue (Million), by Export Market Analysis (Value & Volume) 2024 & 2032
- Figure 55: Middle East & Africa Hydrolyzed Feather Meal Industry Revenue Share (%), by Export Market Analysis (Value & Volume) 2024 & 2032
- Figure 56: Middle East & Africa Hydrolyzed Feather Meal Industry Revenue (Million), by Price Trend Analysis 2024 & 2032
- Figure 57: Middle East & Africa Hydrolyzed Feather Meal Industry Revenue Share (%), by Price Trend Analysis 2024 & 2032
- Figure 58: Middle East & Africa Hydrolyzed Feather Meal Industry Revenue (Million), by Country 2024 & 2032
- Figure 59: Middle East & Africa Hydrolyzed Feather Meal Industry Revenue Share (%), by Country 2024 & 2032
- Figure 60: Asia Pacific Hydrolyzed Feather Meal Industry Revenue (Million), by Production Analysis 2024 & 2032
- Figure 61: Asia Pacific Hydrolyzed Feather Meal Industry Revenue Share (%), by Production Analysis 2024 & 2032
- Figure 62: Asia Pacific Hydrolyzed Feather Meal Industry Revenue (Million), by Consumption Analysis 2024 & 2032
- Figure 63: Asia Pacific Hydrolyzed Feather Meal Industry Revenue Share (%), by Consumption Analysis 2024 & 2032
- Figure 64: Asia Pacific Hydrolyzed Feather Meal Industry Revenue (Million), by Import Market Analysis (Value & Volume) 2024 & 2032
- Figure 65: Asia Pacific Hydrolyzed Feather Meal Industry Revenue Share (%), by Import Market Analysis (Value & Volume) 2024 & 2032
- Figure 66: Asia Pacific Hydrolyzed Feather Meal Industry Revenue (Million), by Export Market Analysis (Value & Volume) 2024 & 2032
- Figure 67: Asia Pacific Hydrolyzed Feather Meal Industry Revenue Share (%), by Export Market Analysis (Value & Volume) 2024 & 2032
- Figure 68: Asia Pacific Hydrolyzed Feather Meal Industry Revenue (Million), by Price Trend Analysis 2024 & 2032
- Figure 69: Asia Pacific Hydrolyzed Feather Meal Industry Revenue Share (%), by Price Trend Analysis 2024 & 2032
- Figure 70: Asia Pacific Hydrolyzed Feather Meal Industry Revenue (Million), by Country 2024 & 2032
- Figure 71: Asia Pacific Hydrolyzed Feather Meal Industry Revenue Share (%), by Country 2024 & 2032
List of Tables
- Table 1: Global Hydrolyzed Feather Meal Industry Revenue Million Forecast, by Region 2019 & 2032
- Table 2: Global Hydrolyzed Feather Meal Industry Revenue Million Forecast, by Production Analysis 2019 & 2032
- Table 3: Global Hydrolyzed Feather Meal Industry Revenue Million Forecast, by Consumption Analysis 2019 & 2032
- Table 4: Global Hydrolyzed Feather Meal Industry Revenue Million Forecast, by Import Market Analysis (Value & Volume) 2019 & 2032
- Table 5: Global Hydrolyzed Feather Meal Industry Revenue Million Forecast, by Export Market Analysis (Value & Volume) 2019 & 2032
- Table 6: Global Hydrolyzed Feather Meal Industry Revenue Million Forecast, by Price Trend Analysis 2019 & 2032
- Table 7: Global Hydrolyzed Feather Meal Industry Revenue Million Forecast, by Region 2019 & 2032
- Table 8: Global Hydrolyzed Feather Meal Industry Revenue Million Forecast, by Country 2019 & 2032
- Table 9: United States Hydrolyzed Feather Meal Industry Revenue (Million) Forecast, by Application 2019 & 2032
- Table 10: Canada Hydrolyzed Feather Meal Industry Revenue (Million) Forecast, by Application 2019 & 2032
- Table 11: Mexico Hydrolyzed Feather Meal Industry Revenue (Million) Forecast, by Application 2019 & 2032
- Table 12: Rest of North America Hydrolyzed Feather Meal Industry Revenue (Million) Forecast, by Application 2019 & 2032
- Table 13: Global Hydrolyzed Feather Meal Industry Revenue Million Forecast, by Country 2019 & 2032
- Table 14: Germany Hydrolyzed Feather Meal Industry Revenue (Million) Forecast, by Application 2019 & 2032
- Table 15: United Kingdom Hydrolyzed Feather Meal Industry Revenue (Million) Forecast, by Application 2019 & 2032
- Table 16: France Hydrolyzed Feather Meal Industry Revenue (Million) Forecast, by Application 2019 & 2032
- Table 17: Russia Hydrolyzed Feather Meal Industry Revenue (Million) Forecast, by Application 2019 & 2032
- Table 18: Spain Hydrolyzed Feather Meal Industry Revenue (Million) Forecast, by Application 2019 & 2032
- Table 19: Rest of Europe Hydrolyzed Feather Meal Industry Revenue (Million) Forecast, by Application 2019 & 2032
- Table 20: Global Hydrolyzed Feather Meal Industry Revenue Million Forecast, by Country 2019 & 2032
- Table 21: China Hydrolyzed Feather Meal Industry Revenue (Million) Forecast, by Application 2019 & 2032
- Table 22: India Hydrolyzed Feather Meal Industry Revenue (Million) Forecast, by Application 2019 & 2032
- Table 23: Japan Hydrolyzed Feather Meal Industry Revenue (Million) Forecast, by Application 2019 & 2032
- Table 24: Indonesia Hydrolyzed Feather Meal Industry Revenue (Million) Forecast, by Application 2019 & 2032
- Table 25: Rest of Asia Pacific Hydrolyzed Feather Meal Industry Revenue (Million) Forecast, by Application 2019 & 2032
- Table 26: Global Hydrolyzed Feather Meal Industry Revenue Million Forecast, by Country 2019 & 2032
- Table 27: Brazil Hydrolyzed Feather Meal Industry Revenue (Million) Forecast, by Application 2019 & 2032
- Table 28: Argentina Hydrolyzed Feather Meal Industry Revenue (Million) Forecast, by Application 2019 & 2032
- Table 29: Rest of South America Hydrolyzed Feather Meal Industry Revenue (Million) Forecast, by Application 2019 & 2032
- Table 30: Global Hydrolyzed Feather Meal Industry Revenue Million Forecast, by Country 2019 & 2032
- Table 31: South Africa Hydrolyzed Feather Meal Industry Revenue (Million) Forecast, by Application 2019 & 2032
- Table 32: Egypt Hydrolyzed Feather Meal Industry Revenue (Million) Forecast, by Application 2019 & 2032
- Table 33: Rest of Middle East and Africa Hydrolyzed Feather Meal Industry Revenue (Million) Forecast, by Application 2019 & 2032
- Table 34: Global Hydrolyzed Feather Meal Industry Revenue Million Forecast, by Production Analysis 2019 & 2032
- Table 35: Global Hydrolyzed Feather Meal Industry Revenue Million Forecast, by Consumption Analysis 2019 & 2032
- Table 36: Global Hydrolyzed Feather Meal Industry Revenue Million Forecast, by Import Market Analysis (Value & Volume) 2019 & 2032
- Table 37: Global Hydrolyzed Feather Meal Industry Revenue Million Forecast, by Export Market Analysis (Value & Volume) 2019 & 2032
- Table 38: Global Hydrolyzed Feather Meal Industry Revenue Million Forecast, by Price Trend Analysis 2019 & 2032
- Table 39: Global Hydrolyzed Feather Meal Industry Revenue Million Forecast, by Country 2019 & 2032
- Table 40: United States Hydrolyzed Feather Meal Industry Revenue (Million) Forecast, by Application 2019 & 2032
- Table 41: Canada Hydrolyzed Feather Meal Industry Revenue (Million) Forecast, by Application 2019 & 2032
- Table 42: Mexico Hydrolyzed Feather Meal Industry Revenue (Million) Forecast, by Application 2019 & 2032
- Table 43: Global Hydrolyzed Feather Meal Industry Revenue Million Forecast, by Production Analysis 2019 & 2032
- Table 44: Global Hydrolyzed Feather Meal Industry Revenue Million Forecast, by Consumption Analysis 2019 & 2032
- Table 45: Global Hydrolyzed Feather Meal Industry Revenue Million Forecast, by Import Market Analysis (Value & Volume) 2019 & 2032
- Table 46: Global Hydrolyzed Feather Meal Industry Revenue Million Forecast, by Export Market Analysis (Value & Volume) 2019 & 2032
- Table 47: Global Hydrolyzed Feather Meal Industry Revenue Million Forecast, by Price Trend Analysis 2019 & 2032
- Table 48: Global Hydrolyzed Feather Meal Industry Revenue Million Forecast, by Country 2019 & 2032
- Table 49: Brazil Hydrolyzed Feather Meal Industry Revenue (Million) Forecast, by Application 2019 & 2032
- Table 50: Argentina Hydrolyzed Feather Meal Industry Revenue (Million) Forecast, by Application 2019 & 2032
- Table 51: Rest of South America Hydrolyzed Feather Meal Industry Revenue (Million) Forecast, by Application 2019 & 2032
- Table 52: Global Hydrolyzed Feather Meal Industry Revenue Million Forecast, by Production Analysis 2019 & 2032
- Table 53: Global Hydrolyzed Feather Meal Industry Revenue Million Forecast, by Consumption Analysis 2019 & 2032
- Table 54: Global Hydrolyzed Feather Meal Industry Revenue Million Forecast, by Import Market Analysis (Value & Volume) 2019 & 2032
- Table 55: Global Hydrolyzed Feather Meal Industry Revenue Million Forecast, by Export Market Analysis (Value & Volume) 2019 & 2032
- Table 56: Global Hydrolyzed Feather Meal Industry Revenue Million Forecast, by Price Trend Analysis 2019 & 2032
- Table 57: Global Hydrolyzed Feather Meal Industry Revenue Million Forecast, by Country 2019 & 2032
- Table 58: United Kingdom Hydrolyzed Feather Meal Industry Revenue (Million) Forecast, by Application 2019 & 2032
- Table 59: Germany Hydrolyzed Feather Meal Industry Revenue (Million) Forecast, by Application 2019 & 2032
- Table 60: France Hydrolyzed Feather Meal Industry Revenue (Million) Forecast, by Application 2019 & 2032
- Table 61: Italy Hydrolyzed Feather Meal Industry Revenue (Million) Forecast, by Application 2019 & 2032
- Table 62: Spain Hydrolyzed Feather Meal Industry Revenue (Million) Forecast, by Application 2019 & 2032
- Table 63: Russia Hydrolyzed Feather Meal Industry Revenue (Million) Forecast, by Application 2019 & 2032
- Table 64: Benelux Hydrolyzed Feather Meal Industry Revenue (Million) Forecast, by Application 2019 & 2032
- Table 65: Nordics Hydrolyzed Feather Meal Industry Revenue (Million) Forecast, by Application 2019 & 2032
- Table 66: Rest of Europe Hydrolyzed Feather Meal Industry Revenue (Million) Forecast, by Application 2019 & 2032
- Table 67: Global Hydrolyzed Feather Meal Industry Revenue Million Forecast, by Production Analysis 2019 & 2032
- Table 68: Global Hydrolyzed Feather Meal Industry Revenue Million Forecast, by Consumption Analysis 2019 & 2032
- Table 69: Global Hydrolyzed Feather Meal Industry Revenue Million Forecast, by Import Market Analysis (Value & Volume) 2019 & 2032
- Table 70: Global Hydrolyzed Feather Meal Industry Revenue Million Forecast, by Export Market Analysis (Value & Volume) 2019 & 2032
- Table 71: Global Hydrolyzed Feather Meal Industry Revenue Million Forecast, by Price Trend Analysis 2019 & 2032
- Table 72: Global Hydrolyzed Feather Meal Industry Revenue Million Forecast, by Country 2019 & 2032
- Table 73: Turkey Hydrolyzed Feather Meal Industry Revenue (Million) Forecast, by Application 2019 & 2032
- Table 74: Israel Hydrolyzed Feather Meal Industry Revenue (Million) Forecast, by Application 2019 & 2032
- Table 75: GCC Hydrolyzed Feather Meal Industry Revenue (Million) Forecast, by Application 2019 & 2032
- Table 76: North Africa Hydrolyzed Feather Meal Industry Revenue (Million) Forecast, by Application 2019 & 2032
- Table 77: South Africa Hydrolyzed Feather Meal Industry Revenue (Million) Forecast, by Application 2019 & 2032
- Table 78: Rest of Middle East & Africa Hydrolyzed Feather Meal Industry Revenue (Million) Forecast, by Application 2019 & 2032
- Table 79: Global Hydrolyzed Feather Meal Industry Revenue Million Forecast, by Production Analysis 2019 & 2032
- Table 80: Global Hydrolyzed Feather Meal Industry Revenue Million Forecast, by Consumption Analysis 2019 & 2032
- Table 81: Global Hydrolyzed Feather Meal Industry Revenue Million Forecast, by Import Market Analysis (Value & Volume) 2019 & 2032
- Table 82: Global Hydrolyzed Feather Meal Industry Revenue Million Forecast, by Export Market Analysis (Value & Volume) 2019 & 2032
- Table 83: Global Hydrolyzed Feather Meal Industry Revenue Million Forecast, by Price Trend Analysis 2019 & 2032
- Table 84: Global Hydrolyzed Feather Meal Industry Revenue Million Forecast, by Country 2019 & 2032
- Table 85: China Hydrolyzed Feather Meal Industry Revenue (Million) Forecast, by Application 2019 & 2032
- Table 86: India Hydrolyzed Feather Meal Industry Revenue (Million) Forecast, by Application 2019 & 2032
- Table 87: Japan Hydrolyzed Feather Meal Industry Revenue (Million) Forecast, by Application 2019 & 2032
- Table 88: South Korea Hydrolyzed Feather Meal Industry Revenue (Million) Forecast, by Application 2019 & 2032
- Table 89: ASEAN Hydrolyzed Feather Meal Industry Revenue (Million) Forecast, by Application 2019 & 2032
- Table 90: Oceania Hydrolyzed Feather Meal Industry Revenue (Million) Forecast, by Application 2019 & 2032
- Table 91: Rest of Asia Pacific Hydrolyzed Feather Meal Industry Revenue (Million) Forecast, by Application 2019 & 2032
Frequently Asked Questions
1. What is the projected Compound Annual Growth Rate (CAGR) of the Hydrolyzed Feather Meal Industry?
The projected CAGR is approximately 8.60%.
2. Which companies are prominent players in the Hydrolyzed Feather Meal Industry?
Key companies in the market include Darling Ingredients, K-Pro U, Valley Proteins, The Boyer Valley Company, North Country Organics, JG Pears, Kleingarn Agrarprodukte, FASA Group.
3. What are the main segments of the Hydrolyzed Feather Meal Industry?
The market segments include Production Analysis, Consumption Analysis, Import Market Analysis (Value & Volume), Export Market Analysis (Value & Volume), Price Trend Analysis.
4. Can you provide details about the market size?
The market size is estimated to be USD 589.51 Million as of 2022.
5. What are some drivers contributing to market growth?
Adoption of Organic and Eco-friendly Farming Practices; Declining Area of Arable Land and Rising Food Security Concerns.
6. What are the notable trends driving market growth?
Increasing demand for organic farming accelerating feather meal market.
7. Are there any restraints impacting market growth?
High Demand for Conventional and Synthetic Products; Lack of Awareness and Other Factors Limiting the Adoption of Agricultural Inoculants.
8. Can you provide examples of recent developments in the market?
August 2022: The University of Danang - University of Science and Technology has successfully made a type of bio-organic fertilizer from chicken feathers with the desire to reduce environmental pollution from by-products such as chicken feathers.
9. What pricing options are available for accessing the report?
Pricing options include single-user, multi-user, and enterprise licenses priced at USD 4750, USD 5250, and USD 8750 respectively.
10. Is the market size provided in terms of value or volume?
The market size is provided in terms of value, measured in Million.
11. Are there any specific market keywords associated with the report?
Yes, the market keyword associated with the report is "Hydrolyzed Feather Meal Industry," which aids in identifying and referencing the specific market segment covered.
12. How do I determine which pricing option suits my needs best?
The pricing options vary based on user requirements and access needs. Individual users may opt for single-user licenses, while businesses requiring broader access may choose multi-user or enterprise licenses for cost-effective access to the report.
13. Are there any additional resources or data provided in the Hydrolyzed Feather Meal Industry report?
While the report offers comprehensive insights, it's advisable to review the specific contents or supplementary materials provided to ascertain if additional resources or data are available.
14. How can I stay updated on further developments or reports in the Hydrolyzed Feather Meal Industry?
To stay informed about further developments, trends, and reports in the Hydrolyzed Feather Meal Industry, consider subscribing to industry newsletters, following relevant companies and organizations, or regularly checking reputable industry news sources and publications.
Methodology
Step 1 - Identification of Relevant Samples Size from Population Database


Step 2 - Approaches for Defining Global Market Size (Value, Volume* & Price*)

Note*: In applicable scenarios
Step 3 - Data Sources
Primary Research
- Web Analytics
- Survey Reports
- Research Institute
- Latest Research Reports
- Opinion Leaders
Secondary Research
- Annual Reports
- White Paper
- Latest Press Release
- Industry Association
- Paid Database
- Investor Presentations

Step 4 - Data Triangulation
Involves using different sources of information in order to increase the validity of a study
These sources are likely to be stakeholders in a program - participants, other researchers, program staff, other community members, and so on.
Then we put all data in single framework & apply various statistical tools to find out the dynamic on the market.
During the analysis stage, feedback from the stakeholder groups would be compared to determine areas of agreement as well as areas of divergence


