
Key Insights
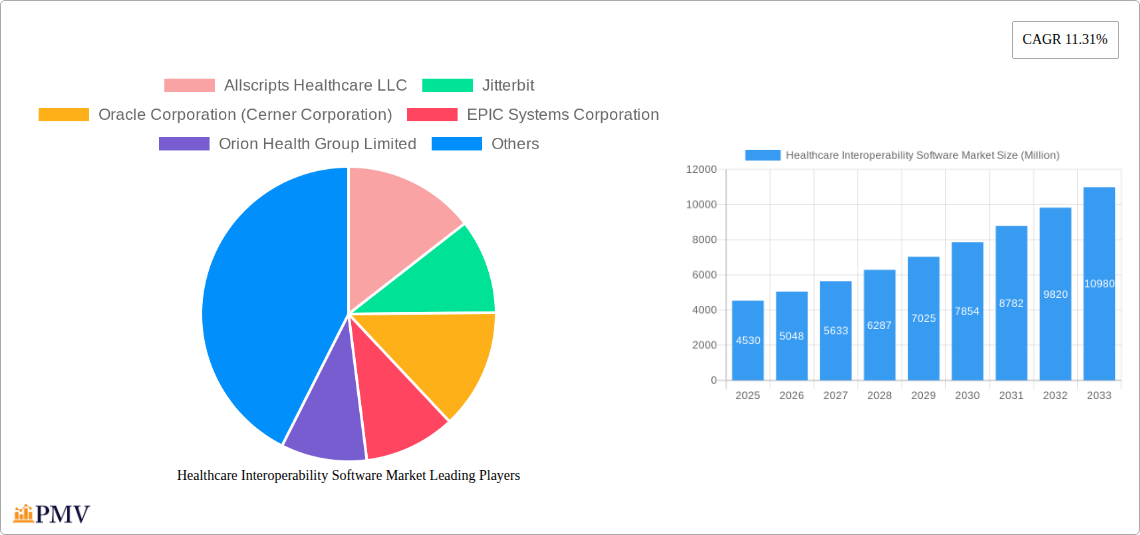
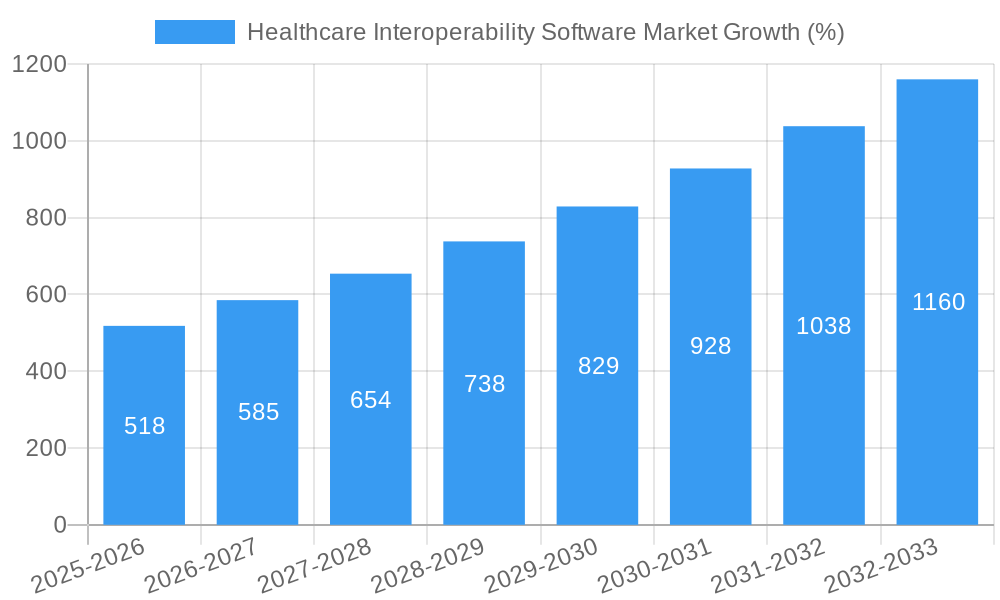
The global Healthcare Interoperability Software market, valued at $4.53 billion in 2025, is projected to experience robust growth, driven by increasing demand for seamless data exchange within the healthcare ecosystem. A compound annual growth rate (CAGR) of 11.31% from 2025 to 2033 indicates a significant expansion, reaching an estimated $12.7 billion by 2033. This growth is fueled by several key factors. The rising adoption of electronic health records (EHRs) and the increasing need for improved patient care coordination necessitate sophisticated interoperability solutions. Government regulations promoting data exchange and interoperability, coupled with the growing prevalence of chronic diseases requiring integrated care management, further contribute to market expansion. Cloud-based solutions are gaining traction due to their scalability, cost-effectiveness, and accessibility, while the foundational, structural, and semantic segments within the software space are experiencing simultaneous growth reflecting the layered approach needed for comprehensive interoperability. Market segmentation reveals strong demand across various end-users, including healthcare providers, payers, and pharmacies. Leading vendors like Allscripts, Cerner, Epic, and IBM are actively shaping the market landscape through technological advancements and strategic partnerships. While the on-premise deployment model still holds a significant share, the shift towards cloud-based solutions is evident, indicating a continuous transformation of the healthcare IT landscape. Geographic expansion shows North America currently leading due to advanced healthcare infrastructure and technology adoption, yet the Asia-Pacific region exhibits high growth potential driven by increasing healthcare investments and digitalization efforts.
The competitive landscape is dynamic, with established players vying for market share through product innovation, acquisitions, and strategic partnerships. Further growth is anticipated from the increasing focus on data analytics and AI integration within interoperability solutions, enabling more insightful and proactive healthcare management. Challenges remain, including data security concerns, integration complexities, and the need for standardization across different healthcare systems. Addressing these challenges through robust security protocols, user-friendly interfaces, and collaborative industry standards will be crucial for sustained market expansion. The market's future hinges on overcoming these obstacles and leveraging emerging technologies to enhance the efficiency and effectiveness of healthcare data exchange.
Healthcare Interoperability Software Market: A Comprehensive Report (2019-2033)
This detailed report provides a comprehensive analysis of the Healthcare Interoperability Software market, offering actionable insights for stakeholders across the healthcare ecosystem. The study period spans 2019-2033, with 2025 serving as the base and estimated year. The forecast period covers 2025-2033, and the historical period encompasses 2019-2024. The market is segmented by level (Foundational, Structural, Semantic), type (Solutions, Services), end-user (Healthcare Providers, Healthcare Payers, Pharmacies), and deployment (Cloud-based, On-premise). Key players analyzed include Allscripts Healthcare LLC, Jitterbit, Oracle Corporation (Cerner Corporation), EPIC Systems Corporation, Orion Health Group Limited, International Business Machines Corporation (IBM), Koninklijke Philips NV, Koch Software Investments (Infor Inc), Virtusa Corporation, and NextGen Healthcare Inc. The report projects a market value of xx Million by 2033, exhibiting a CAGR of xx%.
Healthcare Interoperability Software Market Market Structure & Competitive Dynamics
The Healthcare Interoperability Software market exhibits a moderately consolidated structure, with several large players holding significant market share. Market concentration is influenced by the substantial investments required for research and development, coupled with stringent regulatory requirements. The innovation ecosystem is dynamic, with ongoing advancements in Artificial Intelligence (AI), machine learning, and cloud computing driving the development of sophisticated interoperability solutions. Regulatory frameworks, such as HIPAA in the US and GDPR in Europe, play a crucial role in shaping market dynamics. Product substitutes are limited, primarily encompassing legacy systems and manual processes, which are increasingly being phased out due to their inefficiency and high error rates.
End-user trends are shifting towards cloud-based solutions due to their scalability, cost-effectiveness, and enhanced security features. Mergers and acquisitions (M&A) are frequent, driven by companies seeking to expand their product portfolios, enhance their technological capabilities, and achieve greater market penetration. Recent M&A activity has included deals valued at an estimated xx Million, reflecting a substantial consolidation trend within the industry. For example, the market share of Allscripts Healthcare LLC is estimated at xx%, while Oracle Corporation (Cerner Corporation) holds approximately xx%.
- Market Concentration: Moderately Consolidated
- Innovation Ecosystem: Dynamic, driven by AI and Cloud Computing
- Regulatory Frameworks: HIPAA, GDPR, and other regional regulations
- M&A Activity: Significant, with deals valued at approximately xx Million in recent years.
Healthcare Interoperability Software Market Industry Trends & Insights
The Healthcare Interoperability Software market is experiencing robust growth, propelled by several key factors. The increasing adoption of electronic health records (EHRs) and the growing need for seamless data exchange across different healthcare systems are major drivers. Technological disruptions, such as the rise of blockchain technology and the increasing use of APIs, are further accelerating market expansion. Consumer preferences are shifting towards personalized healthcare experiences, which necessitate efficient data sharing among various healthcare providers and payers. Competitive dynamics are characterized by intense innovation, strategic partnerships, and a focus on delivering cost-effective solutions with improved security features. The market exhibits a projected compound annual growth rate (CAGR) of xx% during the forecast period (2025-2033), with market penetration estimated at xx% by 2033 in developed regions.
Dominant Markets & Segments in Healthcare Interoperability Software Market
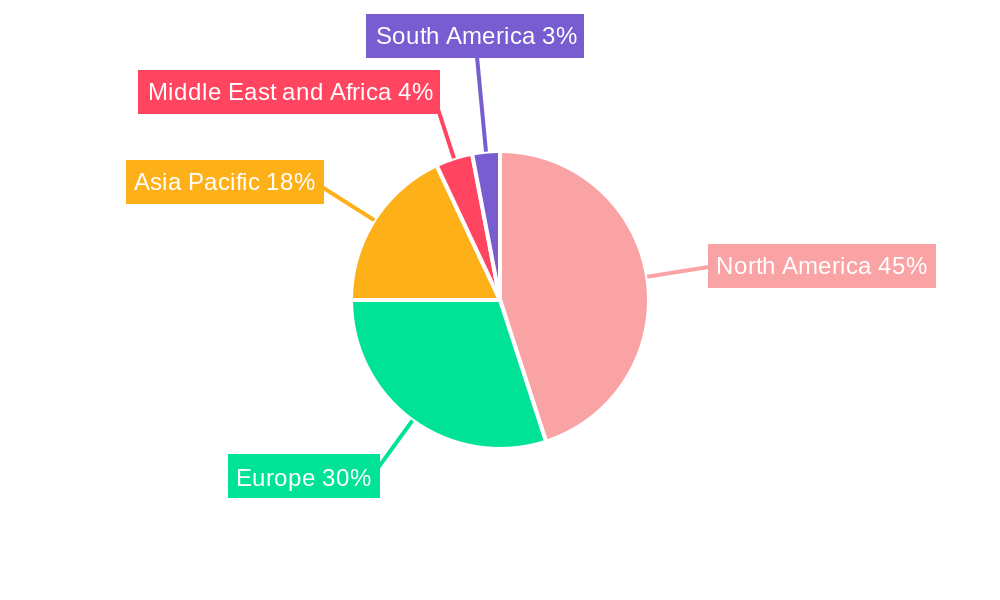
The North American region currently dominates the Healthcare Interoperability Software market, driven by factors such as extensive EHR adoption, favorable regulatory environment, and significant investments in healthcare IT infrastructure. Within this region, the United States holds the largest market share. Among the segments, the demand for cloud-based solutions is significantly high, followed by solutions targeting Healthcare Providers. The Semantic level of interoperability shows the fastest growth, indicating a growing demand for solutions that facilitate comprehensive data interpretation and utilization.
- Key Drivers for North American Dominance:
- High EHR Adoption Rates
- Favorable Regulatory Environment (e.g., HIPAA)
- Significant Investments in Healthcare IT Infrastructure
- Leading Segments:
- Deployment: Cloud-based
- End-User: Healthcare Providers
- Level: Semantic
Healthcare Interoperability Software Market Product Innovations
Recent product innovations focus on enhancing the security and usability of interoperability solutions. This includes advancements in AI-powered data analytics, enabling more efficient data processing and improved decision-making. The incorporation of blockchain technology is also gaining traction, enhancing data integrity and security. These innovations are improving market fit by enabling seamless data exchange while adhering to stringent regulatory requirements.
Report Segmentation & Scope
This report segments the Healthcare Interoperability Software market by level (Foundational, Structural, Semantic), type (Solutions, Services), end-user (Healthcare Providers, Healthcare Payers, Pharmacies), and deployment (Cloud-based, On-premise). Each segment presents unique growth projections and competitive dynamics. For example, the cloud-based segment is projected to experience faster growth compared to the on-premise segment, driven by its cost-effectiveness and scalability. Similarly, the Healthcare Provider segment is expected to dominate, reflecting the increased need for interoperability within provider networks.
Key Drivers of Healthcare Interoperability Software Market Growth
Several factors drive market growth, including the increasing need for efficient patient data exchange, the rise of value-based care models requiring comprehensive data analysis, and government initiatives promoting health information exchange. Technological advancements in AI, machine learning, and cloud computing are further fueling market expansion. Stringent regulatory mandates emphasizing interoperability are also contributing to market growth.
Challenges in the Healthcare Interoperability Software Market Sector
The Healthcare Interoperability Software market faces challenges such as ensuring data security and privacy, integrating legacy systems, and addressing interoperability complexities across different healthcare systems. The high cost of implementation and the need for specialized expertise present barriers to market entry. Moreover, the diverse technological landscape can pose integration challenges, slowing down the pace of adoption.
Leading Players in the Healthcare Interoperability Software Market Market
- Allscripts Healthcare LLC
- Jitterbit
- Oracle Corporation (Cerner Corporation)
- EPIC Systems Corporation
- Orion Health Group Limited
- International Business Machines Corporation (IBM)
- Koninklijke Philips NV
- Koch Software Investments (Infor Inc)
- Virtusa Corporation
- NextGen Healthcare Inc
Key Developments in Healthcare Interoperability Software Market Sector
- January 2022: The Biden administration released a governance framework for nationwide health information exchange, laying the groundwork for improved data sharing.
- March 2022: The eHealth Exchange received a USD 550,000 Innovation Grant to foster advancements in electronic health information exchange.
Strategic Healthcare Interoperability Software Market Market Outlook
The future of the Healthcare Interoperability Software market is bright, driven by the ongoing need for seamless data exchange and the increasing adoption of advanced technologies like AI and blockchain. Strategic opportunities lie in developing innovative solutions that address the challenges of data security, interoperability, and cost-effectiveness. The market is poised for significant growth, particularly in emerging economies with expanding healthcare infrastructure.
Healthcare Interoperability Software Market Segmentation
-
1. Deployment
- 1.1. Cloud-based
- 1.2. On-premise
-
2. Level
- 2.1. Foundational
- 2.2. Structural
- 2.3. Semantic
-
3. Type
-
3.1. Solutions
- 3.1.1. EHR Interoperability
- 3.1.2. HIE Interoperability
- 3.1.3. Other Types
- 3.2. Services
-
3.1. Solutions
-
4. End User
- 4.1. Healthcare Providers
- 4.2. Healthcare Payers
- 4.3. Pharmacies
Healthcare Interoperability Software Market Segmentation By Geography
-
1. North America
- 1.1. United States
- 1.2. Canada
- 1.3. Mexico
-
2. Europe
- 2.1. Germany
- 2.2. United Kingdom
- 2.3. France
- 2.4. Italy
- 2.5. Spain
- 2.6. Rest of Europe
-
3. Asia Pacific
- 3.1. China
- 3.2. Japan
- 3.3. India
- 3.4. Australia
- 3.5. South Korea
- 3.6. Rest of Asia Pacific
-
4. Middle East and Africa
- 4.1. GCC
- 4.2. South Africa
- 4.3. Rest of Middle East and Africa
-
5. South America
- 5.1. Brazil
- 5.2. Argentina
- 5.3. Rest of South America
Healthcare Interoperability Software Market REPORT HIGHLIGHTS
| Aspects | Details |
|---|---|
| Study Period | 2019-2033 |
| Base Year | 2024 |
| Estimated Year | 2025 |
| Forecast Period | 2025-2033 |
| Historical Period | 2019-2024 |
| Growth Rate | CAGR of 11.31% from 2019-2033 |
| Segmentation |
|
Table of Contents
- 1. Introduction
- 1.1. Research Scope
- 1.2. Market Segmentation
- 1.3. Research Methodology
- 1.4. Definitions and Assumptions
- 2. Executive Summary
- 2.1. Introduction
- 3. Market Dynamics
- 3.1. Introduction
- 3.2. Market Drivers
- 3.2.1. Increasing Investment in IT Healthcare Solutions and Healthcare Interoperability; Rising Concerns Over Increasing Healthcare Costs
- 3.3. Market Restrains
- 3.3.1. Shortage of Skilled Healthcare IT Professionals
- 3.4. Market Trends
- 3.4.1. Service Segment is Expected to Hold a Major Market Share in the Healthcare Interoperability Solutions Market Over the Forecast Period
- 4. Market Factor Analysis
- 4.1. Porters Five Forces
- 4.2. Supply/Value Chain
- 4.3. PESTEL analysis
- 4.4. Market Entropy
- 4.5. Patent/Trademark Analysis
- 5. Global Healthcare Interoperability Software Market Analysis, Insights and Forecast, 2019-2031
- 5.1. Market Analysis, Insights and Forecast - by Deployment
- 5.1.1. Cloud-based
- 5.1.2. On-premise
- 5.2. Market Analysis, Insights and Forecast - by Level
- 5.2.1. Foundational
- 5.2.2. Structural
- 5.2.3. Semantic
- 5.3. Market Analysis, Insights and Forecast - by Type
- 5.3.1. Solutions
- 5.3.1.1. EHR Interoperability
- 5.3.1.2. HIE Interoperability
- 5.3.1.3. Other Types
- 5.3.2. Services
- 5.3.1. Solutions
- 5.4. Market Analysis, Insights and Forecast - by End User
- 5.4.1. Healthcare Providers
- 5.4.2. Healthcare Payers
- 5.4.3. Pharmacies
- 5.5. Market Analysis, Insights and Forecast - by Region
- 5.5.1. North America
- 5.5.2. Europe
- 5.5.3. Asia Pacific
- 5.5.4. Middle East and Africa
- 5.5.5. South America
- 5.1. Market Analysis, Insights and Forecast - by Deployment
- 6. North America Healthcare Interoperability Software Market Analysis, Insights and Forecast, 2019-2031
- 6.1. Market Analysis, Insights and Forecast - by Deployment
- 6.1.1. Cloud-based
- 6.1.2. On-premise
- 6.2. Market Analysis, Insights and Forecast - by Level
- 6.2.1. Foundational
- 6.2.2. Structural
- 6.2.3. Semantic
- 6.3. Market Analysis, Insights and Forecast - by Type
- 6.3.1. Solutions
- 6.3.1.1. EHR Interoperability
- 6.3.1.2. HIE Interoperability
- 6.3.1.3. Other Types
- 6.3.2. Services
- 6.3.1. Solutions
- 6.4. Market Analysis, Insights and Forecast - by End User
- 6.4.1. Healthcare Providers
- 6.4.2. Healthcare Payers
- 6.4.3. Pharmacies
- 6.1. Market Analysis, Insights and Forecast - by Deployment
- 7. Europe Healthcare Interoperability Software Market Analysis, Insights and Forecast, 2019-2031
- 7.1. Market Analysis, Insights and Forecast - by Deployment
- 7.1.1. Cloud-based
- 7.1.2. On-premise
- 7.2. Market Analysis, Insights and Forecast - by Level
- 7.2.1. Foundational
- 7.2.2. Structural
- 7.2.3. Semantic
- 7.3. Market Analysis, Insights and Forecast - by Type
- 7.3.1. Solutions
- 7.3.1.1. EHR Interoperability
- 7.3.1.2. HIE Interoperability
- 7.3.1.3. Other Types
- 7.3.2. Services
- 7.3.1. Solutions
- 7.4. Market Analysis, Insights and Forecast - by End User
- 7.4.1. Healthcare Providers
- 7.4.2. Healthcare Payers
- 7.4.3. Pharmacies
- 7.1. Market Analysis, Insights and Forecast - by Deployment
- 8. Asia Pacific Healthcare Interoperability Software Market Analysis, Insights and Forecast, 2019-2031
- 8.1. Market Analysis, Insights and Forecast - by Deployment
- 8.1.1. Cloud-based
- 8.1.2. On-premise
- 8.2. Market Analysis, Insights and Forecast - by Level
- 8.2.1. Foundational
- 8.2.2. Structural
- 8.2.3. Semantic
- 8.3. Market Analysis, Insights and Forecast - by Type
- 8.3.1. Solutions
- 8.3.1.1. EHR Interoperability
- 8.3.1.2. HIE Interoperability
- 8.3.1.3. Other Types
- 8.3.2. Services
- 8.3.1. Solutions
- 8.4. Market Analysis, Insights and Forecast - by End User
- 8.4.1. Healthcare Providers
- 8.4.2. Healthcare Payers
- 8.4.3. Pharmacies
- 8.1. Market Analysis, Insights and Forecast - by Deployment
- 9. Middle East and Africa Healthcare Interoperability Software Market Analysis, Insights and Forecast, 2019-2031
- 9.1. Market Analysis, Insights and Forecast - by Deployment
- 9.1.1. Cloud-based
- 9.1.2. On-premise
- 9.2. Market Analysis, Insights and Forecast - by Level
- 9.2.1. Foundational
- 9.2.2. Structural
- 9.2.3. Semantic
- 9.3. Market Analysis, Insights and Forecast - by Type
- 9.3.1. Solutions
- 9.3.1.1. EHR Interoperability
- 9.3.1.2. HIE Interoperability
- 9.3.1.3. Other Types
- 9.3.2. Services
- 9.3.1. Solutions
- 9.4. Market Analysis, Insights and Forecast - by End User
- 9.4.1. Healthcare Providers
- 9.4.2. Healthcare Payers
- 9.4.3. Pharmacies
- 9.1. Market Analysis, Insights and Forecast - by Deployment
- 10. South America Healthcare Interoperability Software Market Analysis, Insights and Forecast, 2019-2031
- 10.1. Market Analysis, Insights and Forecast - by Deployment
- 10.1.1. Cloud-based
- 10.1.2. On-premise
- 10.2. Market Analysis, Insights and Forecast - by Level
- 10.2.1. Foundational
- 10.2.2. Structural
- 10.2.3. Semantic
- 10.3. Market Analysis, Insights and Forecast - by Type
- 10.3.1. Solutions
- 10.3.1.1. EHR Interoperability
- 10.3.1.2. HIE Interoperability
- 10.3.1.3. Other Types
- 10.3.2. Services
- 10.3.1. Solutions
- 10.4. Market Analysis, Insights and Forecast - by End User
- 10.4.1. Healthcare Providers
- 10.4.2. Healthcare Payers
- 10.4.3. Pharmacies
- 10.1. Market Analysis, Insights and Forecast - by Deployment
- 11. North America Healthcare Interoperability Software Market Analysis, Insights and Forecast, 2019-2031
- 11.1. Market Analysis, Insights and Forecast - By Country/Sub-region
- 11.1.1 United States
- 11.1.2 Canada
- 11.1.3 Mexico
- 12. Europe Healthcare Interoperability Software Market Analysis, Insights and Forecast, 2019-2031
- 12.1. Market Analysis, Insights and Forecast - By Country/Sub-region
- 12.1.1 Germany
- 12.1.2 United Kingdom
- 12.1.3 France
- 12.1.4 Italy
- 12.1.5 Spain
- 12.1.6 Rest of Europe
- 13. Asia Pacific Healthcare Interoperability Software Market Analysis, Insights and Forecast, 2019-2031
- 13.1. Market Analysis, Insights and Forecast - By Country/Sub-region
- 13.1.1 China
- 13.1.2 Japan
- 13.1.3 India
- 13.1.4 Australia
- 13.1.5 South Korea
- 13.1.6 Rest of Asia Pacific
- 14. Middle East and Africa Healthcare Interoperability Software Market Analysis, Insights and Forecast, 2019-2031
- 14.1. Market Analysis, Insights and Forecast - By Country/Sub-region
- 14.1.1 GCC
- 14.1.2 South Africa
- 14.1.3 Rest of Middle East and Africa
- 15. South America Healthcare Interoperability Software Market Analysis, Insights and Forecast, 2019-2031
- 15.1. Market Analysis, Insights and Forecast - By Country/Sub-region
- 15.1.1 Brazil
- 15.1.2 Argentina
- 15.1.3 Rest of South America
- 16. Competitive Analysis
- 16.1. Global Market Share Analysis 2024
- 16.2. Company Profiles
- 16.2.1 Allscripts Healthcare LLC
- 16.2.1.1. Overview
- 16.2.1.2. Products
- 16.2.1.3. SWOT Analysis
- 16.2.1.4. Recent Developments
- 16.2.1.5. Financials (Based on Availability)
- 16.2.2 Jitterbit
- 16.2.2.1. Overview
- 16.2.2.2. Products
- 16.2.2.3. SWOT Analysis
- 16.2.2.4. Recent Developments
- 16.2.2.5. Financials (Based on Availability)
- 16.2.3 Oracle Corporation (Cerner Corporation)
- 16.2.3.1. Overview
- 16.2.3.2. Products
- 16.2.3.3. SWOT Analysis
- 16.2.3.4. Recent Developments
- 16.2.3.5. Financials (Based on Availability)
- 16.2.4 EPIC Systems Corporation
- 16.2.4.1. Overview
- 16.2.4.2. Products
- 16.2.4.3. SWOT Analysis
- 16.2.4.4. Recent Developments
- 16.2.4.5. Financials (Based on Availability)
- 16.2.5 Orion Health Group Limited
- 16.2.5.1. Overview
- 16.2.5.2. Products
- 16.2.5.3. SWOT Analysis
- 16.2.5.4. Recent Developments
- 16.2.5.5. Financials (Based on Availability)
- 16.2.6 International Business Machines Corporation (IBM)
- 16.2.6.1. Overview
- 16.2.6.2. Products
- 16.2.6.3. SWOT Analysis
- 16.2.6.4. Recent Developments
- 16.2.6.5. Financials (Based on Availability)
- 16.2.7 Koninklijke Philips NV
- 16.2.7.1. Overview
- 16.2.7.2. Products
- 16.2.7.3. SWOT Analysis
- 16.2.7.4. Recent Developments
- 16.2.7.5. Financials (Based on Availability)
- 16.2.8 Koch Software Investments (Infor Inc)
- 16.2.8.1. Overview
- 16.2.8.2. Products
- 16.2.8.3. SWOT Analysis
- 16.2.8.4. Recent Developments
- 16.2.8.5. Financials (Based on Availability)
- 16.2.9 Virtusa Corpopration
- 16.2.9.1. Overview
- 16.2.9.2. Products
- 16.2.9.3. SWOT Analysis
- 16.2.9.4. Recent Developments
- 16.2.9.5. Financials (Based on Availability)
- 16.2.10 NextGen Healthcare Inc
- 16.2.10.1. Overview
- 16.2.10.2. Products
- 16.2.10.3. SWOT Analysis
- 16.2.10.4. Recent Developments
- 16.2.10.5. Financials (Based on Availability)
- 16.2.1 Allscripts Healthcare LLC
List of Figures
- Figure 1: Global Healthcare Interoperability Software Market Revenue Breakdown (Million, %) by Region 2024 & 2032
- Figure 2: North America Healthcare Interoperability Software Market Revenue (Million), by Country 2024 & 2032
- Figure 3: North America Healthcare Interoperability Software Market Revenue Share (%), by Country 2024 & 2032
- Figure 4: Europe Healthcare Interoperability Software Market Revenue (Million), by Country 2024 & 2032
- Figure 5: Europe Healthcare Interoperability Software Market Revenue Share (%), by Country 2024 & 2032
- Figure 6: Asia Pacific Healthcare Interoperability Software Market Revenue (Million), by Country 2024 & 2032
- Figure 7: Asia Pacific Healthcare Interoperability Software Market Revenue Share (%), by Country 2024 & 2032
- Figure 8: Middle East and Africa Healthcare Interoperability Software Market Revenue (Million), by Country 2024 & 2032
- Figure 9: Middle East and Africa Healthcare Interoperability Software Market Revenue Share (%), by Country 2024 & 2032
- Figure 10: South America Healthcare Interoperability Software Market Revenue (Million), by Country 2024 & 2032
- Figure 11: South America Healthcare Interoperability Software Market Revenue Share (%), by Country 2024 & 2032
- Figure 12: North America Healthcare Interoperability Software Market Revenue (Million), by Deployment 2024 & 2032
- Figure 13: North America Healthcare Interoperability Software Market Revenue Share (%), by Deployment 2024 & 2032
- Figure 14: North America Healthcare Interoperability Software Market Revenue (Million), by Level 2024 & 2032
- Figure 15: North America Healthcare Interoperability Software Market Revenue Share (%), by Level 2024 & 2032
- Figure 16: North America Healthcare Interoperability Software Market Revenue (Million), by Type 2024 & 2032
- Figure 17: North America Healthcare Interoperability Software Market Revenue Share (%), by Type 2024 & 2032
- Figure 18: North America Healthcare Interoperability Software Market Revenue (Million), by End User 2024 & 2032
- Figure 19: North America Healthcare Interoperability Software Market Revenue Share (%), by End User 2024 & 2032
- Figure 20: North America Healthcare Interoperability Software Market Revenue (Million), by Country 2024 & 2032
- Figure 21: North America Healthcare Interoperability Software Market Revenue Share (%), by Country 2024 & 2032
- Figure 22: Europe Healthcare Interoperability Software Market Revenue (Million), by Deployment 2024 & 2032
- Figure 23: Europe Healthcare Interoperability Software Market Revenue Share (%), by Deployment 2024 & 2032
- Figure 24: Europe Healthcare Interoperability Software Market Revenue (Million), by Level 2024 & 2032
- Figure 25: Europe Healthcare Interoperability Software Market Revenue Share (%), by Level 2024 & 2032
- Figure 26: Europe Healthcare Interoperability Software Market Revenue (Million), by Type 2024 & 2032
- Figure 27: Europe Healthcare Interoperability Software Market Revenue Share (%), by Type 2024 & 2032
- Figure 28: Europe Healthcare Interoperability Software Market Revenue (Million), by End User 2024 & 2032
- Figure 29: Europe Healthcare Interoperability Software Market Revenue Share (%), by End User 2024 & 2032
- Figure 30: Europe Healthcare Interoperability Software Market Revenue (Million), by Country 2024 & 2032
- Figure 31: Europe Healthcare Interoperability Software Market Revenue Share (%), by Country 2024 & 2032
- Figure 32: Asia Pacific Healthcare Interoperability Software Market Revenue (Million), by Deployment 2024 & 2032
- Figure 33: Asia Pacific Healthcare Interoperability Software Market Revenue Share (%), by Deployment 2024 & 2032
- Figure 34: Asia Pacific Healthcare Interoperability Software Market Revenue (Million), by Level 2024 & 2032
- Figure 35: Asia Pacific Healthcare Interoperability Software Market Revenue Share (%), by Level 2024 & 2032
- Figure 36: Asia Pacific Healthcare Interoperability Software Market Revenue (Million), by Type 2024 & 2032
- Figure 37: Asia Pacific Healthcare Interoperability Software Market Revenue Share (%), by Type 2024 & 2032
- Figure 38: Asia Pacific Healthcare Interoperability Software Market Revenue (Million), by End User 2024 & 2032
- Figure 39: Asia Pacific Healthcare Interoperability Software Market Revenue Share (%), by End User 2024 & 2032
- Figure 40: Asia Pacific Healthcare Interoperability Software Market Revenue (Million), by Country 2024 & 2032
- Figure 41: Asia Pacific Healthcare Interoperability Software Market Revenue Share (%), by Country 2024 & 2032
- Figure 42: Middle East and Africa Healthcare Interoperability Software Market Revenue (Million), by Deployment 2024 & 2032
- Figure 43: Middle East and Africa Healthcare Interoperability Software Market Revenue Share (%), by Deployment 2024 & 2032
- Figure 44: Middle East and Africa Healthcare Interoperability Software Market Revenue (Million), by Level 2024 & 2032
- Figure 45: Middle East and Africa Healthcare Interoperability Software Market Revenue Share (%), by Level 2024 & 2032
- Figure 46: Middle East and Africa Healthcare Interoperability Software Market Revenue (Million), by Type 2024 & 2032
- Figure 47: Middle East and Africa Healthcare Interoperability Software Market Revenue Share (%), by Type 2024 & 2032
- Figure 48: Middle East and Africa Healthcare Interoperability Software Market Revenue (Million), by End User 2024 & 2032
- Figure 49: Middle East and Africa Healthcare Interoperability Software Market Revenue Share (%), by End User 2024 & 2032
- Figure 50: Middle East and Africa Healthcare Interoperability Software Market Revenue (Million), by Country 2024 & 2032
- Figure 51: Middle East and Africa Healthcare Interoperability Software Market Revenue Share (%), by Country 2024 & 2032
- Figure 52: South America Healthcare Interoperability Software Market Revenue (Million), by Deployment 2024 & 2032
- Figure 53: South America Healthcare Interoperability Software Market Revenue Share (%), by Deployment 2024 & 2032
- Figure 54: South America Healthcare Interoperability Software Market Revenue (Million), by Level 2024 & 2032
- Figure 55: South America Healthcare Interoperability Software Market Revenue Share (%), by Level 2024 & 2032
- Figure 56: South America Healthcare Interoperability Software Market Revenue (Million), by Type 2024 & 2032
- Figure 57: South America Healthcare Interoperability Software Market Revenue Share (%), by Type 2024 & 2032
- Figure 58: South America Healthcare Interoperability Software Market Revenue (Million), by End User 2024 & 2032
- Figure 59: South America Healthcare Interoperability Software Market Revenue Share (%), by End User 2024 & 2032
- Figure 60: South America Healthcare Interoperability Software Market Revenue (Million), by Country 2024 & 2032
- Figure 61: South America Healthcare Interoperability Software Market Revenue Share (%), by Country 2024 & 2032
List of Tables
- Table 1: Global Healthcare Interoperability Software Market Revenue Million Forecast, by Region 2019 & 2032
- Table 2: Global Healthcare Interoperability Software Market Revenue Million Forecast, by Deployment 2019 & 2032
- Table 3: Global Healthcare Interoperability Software Market Revenue Million Forecast, by Level 2019 & 2032
- Table 4: Global Healthcare Interoperability Software Market Revenue Million Forecast, by Type 2019 & 2032
- Table 5: Global Healthcare Interoperability Software Market Revenue Million Forecast, by End User 2019 & 2032
- Table 6: Global Healthcare Interoperability Software Market Revenue Million Forecast, by Region 2019 & 2032
- Table 7: Global Healthcare Interoperability Software Market Revenue Million Forecast, by Country 2019 & 2032
- Table 8: United States Healthcare Interoperability Software Market Revenue (Million) Forecast, by Application 2019 & 2032
- Table 9: Canada Healthcare Interoperability Software Market Revenue (Million) Forecast, by Application 2019 & 2032
- Table 10: Mexico Healthcare Interoperability Software Market Revenue (Million) Forecast, by Application 2019 & 2032
- Table 11: Global Healthcare Interoperability Software Market Revenue Million Forecast, by Country 2019 & 2032
- Table 12: Germany Healthcare Interoperability Software Market Revenue (Million) Forecast, by Application 2019 & 2032
- Table 13: United Kingdom Healthcare Interoperability Software Market Revenue (Million) Forecast, by Application 2019 & 2032
- Table 14: France Healthcare Interoperability Software Market Revenue (Million) Forecast, by Application 2019 & 2032
- Table 15: Italy Healthcare Interoperability Software Market Revenue (Million) Forecast, by Application 2019 & 2032
- Table 16: Spain Healthcare Interoperability Software Market Revenue (Million) Forecast, by Application 2019 & 2032
- Table 17: Rest of Europe Healthcare Interoperability Software Market Revenue (Million) Forecast, by Application 2019 & 2032
- Table 18: Global Healthcare Interoperability Software Market Revenue Million Forecast, by Country 2019 & 2032
- Table 19: China Healthcare Interoperability Software Market Revenue (Million) Forecast, by Application 2019 & 2032
- Table 20: Japan Healthcare Interoperability Software Market Revenue (Million) Forecast, by Application 2019 & 2032
- Table 21: India Healthcare Interoperability Software Market Revenue (Million) Forecast, by Application 2019 & 2032
- Table 22: Australia Healthcare Interoperability Software Market Revenue (Million) Forecast, by Application 2019 & 2032
- Table 23: South Korea Healthcare Interoperability Software Market Revenue (Million) Forecast, by Application 2019 & 2032
- Table 24: Rest of Asia Pacific Healthcare Interoperability Software Market Revenue (Million) Forecast, by Application 2019 & 2032
- Table 25: Global Healthcare Interoperability Software Market Revenue Million Forecast, by Country 2019 & 2032
- Table 26: GCC Healthcare Interoperability Software Market Revenue (Million) Forecast, by Application 2019 & 2032
- Table 27: South Africa Healthcare Interoperability Software Market Revenue (Million) Forecast, by Application 2019 & 2032
- Table 28: Rest of Middle East and Africa Healthcare Interoperability Software Market Revenue (Million) Forecast, by Application 2019 & 2032
- Table 29: Global Healthcare Interoperability Software Market Revenue Million Forecast, by Country 2019 & 2032
- Table 30: Brazil Healthcare Interoperability Software Market Revenue (Million) Forecast, by Application 2019 & 2032
- Table 31: Argentina Healthcare Interoperability Software Market Revenue (Million) Forecast, by Application 2019 & 2032
- Table 32: Rest of South America Healthcare Interoperability Software Market Revenue (Million) Forecast, by Application 2019 & 2032
- Table 33: Global Healthcare Interoperability Software Market Revenue Million Forecast, by Deployment 2019 & 2032
- Table 34: Global Healthcare Interoperability Software Market Revenue Million Forecast, by Level 2019 & 2032
- Table 35: Global Healthcare Interoperability Software Market Revenue Million Forecast, by Type 2019 & 2032
- Table 36: Global Healthcare Interoperability Software Market Revenue Million Forecast, by End User 2019 & 2032
- Table 37: Global Healthcare Interoperability Software Market Revenue Million Forecast, by Country 2019 & 2032
- Table 38: United States Healthcare Interoperability Software Market Revenue (Million) Forecast, by Application 2019 & 2032
- Table 39: Canada Healthcare Interoperability Software Market Revenue (Million) Forecast, by Application 2019 & 2032
- Table 40: Mexico Healthcare Interoperability Software Market Revenue (Million) Forecast, by Application 2019 & 2032
- Table 41: Global Healthcare Interoperability Software Market Revenue Million Forecast, by Deployment 2019 & 2032
- Table 42: Global Healthcare Interoperability Software Market Revenue Million Forecast, by Level 2019 & 2032
- Table 43: Global Healthcare Interoperability Software Market Revenue Million Forecast, by Type 2019 & 2032
- Table 44: Global Healthcare Interoperability Software Market Revenue Million Forecast, by End User 2019 & 2032
- Table 45: Global Healthcare Interoperability Software Market Revenue Million Forecast, by Country 2019 & 2032
- Table 46: Germany Healthcare Interoperability Software Market Revenue (Million) Forecast, by Application 2019 & 2032
- Table 47: United Kingdom Healthcare Interoperability Software Market Revenue (Million) Forecast, by Application 2019 & 2032
- Table 48: France Healthcare Interoperability Software Market Revenue (Million) Forecast, by Application 2019 & 2032
- Table 49: Italy Healthcare Interoperability Software Market Revenue (Million) Forecast, by Application 2019 & 2032
- Table 50: Spain Healthcare Interoperability Software Market Revenue (Million) Forecast, by Application 2019 & 2032
- Table 51: Rest of Europe Healthcare Interoperability Software Market Revenue (Million) Forecast, by Application 2019 & 2032
- Table 52: Global Healthcare Interoperability Software Market Revenue Million Forecast, by Deployment 2019 & 2032
- Table 53: Global Healthcare Interoperability Software Market Revenue Million Forecast, by Level 2019 & 2032
- Table 54: Global Healthcare Interoperability Software Market Revenue Million Forecast, by Type 2019 & 2032
- Table 55: Global Healthcare Interoperability Software Market Revenue Million Forecast, by End User 2019 & 2032
- Table 56: Global Healthcare Interoperability Software Market Revenue Million Forecast, by Country 2019 & 2032
- Table 57: China Healthcare Interoperability Software Market Revenue (Million) Forecast, by Application 2019 & 2032
- Table 58: Japan Healthcare Interoperability Software Market Revenue (Million) Forecast, by Application 2019 & 2032
- Table 59: India Healthcare Interoperability Software Market Revenue (Million) Forecast, by Application 2019 & 2032
- Table 60: Australia Healthcare Interoperability Software Market Revenue (Million) Forecast, by Application 2019 & 2032
- Table 61: South Korea Healthcare Interoperability Software Market Revenue (Million) Forecast, by Application 2019 & 2032
- Table 62: Rest of Asia Pacific Healthcare Interoperability Software Market Revenue (Million) Forecast, by Application 2019 & 2032
- Table 63: Global Healthcare Interoperability Software Market Revenue Million Forecast, by Deployment 2019 & 2032
- Table 64: Global Healthcare Interoperability Software Market Revenue Million Forecast, by Level 2019 & 2032
- Table 65: Global Healthcare Interoperability Software Market Revenue Million Forecast, by Type 2019 & 2032
- Table 66: Global Healthcare Interoperability Software Market Revenue Million Forecast, by End User 2019 & 2032
- Table 67: Global Healthcare Interoperability Software Market Revenue Million Forecast, by Country 2019 & 2032
- Table 68: GCC Healthcare Interoperability Software Market Revenue (Million) Forecast, by Application 2019 & 2032
- Table 69: South Africa Healthcare Interoperability Software Market Revenue (Million) Forecast, by Application 2019 & 2032
- Table 70: Rest of Middle East and Africa Healthcare Interoperability Software Market Revenue (Million) Forecast, by Application 2019 & 2032
- Table 71: Global Healthcare Interoperability Software Market Revenue Million Forecast, by Deployment 2019 & 2032
- Table 72: Global Healthcare Interoperability Software Market Revenue Million Forecast, by Level 2019 & 2032
- Table 73: Global Healthcare Interoperability Software Market Revenue Million Forecast, by Type 2019 & 2032
- Table 74: Global Healthcare Interoperability Software Market Revenue Million Forecast, by End User 2019 & 2032
- Table 75: Global Healthcare Interoperability Software Market Revenue Million Forecast, by Country 2019 & 2032
- Table 76: Brazil Healthcare Interoperability Software Market Revenue (Million) Forecast, by Application 2019 & 2032
- Table 77: Argentina Healthcare Interoperability Software Market Revenue (Million) Forecast, by Application 2019 & 2032
- Table 78: Rest of South America Healthcare Interoperability Software Market Revenue (Million) Forecast, by Application 2019 & 2032
Frequently Asked Questions
1. What is the projected Compound Annual Growth Rate (CAGR) of the Healthcare Interoperability Software Market?
The projected CAGR is approximately 11.31%.
2. Which companies are prominent players in the Healthcare Interoperability Software Market?
Key companies in the market include Allscripts Healthcare LLC, Jitterbit, Oracle Corporation (Cerner Corporation), EPIC Systems Corporation, Orion Health Group Limited, International Business Machines Corporation (IBM), Koninklijke Philips NV, Koch Software Investments (Infor Inc), Virtusa Corpopration, NextGen Healthcare Inc.
3. What are the main segments of the Healthcare Interoperability Software Market?
The market segments include Deployment, Level, Type, End User.
4. Can you provide details about the market size?
The market size is estimated to be USD 4.53 Million as of 2022.
5. What are some drivers contributing to market growth?
Increasing Investment in IT Healthcare Solutions and Healthcare Interoperability; Rising Concerns Over Increasing Healthcare Costs.
6. What are the notable trends driving market growth?
Service Segment is Expected to Hold a Major Market Share in the Healthcare Interoperability Solutions Market Over the Forecast Period.
7. Are there any restraints impacting market growth?
Shortage of Skilled Healthcare IT Professionals.
8. Can you provide examples of recent developments in the market?
In March 2022, eHealth Exchange, the non-profit health information network that connects providers and federal agencies, received a new Innovation Grant program of USD 550,000 to help catalyze new and innovative ways to boost electronic health information exchange or build new technical connectivity tools.
9. What pricing options are available for accessing the report?
Pricing options include single-user, multi-user, and enterprise licenses priced at USD 4750, USD 5250, and USD 8750 respectively.
10. Is the market size provided in terms of value or volume?
The market size is provided in terms of value, measured in Million.
11. Are there any specific market keywords associated with the report?
Yes, the market keyword associated with the report is "Healthcare Interoperability Software Market," which aids in identifying and referencing the specific market segment covered.
12. How do I determine which pricing option suits my needs best?
The pricing options vary based on user requirements and access needs. Individual users may opt for single-user licenses, while businesses requiring broader access may choose multi-user or enterprise licenses for cost-effective access to the report.
13. Are there any additional resources or data provided in the Healthcare Interoperability Software Market report?
While the report offers comprehensive insights, it's advisable to review the specific contents or supplementary materials provided to ascertain if additional resources or data are available.
14. How can I stay updated on further developments or reports in the Healthcare Interoperability Software Market?
To stay informed about further developments, trends, and reports in the Healthcare Interoperability Software Market, consider subscribing to industry newsletters, following relevant companies and organizations, or regularly checking reputable industry news sources and publications.
Methodology
Step 1 - Identification of Relevant Samples Size from Population Database


Step 2 - Approaches for Defining Global Market Size (Value, Volume* & Price*)

Note*: In applicable scenarios
Step 3 - Data Sources
Primary Research
- Web Analytics
- Survey Reports
- Research Institute
- Latest Research Reports
- Opinion Leaders
Secondary Research
- Annual Reports
- White Paper
- Latest Press Release
- Industry Association
- Paid Database
- Investor Presentations

Step 4 - Data Triangulation
Involves using different sources of information in order to increase the validity of a study
These sources are likely to be stakeholders in a program - participants, other researchers, program staff, other community members, and so on.
Then we put all data in single framework & apply various statistical tools to find out the dynamic on the market.
During the analysis stage, feedback from the stakeholder groups would be compared to determine areas of agreement as well as areas of divergence


