
Key Insights
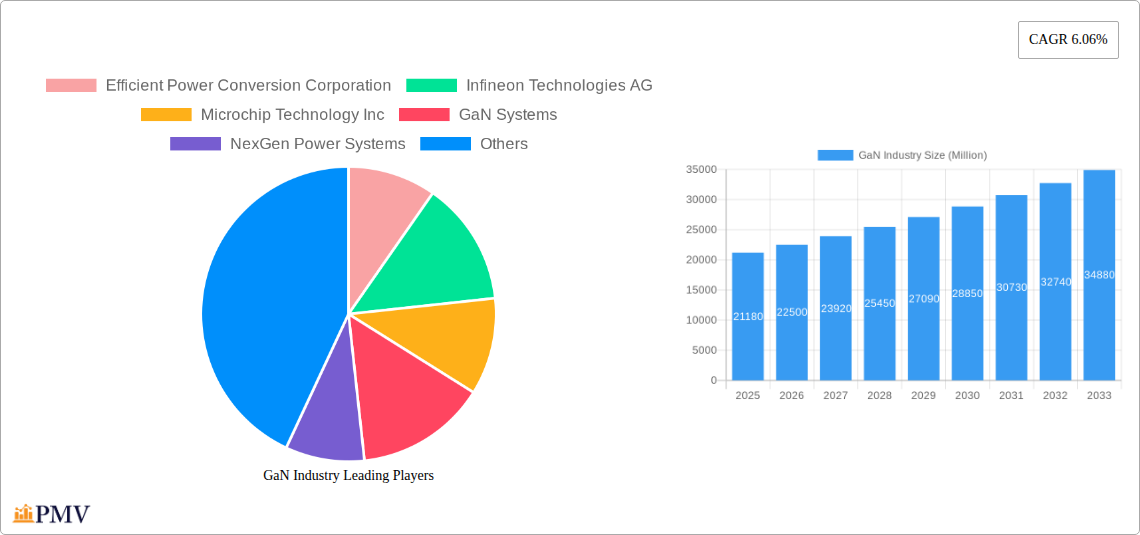
The GaN (Gallium Nitride) semiconductor market is experiencing robust growth, driven by its superior performance characteristics compared to traditional silicon-based semiconductors. Its wide bandgap allows for higher power density, improved efficiency, and faster switching speeds, making it ideal for applications demanding high performance and energy efficiency. The market, valued at $21.18 billion in 2025, is projected to maintain a Compound Annual Growth Rate (CAGR) of 6.06% from 2025 to 2033. This growth is fueled by several key factors. Firstly, the increasing demand for energy-efficient electronics in various sectors, including automotive, consumer electronics, and renewable energy, is driving adoption. Electric vehicles (EVs), with their need for efficient power inverters and chargers, represent a significant market opportunity. The advancements in GaN technology, leading to reduced costs and improved reliability, further contribute to the market expansion. Furthermore, the increasing adoption of 5G infrastructure and data centers, both demanding high-frequency and high-power applications, is also fueling growth.
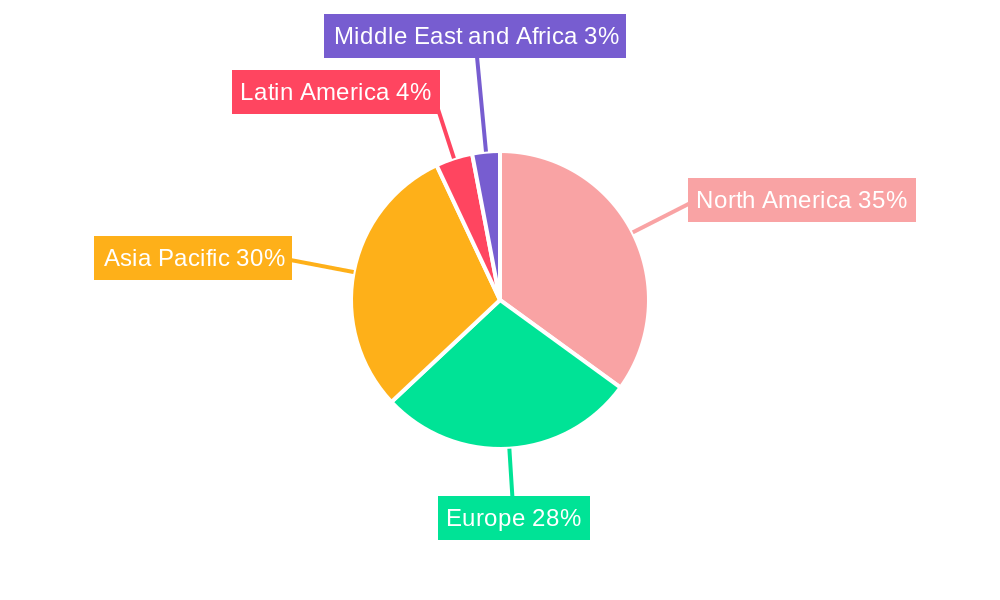
Market segmentation reveals the dominance of power semiconductors within the GaN landscape, followed by opto-semiconductors and RF semiconductors. Transistors are the most widely used GaN devices, though power ICs are gaining traction due to their integrated functionality and reduced design complexity. The automotive sector currently leads the end-user industry segment, but significant growth is anticipated in consumer electronics, particularly in fast chargers and power adapters for smartphones and laptops. The competitive landscape includes established players like Infineon Technologies, Microchip Technology, and Texas Instruments, alongside emerging companies specializing in GaN technology, fostering innovation and competition. While challenges remain in terms of cost and manufacturing scalability, ongoing technological advancements and increasing demand are expected to overcome these hurdles and further propel the GaN market's growth trajectory towards significant expansion in the coming years. Geographic distribution shows strong growth across North America, Europe and Asia Pacific, reflective of the global adoption of GaN technologies.
GaN Industry Market Report: 2019-2033
This comprehensive report provides an in-depth analysis of the GaN (Gallium Nitride) industry, offering crucial insights into market dynamics, competitive landscapes, and future growth prospects. Covering the period 2019-2033, with a base year of 2025 and forecast period of 2025-2033, this report is an essential resource for industry stakeholders, investors, and researchers seeking a clear understanding of this rapidly evolving sector. The total market size is estimated at xx Million in 2025, with a projected CAGR of xx% during the forecast period.
GaN Industry Market Structure & Competitive Dynamics
The GaN industry exhibits a moderately concentrated market structure, with several key players dominating various segments. Market share is currently distributed amongst a mix of established semiconductor companies and emerging GaN specialists. The competitive landscape is characterized by intense R&D efforts, strategic partnerships, and acquisitions. Innovation ecosystems are developing rapidly, driven by advancements in materials science, device fabrication, and packaging technologies. Regulatory frameworks vary across regions, influencing market access and product standards. While silicon-based power semiconductors remain prominent, GaN's superior efficiency is driving market penetration, leading to increased substitution. End-user trends favor higher power density, efficiency, and reduced size, all advantages offered by GaN.
- Market Concentration: Moderately concentrated, with top 5 players holding approximately xx% of the market share in 2025.
- M&A Activity: Significant M&A activity observed in recent years, with deal values exceeding xx Million in the past five years. These acquisitions primarily focused on acquiring technology and expanding market access.
- Innovation Ecosystems: Collaboration between research institutions, semiconductor manufacturers, and end-users is accelerating GaN technology development.
- Regulatory Frameworks: Regional variations in regulations impact market entry and product certifications.
GaN Industry Industry Trends & Insights
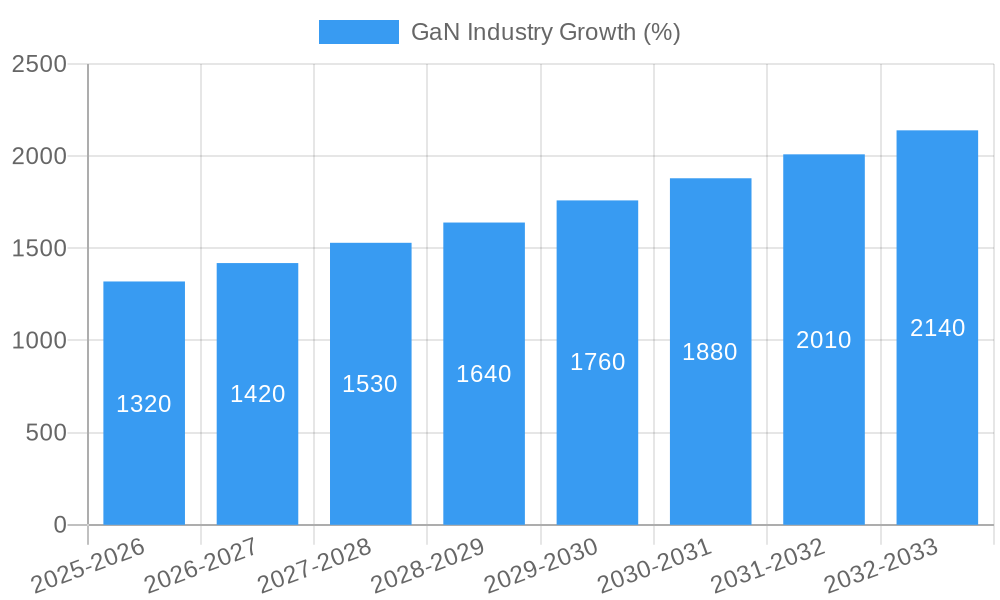
The GaN industry is experiencing robust growth driven by several factors. The increasing demand for energy-efficient solutions across diverse applications is a key driver, boosting adoption in areas like electric vehicles, renewable energy, and data centers. Technological advancements, such as improvements in material quality and device performance, are further accelerating market expansion. Consumer preference for smaller, lighter, and more efficient electronic devices fuels the demand for GaN-based components. The competitive landscape is dynamic, with continuous innovation in device architectures, packaging, and applications creating significant opportunities. Market penetration of GaN devices continues to grow at a significant pace, driven by cost reductions and improved performance. The CAGR for the GaN market is projected at xx% from 2025 to 2033. This growth is being fueled by technological advancements in GaN materials and device structures, leading to improved performance and reduced costs. Further driving this growth is the increasing demand for power-efficient solutions in consumer electronics, data centers, electric vehicles, and renewable energy systems.
Dominant Markets & Segments in GaN Industry
The automotive sector is currently the leading end-user industry for GaN devices, followed closely by consumer electronics and the information and communication technology (ICT) sector. Geographically, North America and Asia-Pacific regions represent the largest markets. The power semiconductors segment currently holds the largest market share by type. Within devices, transistors dominate, followed by power ICs.
- Key Drivers in Automotive Sector: Stringent emission regulations, increasing demand for electric vehicles, and the need for efficient power management systems.
- Key Drivers in Consumer Electronics: Demand for compact, energy-efficient chargers, power adapters, and other consumer electronics.
- Key Drivers in ICT: Data center infrastructure expansion requiring higher power density and energy efficiency.
Regional dominance is attributed to established manufacturing bases, strong R&D investments, and favorable government policies. Specific country-level data will show the variances in market share.
GaN Industry Product Innovations
Recent innovations have focused on enhancing the performance and reliability of GaN devices. Advancements in material growth techniques, device architectures, and packaging technologies have led to higher power density, improved efficiency, and reduced switching losses. These improvements directly translate to smaller, lighter, and more efficient power supplies, meeting market demands for miniaturization and energy savings. New applications are constantly emerging, expanding the market reach of GaN technology.
Report Segmentation & Scope
This report segments the GaN market by type (Power Semiconductors, Opto-Semiconductors, RF Semiconductors), by device (Transistors, Diodes, Rectifiers, Power ICs), and by end-user industry (Automotive, Consumer Electronics, Aerospace and Defense, Medical, Information Communication and Technology, Other End-user Industries). Each segment's growth projections, market sizes, and competitive dynamics are analyzed separately. The report provides a detailed outlook for each segment, highlighting key growth drivers, challenges, and future opportunities.
Key Drivers of GaN Industry Growth
The GaN industry's growth is propelled by several key factors: the increasing demand for energy-efficient power electronics driven by global initiatives for energy conservation, advancements in GaN technology that lead to improved device performance and reduced costs, and supportive government policies and investments aimed at promoting the adoption of energy-efficient technologies across multiple sectors. These factors converge to create substantial market potential for GaN-based solutions.
Challenges in the GaN Industry Sector
Despite significant growth potential, challenges remain. These include the relatively high cost of GaN devices compared to silicon-based alternatives, the need for further improvement in device reliability and long-term stability, and the complexities of integrating GaN into existing systems. Supply chain constraints and competition from established silicon-based technologies also pose challenges. The overall impact of these factors on market growth is being carefully managed through technological advancements and strategic partnerships.
Leading Players in the GaN Industry Market
- Efficient Power Conversion Corporation
- Infineon Technologies AG (Infineon Technologies AG)
- Microchip Technology Inc (Microchip Technology Inc)
- GaN Systems (GaN Systems)
- NexGen Power Systems
- NXP Semiconductors (NXP Semiconductors)
- Wolfspeed Inc (Wolfspeed Inc)
- Toshiba Electronic Devices & Storage Corporation (Toshiba Electronic Devices & Storage Corporation)
- Soitec (Soitec)
- Qorvo Inc (Qorvo Inc)
- Texas Instruments Incorporated (Texas Instruments Incorporated)
- NTT Advanced Technology Corporation
Key Developments in GaN Industry Sector
- July 2023: STMicroelectronics launched large-scale manufacturing of e-mode PowerGaN HEMT devices.
- January 2024: Silvaco Group partnered with GaN Valley to advance GaN power device design using its Victory TCAD platform.
These developments significantly impact market dynamics by accelerating product innovation and increasing manufacturing capacity.
Strategic GaN Industry Market Outlook
The GaN industry is poised for sustained growth, driven by technological advancements, expanding applications, and favorable market conditions. Strategic opportunities exist in developing high-performance, cost-effective GaN devices, exploring new applications, and establishing robust supply chains. The focus on improving device reliability, reducing costs, and expanding manufacturing capacity will be crucial for realizing the full market potential of GaN technology in the coming years. The report concludes with recommendations and strategies for industry participants to capitalize on emerging opportunities and navigate potential challenges within this dynamic sector.
GaN Industry Segmentation
-
1. Type
- 1.1. Power Semiconductors
- 1.2. Opto-Semiconductors
- 1.3. RF Semiconductors
-
2. Devices
- 2.1. Transistors
- 2.2. Diodes
- 2.3. Rectifiers
- 2.4. Power ICs
-
3. End-user Industry
- 3.1. Automotive
- 3.2. Consumer Electronics
- 3.3. Aerospace and Defense
- 3.4. Medical
- 3.5. Information Communication and Technology
- 3.6. Other End-user Industries
GaN Industry Segmentation By Geography
- 1. United States
- 2. Europe
- 3. Japan
- 4. China
- 5. Korea
- 6. Taiwan
- 7. Latin America
- 8. Middle East and Africa
GaN Industry REPORT HIGHLIGHTS
| Aspects | Details |
|---|---|
| Study Period | 2019-2033 |
| Base Year | 2024 |
| Estimated Year | 2025 |
| Forecast Period | 2025-2033 |
| Historical Period | 2019-2024 |
| Growth Rate | CAGR of 6.06% from 2019-2033 |
| Segmentation |
|
Table of Contents
- 1. Introduction
- 1.1. Research Scope
- 1.2. Market Segmentation
- 1.3. Research Methodology
- 1.4. Definitions and Assumptions
- 2. Executive Summary
- 2.1. Introduction
- 3. Market Dynamics
- 3.1. Introduction
- 3.2. Market Drivers
- 3.2.1. Strong Demand from Telecom Infrastructure Segment Driven by Advancements in 5G Implementation; Favorable Attributes Such As High-performance and Small Form Factor to Drive Adoption in the Military Segment
- 3.3. Market Restrains
- 3.3.1. ; Declining Volume of Traditional Mails; High Adoption Costs
- 3.4. Market Trends
- 3.4.1. Consumer Electronics to Hold Significant Market Share
- 4. Market Factor Analysis
- 4.1. Porters Five Forces
- 4.2. Supply/Value Chain
- 4.3. PESTEL analysis
- 4.4. Market Entropy
- 4.5. Patent/Trademark Analysis
- 5. Global GaN Industry Analysis, Insights and Forecast, 2019-2031
- 5.1. Market Analysis, Insights and Forecast - by Type
- 5.1.1. Power Semiconductors
- 5.1.2. Opto-Semiconductors
- 5.1.3. RF Semiconductors
- 5.2. Market Analysis, Insights and Forecast - by Devices
- 5.2.1. Transistors
- 5.2.2. Diodes
- 5.2.3. Rectifiers
- 5.2.4. Power ICs
- 5.3. Market Analysis, Insights and Forecast - by End-user Industry
- 5.3.1. Automotive
- 5.3.2. Consumer Electronics
- 5.3.3. Aerospace and Defense
- 5.3.4. Medical
- 5.3.5. Information Communication and Technology
- 5.3.6. Other End-user Industries
- 5.4. Market Analysis, Insights and Forecast - by Region
- 5.4.1. United States
- 5.4.2. Europe
- 5.4.3. Japan
- 5.4.4. China
- 5.4.5. Korea
- 5.4.6. Taiwan
- 5.4.7. Latin America
- 5.4.8. Middle East and Africa
- 5.1. Market Analysis, Insights and Forecast - by Type
- 6. United States GaN Industry Analysis, Insights and Forecast, 2019-2031
- 6.1. Market Analysis, Insights and Forecast - by Type
- 6.1.1. Power Semiconductors
- 6.1.2. Opto-Semiconductors
- 6.1.3. RF Semiconductors
- 6.2. Market Analysis, Insights and Forecast - by Devices
- 6.2.1. Transistors
- 6.2.2. Diodes
- 6.2.3. Rectifiers
- 6.2.4. Power ICs
- 6.3. Market Analysis, Insights and Forecast - by End-user Industry
- 6.3.1. Automotive
- 6.3.2. Consumer Electronics
- 6.3.3. Aerospace and Defense
- 6.3.4. Medical
- 6.3.5. Information Communication and Technology
- 6.3.6. Other End-user Industries
- 6.1. Market Analysis, Insights and Forecast - by Type
- 7. Europe GaN Industry Analysis, Insights and Forecast, 2019-2031
- 7.1. Market Analysis, Insights and Forecast - by Type
- 7.1.1. Power Semiconductors
- 7.1.2. Opto-Semiconductors
- 7.1.3. RF Semiconductors
- 7.2. Market Analysis, Insights and Forecast - by Devices
- 7.2.1. Transistors
- 7.2.2. Diodes
- 7.2.3. Rectifiers
- 7.2.4. Power ICs
- 7.3. Market Analysis, Insights and Forecast - by End-user Industry
- 7.3.1. Automotive
- 7.3.2. Consumer Electronics
- 7.3.3. Aerospace and Defense
- 7.3.4. Medical
- 7.3.5. Information Communication and Technology
- 7.3.6. Other End-user Industries
- 7.1. Market Analysis, Insights and Forecast - by Type
- 8. Japan GaN Industry Analysis, Insights and Forecast, 2019-2031
- 8.1. Market Analysis, Insights and Forecast - by Type
- 8.1.1. Power Semiconductors
- 8.1.2. Opto-Semiconductors
- 8.1.3. RF Semiconductors
- 8.2. Market Analysis, Insights and Forecast - by Devices
- 8.2.1. Transistors
- 8.2.2. Diodes
- 8.2.3. Rectifiers
- 8.2.4. Power ICs
- 8.3. Market Analysis, Insights and Forecast - by End-user Industry
- 8.3.1. Automotive
- 8.3.2. Consumer Electronics
- 8.3.3. Aerospace and Defense
- 8.3.4. Medical
- 8.3.5. Information Communication and Technology
- 8.3.6. Other End-user Industries
- 8.1. Market Analysis, Insights and Forecast - by Type
- 9. China GaN Industry Analysis, Insights and Forecast, 2019-2031
- 9.1. Market Analysis, Insights and Forecast - by Type
- 9.1.1. Power Semiconductors
- 9.1.2. Opto-Semiconductors
- 9.1.3. RF Semiconductors
- 9.2. Market Analysis, Insights and Forecast - by Devices
- 9.2.1. Transistors
- 9.2.2. Diodes
- 9.2.3. Rectifiers
- 9.2.4. Power ICs
- 9.3. Market Analysis, Insights and Forecast - by End-user Industry
- 9.3.1. Automotive
- 9.3.2. Consumer Electronics
- 9.3.3. Aerospace and Defense
- 9.3.4. Medical
- 9.3.5. Information Communication and Technology
- 9.3.6. Other End-user Industries
- 9.1. Market Analysis, Insights and Forecast - by Type
- 10. Korea GaN Industry Analysis, Insights and Forecast, 2019-2031
- 10.1. Market Analysis, Insights and Forecast - by Type
- 10.1.1. Power Semiconductors
- 10.1.2. Opto-Semiconductors
- 10.1.3. RF Semiconductors
- 10.2. Market Analysis, Insights and Forecast - by Devices
- 10.2.1. Transistors
- 10.2.2. Diodes
- 10.2.3. Rectifiers
- 10.2.4. Power ICs
- 10.3. Market Analysis, Insights and Forecast - by End-user Industry
- 10.3.1. Automotive
- 10.3.2. Consumer Electronics
- 10.3.3. Aerospace and Defense
- 10.3.4. Medical
- 10.3.5. Information Communication and Technology
- 10.3.6. Other End-user Industries
- 10.1. Market Analysis, Insights and Forecast - by Type
- 11. Taiwan GaN Industry Analysis, Insights and Forecast, 2019-2031
- 11.1. Market Analysis, Insights and Forecast - by Type
- 11.1.1. Power Semiconductors
- 11.1.2. Opto-Semiconductors
- 11.1.3. RF Semiconductors
- 11.2. Market Analysis, Insights and Forecast - by Devices
- 11.2.1. Transistors
- 11.2.2. Diodes
- 11.2.3. Rectifiers
- 11.2.4. Power ICs
- 11.3. Market Analysis, Insights and Forecast - by End-user Industry
- 11.3.1. Automotive
- 11.3.2. Consumer Electronics
- 11.3.3. Aerospace and Defense
- 11.3.4. Medical
- 11.3.5. Information Communication and Technology
- 11.3.6. Other End-user Industries
- 11.1. Market Analysis, Insights and Forecast - by Type
- 12. Latin America GaN Industry Analysis, Insights and Forecast, 2019-2031
- 12.1. Market Analysis, Insights and Forecast - by Type
- 12.1.1. Power Semiconductors
- 12.1.2. Opto-Semiconductors
- 12.1.3. RF Semiconductors
- 12.2. Market Analysis, Insights and Forecast - by Devices
- 12.2.1. Transistors
- 12.2.2. Diodes
- 12.2.3. Rectifiers
- 12.2.4. Power ICs
- 12.3. Market Analysis, Insights and Forecast - by End-user Industry
- 12.3.1. Automotive
- 12.3.2. Consumer Electronics
- 12.3.3. Aerospace and Defense
- 12.3.4. Medical
- 12.3.5. Information Communication and Technology
- 12.3.6. Other End-user Industries
- 12.1. Market Analysis, Insights and Forecast - by Type
- 13. Middle East and Africa GaN Industry Analysis, Insights and Forecast, 2019-2031
- 13.1. Market Analysis, Insights and Forecast - by Type
- 13.1.1. Power Semiconductors
- 13.1.2. Opto-Semiconductors
- 13.1.3. RF Semiconductors
- 13.2. Market Analysis, Insights and Forecast - by Devices
- 13.2.1. Transistors
- 13.2.2. Diodes
- 13.2.3. Rectifiers
- 13.2.4. Power ICs
- 13.3. Market Analysis, Insights and Forecast - by End-user Industry
- 13.3.1. Automotive
- 13.3.2. Consumer Electronics
- 13.3.3. Aerospace and Defense
- 13.3.4. Medical
- 13.3.5. Information Communication and Technology
- 13.3.6. Other End-user Industries
- 13.1. Market Analysis, Insights and Forecast - by Type
- 14. North America GaN Industry Analysis, Insights and Forecast, 2019-2031
- 14.1. Market Analysis, Insights and Forecast - By Country/Sub-region
- 14.1.1 United States
- 14.1.2 Canada
- 15. Europe GaN Industry Analysis, Insights and Forecast, 2019-2031
- 15.1. Market Analysis, Insights and Forecast - By Country/Sub-region
- 15.1.1 United Kingdom
- 15.1.2 Germany
- 15.1.3 France
- 15.1.4 Rest of Europe
- 16. Asia Pacific GaN Industry Analysis, Insights and Forecast, 2019-2031
- 16.1. Market Analysis, Insights and Forecast - By Country/Sub-region
- 16.1.1 China
- 16.1.2 Japan
- 16.1.3 India
- 16.1.4 South Korea
- 16.1.5 Rest of Asia Pacific
- 17. Latin America GaN Industry Analysis, Insights and Forecast, 2019-2031
- 17.1. Market Analysis, Insights and Forecast - By Country/Sub-region
- 17.1.1.
- 18. Middle East and Africa GaN Industry Analysis, Insights and Forecast, 2019-2031
- 18.1. Market Analysis, Insights and Forecast - By Country/Sub-region
- 18.1.1.
- 19. Competitive Analysis
- 19.1. Global Market Share Analysis 2024
- 19.2. Company Profiles
- 19.2.1 Efficient Power Conversion Corporation
- 19.2.1.1. Overview
- 19.2.1.2. Products
- 19.2.1.3. SWOT Analysis
- 19.2.1.4. Recent Developments
- 19.2.1.5. Financials (Based on Availability)
- 19.2.2 Infineon Technologies AG
- 19.2.2.1. Overview
- 19.2.2.2. Products
- 19.2.2.3. SWOT Analysis
- 19.2.2.4. Recent Developments
- 19.2.2.5. Financials (Based on Availability)
- 19.2.3 Microchip Technology Inc
- 19.2.3.1. Overview
- 19.2.3.2. Products
- 19.2.3.3. SWOT Analysis
- 19.2.3.4. Recent Developments
- 19.2.3.5. Financials (Based on Availability)
- 19.2.4 GaN Systems
- 19.2.4.1. Overview
- 19.2.4.2. Products
- 19.2.4.3. SWOT Analysis
- 19.2.4.4. Recent Developments
- 19.2.4.5. Financials (Based on Availability)
- 19.2.5 NexGen Power Systems
- 19.2.5.1. Overview
- 19.2.5.2. Products
- 19.2.5.3. SWOT Analysis
- 19.2.5.4. Recent Developments
- 19.2.5.5. Financials (Based on Availability)
- 19.2.6 NXP Semiconductors
- 19.2.6.1. Overview
- 19.2.6.2. Products
- 19.2.6.3. SWOT Analysis
- 19.2.6.4. Recent Developments
- 19.2.6.5. Financials (Based on Availability)
- 19.2.7 Wolfspeed Inc
- 19.2.7.1. Overview
- 19.2.7.2. Products
- 19.2.7.3. SWOT Analysis
- 19.2.7.4. Recent Developments
- 19.2.7.5. Financials (Based on Availability)
- 19.2.8 Toshiba Electronic Devices & Storage Corporation
- 19.2.8.1. Overview
- 19.2.8.2. Products
- 19.2.8.3. SWOT Analysis
- 19.2.8.4. Recent Developments
- 19.2.8.5. Financials (Based on Availability)
- 19.2.9 Soitec
- 19.2.9.1. Overview
- 19.2.9.2. Products
- 19.2.9.3. SWOT Analysis
- 19.2.9.4. Recent Developments
- 19.2.9.5. Financials (Based on Availability)
- 19.2.10 Qorvo Inc
- 19.2.10.1. Overview
- 19.2.10.2. Products
- 19.2.10.3. SWOT Analysis
- 19.2.10.4. Recent Developments
- 19.2.10.5. Financials (Based on Availability)
- 19.2.11 Texas Instruments Incorporated
- 19.2.11.1. Overview
- 19.2.11.2. Products
- 19.2.11.3. SWOT Analysis
- 19.2.11.4. Recent Developments
- 19.2.11.5. Financials (Based on Availability)
- 19.2.12 NTT Advanced Technology Corporation*List Not Exhaustive
- 19.2.12.1. Overview
- 19.2.12.2. Products
- 19.2.12.3. SWOT Analysis
- 19.2.12.4. Recent Developments
- 19.2.12.5. Financials (Based on Availability)
- 19.2.1 Efficient Power Conversion Corporation
List of Figures
- Figure 1: Global GaN Industry Revenue Breakdown (Million, %) by Region 2024 & 2032
- Figure 2: North America GaN Industry Revenue (Million), by Country 2024 & 2032
- Figure 3: North America GaN Industry Revenue Share (%), by Country 2024 & 2032
- Figure 4: Europe GaN Industry Revenue (Million), by Country 2024 & 2032
- Figure 5: Europe GaN Industry Revenue Share (%), by Country 2024 & 2032
- Figure 6: Asia Pacific GaN Industry Revenue (Million), by Country 2024 & 2032
- Figure 7: Asia Pacific GaN Industry Revenue Share (%), by Country 2024 & 2032
- Figure 8: Latin America GaN Industry Revenue (Million), by Country 2024 & 2032
- Figure 9: Latin America GaN Industry Revenue Share (%), by Country 2024 & 2032
- Figure 10: Middle East and Africa GaN Industry Revenue (Million), by Country 2024 & 2032
- Figure 11: Middle East and Africa GaN Industry Revenue Share (%), by Country 2024 & 2032
- Figure 12: United States GaN Industry Revenue (Million), by Type 2024 & 2032
- Figure 13: United States GaN Industry Revenue Share (%), by Type 2024 & 2032
- Figure 14: United States GaN Industry Revenue (Million), by Devices 2024 & 2032
- Figure 15: United States GaN Industry Revenue Share (%), by Devices 2024 & 2032
- Figure 16: United States GaN Industry Revenue (Million), by End-user Industry 2024 & 2032
- Figure 17: United States GaN Industry Revenue Share (%), by End-user Industry 2024 & 2032
- Figure 18: United States GaN Industry Revenue (Million), by Country 2024 & 2032
- Figure 19: United States GaN Industry Revenue Share (%), by Country 2024 & 2032
- Figure 20: Europe GaN Industry Revenue (Million), by Type 2024 & 2032
- Figure 21: Europe GaN Industry Revenue Share (%), by Type 2024 & 2032
- Figure 22: Europe GaN Industry Revenue (Million), by Devices 2024 & 2032
- Figure 23: Europe GaN Industry Revenue Share (%), by Devices 2024 & 2032
- Figure 24: Europe GaN Industry Revenue (Million), by End-user Industry 2024 & 2032
- Figure 25: Europe GaN Industry Revenue Share (%), by End-user Industry 2024 & 2032
- Figure 26: Europe GaN Industry Revenue (Million), by Country 2024 & 2032
- Figure 27: Europe GaN Industry Revenue Share (%), by Country 2024 & 2032
- Figure 28: Japan GaN Industry Revenue (Million), by Type 2024 & 2032
- Figure 29: Japan GaN Industry Revenue Share (%), by Type 2024 & 2032
- Figure 30: Japan GaN Industry Revenue (Million), by Devices 2024 & 2032
- Figure 31: Japan GaN Industry Revenue Share (%), by Devices 2024 & 2032
- Figure 32: Japan GaN Industry Revenue (Million), by End-user Industry 2024 & 2032
- Figure 33: Japan GaN Industry Revenue Share (%), by End-user Industry 2024 & 2032
- Figure 34: Japan GaN Industry Revenue (Million), by Country 2024 & 2032
- Figure 35: Japan GaN Industry Revenue Share (%), by Country 2024 & 2032
- Figure 36: China GaN Industry Revenue (Million), by Type 2024 & 2032
- Figure 37: China GaN Industry Revenue Share (%), by Type 2024 & 2032
- Figure 38: China GaN Industry Revenue (Million), by Devices 2024 & 2032
- Figure 39: China GaN Industry Revenue Share (%), by Devices 2024 & 2032
- Figure 40: China GaN Industry Revenue (Million), by End-user Industry 2024 & 2032
- Figure 41: China GaN Industry Revenue Share (%), by End-user Industry 2024 & 2032
- Figure 42: China GaN Industry Revenue (Million), by Country 2024 & 2032
- Figure 43: China GaN Industry Revenue Share (%), by Country 2024 & 2032
- Figure 44: Korea GaN Industry Revenue (Million), by Type 2024 & 2032
- Figure 45: Korea GaN Industry Revenue Share (%), by Type 2024 & 2032
- Figure 46: Korea GaN Industry Revenue (Million), by Devices 2024 & 2032
- Figure 47: Korea GaN Industry Revenue Share (%), by Devices 2024 & 2032
- Figure 48: Korea GaN Industry Revenue (Million), by End-user Industry 2024 & 2032
- Figure 49: Korea GaN Industry Revenue Share (%), by End-user Industry 2024 & 2032
- Figure 50: Korea GaN Industry Revenue (Million), by Country 2024 & 2032
- Figure 51: Korea GaN Industry Revenue Share (%), by Country 2024 & 2032
- Figure 52: Taiwan GaN Industry Revenue (Million), by Type 2024 & 2032
- Figure 53: Taiwan GaN Industry Revenue Share (%), by Type 2024 & 2032
- Figure 54: Taiwan GaN Industry Revenue (Million), by Devices 2024 & 2032
- Figure 55: Taiwan GaN Industry Revenue Share (%), by Devices 2024 & 2032
- Figure 56: Taiwan GaN Industry Revenue (Million), by End-user Industry 2024 & 2032
- Figure 57: Taiwan GaN Industry Revenue Share (%), by End-user Industry 2024 & 2032
- Figure 58: Taiwan GaN Industry Revenue (Million), by Country 2024 & 2032
- Figure 59: Taiwan GaN Industry Revenue Share (%), by Country 2024 & 2032
- Figure 60: Latin America GaN Industry Revenue (Million), by Type 2024 & 2032
- Figure 61: Latin America GaN Industry Revenue Share (%), by Type 2024 & 2032
- Figure 62: Latin America GaN Industry Revenue (Million), by Devices 2024 & 2032
- Figure 63: Latin America GaN Industry Revenue Share (%), by Devices 2024 & 2032
- Figure 64: Latin America GaN Industry Revenue (Million), by End-user Industry 2024 & 2032
- Figure 65: Latin America GaN Industry Revenue Share (%), by End-user Industry 2024 & 2032
- Figure 66: Latin America GaN Industry Revenue (Million), by Country 2024 & 2032
- Figure 67: Latin America GaN Industry Revenue Share (%), by Country 2024 & 2032
- Figure 68: Middle East and Africa GaN Industry Revenue (Million), by Type 2024 & 2032
- Figure 69: Middle East and Africa GaN Industry Revenue Share (%), by Type 2024 & 2032
- Figure 70: Middle East and Africa GaN Industry Revenue (Million), by Devices 2024 & 2032
- Figure 71: Middle East and Africa GaN Industry Revenue Share (%), by Devices 2024 & 2032
- Figure 72: Middle East and Africa GaN Industry Revenue (Million), by End-user Industry 2024 & 2032
- Figure 73: Middle East and Africa GaN Industry Revenue Share (%), by End-user Industry 2024 & 2032
- Figure 74: Middle East and Africa GaN Industry Revenue (Million), by Country 2024 & 2032
- Figure 75: Middle East and Africa GaN Industry Revenue Share (%), by Country 2024 & 2032
List of Tables
- Table 1: Global GaN Industry Revenue Million Forecast, by Region 2019 & 2032
- Table 2: Global GaN Industry Revenue Million Forecast, by Type 2019 & 2032
- Table 3: Global GaN Industry Revenue Million Forecast, by Devices 2019 & 2032
- Table 4: Global GaN Industry Revenue Million Forecast, by End-user Industry 2019 & 2032
- Table 5: Global GaN Industry Revenue Million Forecast, by Region 2019 & 2032
- Table 6: Global GaN Industry Revenue Million Forecast, by Country 2019 & 2032
- Table 7: United States GaN Industry Revenue (Million) Forecast, by Application 2019 & 2032
- Table 8: Canada GaN Industry Revenue (Million) Forecast, by Application 2019 & 2032
- Table 9: Global GaN Industry Revenue Million Forecast, by Country 2019 & 2032
- Table 10: United Kingdom GaN Industry Revenue (Million) Forecast, by Application 2019 & 2032
- Table 11: Germany GaN Industry Revenue (Million) Forecast, by Application 2019 & 2032
- Table 12: France GaN Industry Revenue (Million) Forecast, by Application 2019 & 2032
- Table 13: Rest of Europe GaN Industry Revenue (Million) Forecast, by Application 2019 & 2032
- Table 14: Global GaN Industry Revenue Million Forecast, by Country 2019 & 2032
- Table 15: China GaN Industry Revenue (Million) Forecast, by Application 2019 & 2032
- Table 16: Japan GaN Industry Revenue (Million) Forecast, by Application 2019 & 2032
- Table 17: India GaN Industry Revenue (Million) Forecast, by Application 2019 & 2032
- Table 18: South Korea GaN Industry Revenue (Million) Forecast, by Application 2019 & 2032
- Table 19: Rest of Asia Pacific GaN Industry Revenue (Million) Forecast, by Application 2019 & 2032
- Table 20: Global GaN Industry Revenue Million Forecast, by Country 2019 & 2032
- Table 21: GaN Industry Revenue (Million) Forecast, by Application 2019 & 2032
- Table 22: Global GaN Industry Revenue Million Forecast, by Country 2019 & 2032
- Table 23: GaN Industry Revenue (Million) Forecast, by Application 2019 & 2032
- Table 24: Global GaN Industry Revenue Million Forecast, by Type 2019 & 2032
- Table 25: Global GaN Industry Revenue Million Forecast, by Devices 2019 & 2032
- Table 26: Global GaN Industry Revenue Million Forecast, by End-user Industry 2019 & 2032
- Table 27: Global GaN Industry Revenue Million Forecast, by Country 2019 & 2032
- Table 28: Global GaN Industry Revenue Million Forecast, by Type 2019 & 2032
- Table 29: Global GaN Industry Revenue Million Forecast, by Devices 2019 & 2032
- Table 30: Global GaN Industry Revenue Million Forecast, by End-user Industry 2019 & 2032
- Table 31: Global GaN Industry Revenue Million Forecast, by Country 2019 & 2032
- Table 32: Global GaN Industry Revenue Million Forecast, by Type 2019 & 2032
- Table 33: Global GaN Industry Revenue Million Forecast, by Devices 2019 & 2032
- Table 34: Global GaN Industry Revenue Million Forecast, by End-user Industry 2019 & 2032
- Table 35: Global GaN Industry Revenue Million Forecast, by Country 2019 & 2032
- Table 36: Global GaN Industry Revenue Million Forecast, by Type 2019 & 2032
- Table 37: Global GaN Industry Revenue Million Forecast, by Devices 2019 & 2032
- Table 38: Global GaN Industry Revenue Million Forecast, by End-user Industry 2019 & 2032
- Table 39: Global GaN Industry Revenue Million Forecast, by Country 2019 & 2032
- Table 40: Global GaN Industry Revenue Million Forecast, by Type 2019 & 2032
- Table 41: Global GaN Industry Revenue Million Forecast, by Devices 2019 & 2032
- Table 42: Global GaN Industry Revenue Million Forecast, by End-user Industry 2019 & 2032
- Table 43: Global GaN Industry Revenue Million Forecast, by Country 2019 & 2032
- Table 44: Global GaN Industry Revenue Million Forecast, by Type 2019 & 2032
- Table 45: Global GaN Industry Revenue Million Forecast, by Devices 2019 & 2032
- Table 46: Global GaN Industry Revenue Million Forecast, by End-user Industry 2019 & 2032
- Table 47: Global GaN Industry Revenue Million Forecast, by Country 2019 & 2032
- Table 48: Global GaN Industry Revenue Million Forecast, by Type 2019 & 2032
- Table 49: Global GaN Industry Revenue Million Forecast, by Devices 2019 & 2032
- Table 50: Global GaN Industry Revenue Million Forecast, by End-user Industry 2019 & 2032
- Table 51: Global GaN Industry Revenue Million Forecast, by Country 2019 & 2032
- Table 52: Global GaN Industry Revenue Million Forecast, by Type 2019 & 2032
- Table 53: Global GaN Industry Revenue Million Forecast, by Devices 2019 & 2032
- Table 54: Global GaN Industry Revenue Million Forecast, by End-user Industry 2019 & 2032
- Table 55: Global GaN Industry Revenue Million Forecast, by Country 2019 & 2032
Frequently Asked Questions
1. What is the projected Compound Annual Growth Rate (CAGR) of the GaN Industry?
The projected CAGR is approximately 6.06%.
2. Which companies are prominent players in the GaN Industry?
Key companies in the market include Efficient Power Conversion Corporation, Infineon Technologies AG, Microchip Technology Inc, GaN Systems, NexGen Power Systems, NXP Semiconductors, Wolfspeed Inc, Toshiba Electronic Devices & Storage Corporation, Soitec, Qorvo Inc, Texas Instruments Incorporated, NTT Advanced Technology Corporation*List Not Exhaustive.
3. What are the main segments of the GaN Industry?
The market segments include Type, Devices, End-user Industry.
4. Can you provide details about the market size?
The market size is estimated to be USD 21.18 Million as of 2022.
5. What are some drivers contributing to market growth?
Strong Demand from Telecom Infrastructure Segment Driven by Advancements in 5G Implementation; Favorable Attributes Such As High-performance and Small Form Factor to Drive Adoption in the Military Segment.
6. What are the notable trends driving market growth?
Consumer Electronics to Hold Significant Market Share.
7. Are there any restraints impacting market growth?
; Declining Volume of Traditional Mails; High Adoption Costs.
8. Can you provide examples of recent developments in the market?
Jan 2024: Silvaco Group, Inc., a leading provider of TCAD, EDA software, and design IP, partnered with GaN Valley to drive advancements in efficient gallium nitride (GaN) power device design. By leveraging its Victory TCAD platform, Silvaco aims to empower customers to innovate and optimize performance in GaN-based semiconductor power devices. The Victory TCAD platform offers a comprehensive simulation environment, incorporating diverse numerical methods, physical models, SPICE model generation, and a user-friendly graphical interface, tailored specifically for the latest generation of GaN-based power devices.
9. What pricing options are available for accessing the report?
Pricing options include single-user, multi-user, and enterprise licenses priced at USD 4750, USD 5250, and USD 8750 respectively.
10. Is the market size provided in terms of value or volume?
The market size is provided in terms of value, measured in Million.
11. Are there any specific market keywords associated with the report?
Yes, the market keyword associated with the report is "GaN Industry," which aids in identifying and referencing the specific market segment covered.
12. How do I determine which pricing option suits my needs best?
The pricing options vary based on user requirements and access needs. Individual users may opt for single-user licenses, while businesses requiring broader access may choose multi-user or enterprise licenses for cost-effective access to the report.
13. Are there any additional resources or data provided in the GaN Industry report?
While the report offers comprehensive insights, it's advisable to review the specific contents or supplementary materials provided to ascertain if additional resources or data are available.
14. How can I stay updated on further developments or reports in the GaN Industry?
To stay informed about further developments, trends, and reports in the GaN Industry, consider subscribing to industry newsletters, following relevant companies and organizations, or regularly checking reputable industry news sources and publications.
Methodology
Step 1 - Identification of Relevant Samples Size from Population Database


Step 2 - Approaches for Defining Global Market Size (Value, Volume* & Price*)

Note*: In applicable scenarios
Step 3 - Data Sources
Primary Research
- Web Analytics
- Survey Reports
- Research Institute
- Latest Research Reports
- Opinion Leaders
Secondary Research
- Annual Reports
- White Paper
- Latest Press Release
- Industry Association
- Paid Database
- Investor Presentations

Step 4 - Data Triangulation
Involves using different sources of information in order to increase the validity of a study
These sources are likely to be stakeholders in a program - participants, other researchers, program staff, other community members, and so on.
Then we put all data in single framework & apply various statistical tools to find out the dynamic on the market.
During the analysis stage, feedback from the stakeholder groups would be compared to determine areas of agreement as well as areas of divergence


