
Key Insights
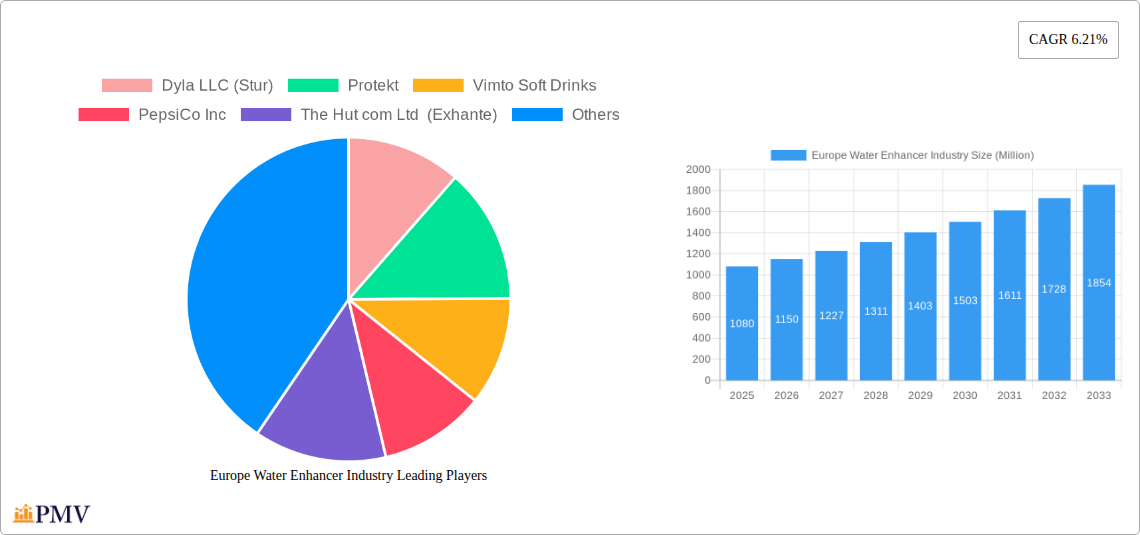
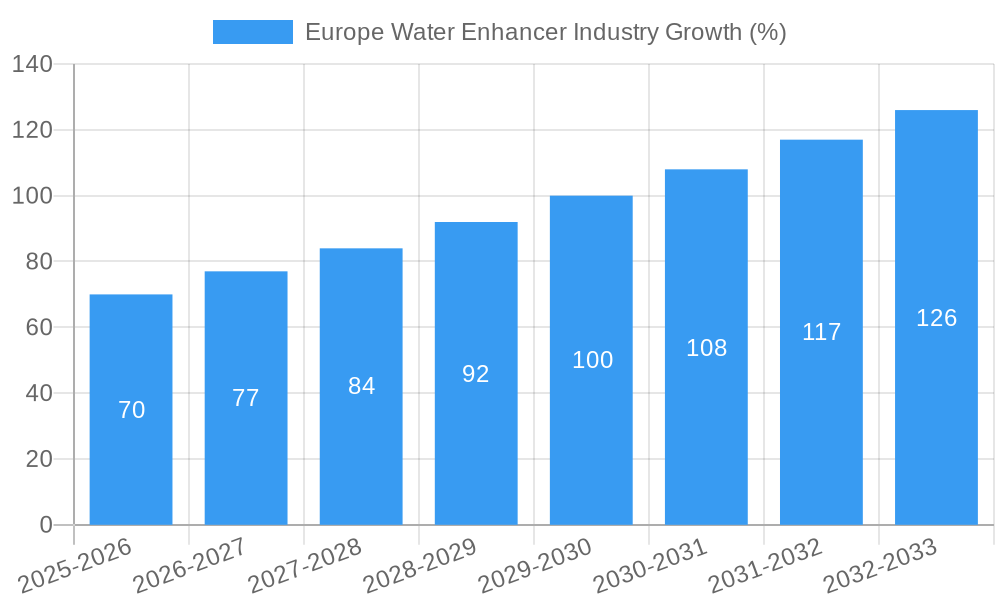
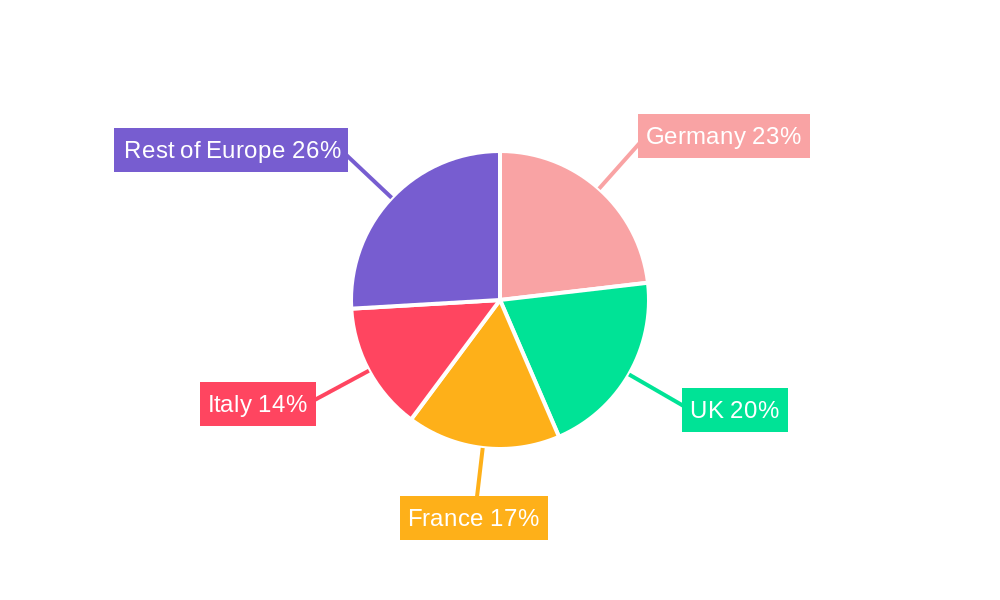
The European water enhancer market, valued at €1.08 billion in 2025, is projected to experience robust growth, exhibiting a Compound Annual Growth Rate (CAGR) of 6.21% from 2025 to 2033. This expansion is fueled by several key drivers. The increasing consumer awareness of health and wellness, coupled with a preference for healthier alternatives to sugary drinks, is significantly boosting demand for water enhancers. The convenience factor, allowing for easy customization of beverage flavors and sweetness levels, is another significant driver. Furthermore, the rising popularity of functional beverages, incorporating vitamins, minerals, and other beneficial ingredients, further contributes to market growth. The market is segmented by distribution channels, with supermarkets/hypermarkets, convenience stores, and online retail stores representing major sales avenues. Germany, the United Kingdom, France, and Italy are key contributors to the overall market size, reflecting established consumer bases and strong retail infrastructure. However, market growth may face some restraints, including potential price sensitivity amongst consumers and the emergence of competing healthier beverage alternatives. Nevertheless, the overall outlook remains positive, with considerable growth opportunities predicted throughout the forecast period.
The market's growth trajectory is expected to be uneven across different European nations. Germany, with its strong economy and health-conscious population, is likely to remain a leading market, followed by the UK and France. Southern European countries may exhibit slower growth rates due to established beverage consumption habits and price sensitivity. The ongoing shift towards online retail and e-commerce presents significant opportunities for expansion, particularly among younger demographics. Companies are continuously innovating to meet consumer demands, introducing new flavors, functional benefits, and sustainable packaging options. This dynamic competitive landscape, characterized by established players like PepsiCo and Coca-Cola alongside emerging brands, will further fuel market diversification and growth. The strategic expansion of distribution channels, particularly in emerging markets within Europe, is also expected to play a crucial role in driving market penetration and growth throughout the forecast period.
Europe Water Enhancer Industry: A Comprehensive Market Report (2019-2033)
This comprehensive report provides a detailed analysis of the Europe water enhancer industry, offering invaluable insights for businesses, investors, and stakeholders seeking to navigate this dynamic market. The report covers the period from 2019 to 2033, with a focus on the base year 2025 and a forecast period of 2025-2033. It meticulously examines market size, growth drivers, competitive dynamics, and future opportunities within this rapidly expanding sector. The total market value in 2025 is estimated at €XX Million.
Europe Water Enhancer Industry Market Structure & Competitive Dynamics
This section delves into the competitive landscape of the European water enhancer market, analyzing market concentration, innovation, regulations, and market dynamics. The market is characterized by a mix of large multinational corporations and smaller, specialized players. Market share is currently dominated by a few key players, with PepsiCo Inc. and The Coca-Cola Company holding significant positions. However, smaller companies like Dyla LLC (Stur) and DreamPak are increasingly gaining traction through product innovation and targeted marketing.
The industry witnesses continuous innovation in flavors, functional benefits (e.g., vitamins, antioxidants), and packaging. Regulatory frameworks concerning food safety and labeling significantly impact product development and marketing strategies. The availability of substitute beverages, such as fruit juices and ready-to-drink teas, poses a competitive challenge. End-user trends, especially the growing preference for healthier and more convenient beverages, fuel market growth. Mergers and acquisitions (M&A) activities play a role in shaping the market structure; however, the value of M&A deals in this specific sector remains at €XX Million during the historical period (2019-2024).
- Market Concentration: Moderately concentrated, with a few major players and numerous smaller firms.
- Innovation Ecosystems: Active, with ongoing developments in flavors, functional ingredients, and packaging.
- Regulatory Frameworks: Stringent regulations regarding food safety and labeling impact industry practices.
- Product Substitutes: Fruit juices, ready-to-drink teas, and other flavored beverages create competitive pressures.
- End-User Trends: Growing demand for healthy, convenient, and functional beverages drives market expansion.
- M&A Activities: €XX Million in M&A deals during the historical period (2019-2024).
Europe Water Enhancer Industry Industry Trends & Insights
The European water enhancer market exhibits a robust growth trajectory, driven by several key factors. The increasing health-conscious consumer base fuels demand for healthier alternatives to sugary drinks. Technological advancements in flavor creation and packaging enhance product appeal and convenience. The market is witnessing a shift toward natural and organic ingredients, prompting manufacturers to reformulate their products. Furthermore, the rise of e-commerce and online retail channels expands market reach and accessibility. The compound annual growth rate (CAGR) from 2019 to 2024 is estimated at XX%, with market penetration projected to reach XX% by 2033. Competitive dynamics are characterized by intense rivalry among established players and the emergence of innovative startups, resulting in continuous product launches and marketing efforts.
Dominant Markets & Segments in Europe Water Enhancer Industry
The United Kingdom currently holds the largest market share within Europe, driven by high consumer awareness of health and wellness, strong retail infrastructure, and a large consumer base. Germany and France also represent significant markets, though with slightly different growth drivers. The Supermarket/Hypermarket distribution channel accounts for the largest segment, reflecting the dominance of traditional retail. Online retail, however, is experiencing the most rapid growth.
Key Drivers by Country:
- United Kingdom: High health consciousness, established retail infrastructure, substantial consumer base.
- Germany: Strong economy, established retail networks, increasing demand for functional beverages.
- France: Growing health awareness, expanding online retail presence, preference for natural ingredients.
Key Drivers by Distribution Channel:
- Supermarkets/Hypermarkets: Established distribution network, high volume sales, brand visibility.
- Online Retail Stores: Rapid growth, convenience, expanded market reach.
- Convenience Stores: Accessibility, impulse purchases, localized market penetration.
Europe Water Enhancer Industry Product Innovations
Recent innovations center around enhanced functionality, offering consumers added vitamins, minerals, and antioxidants. The introduction of new flavors caters to evolving consumer preferences. Technological advancements in flavor encapsulation and stabilization ensure longer shelf life and improved taste. Sustainable and eco-friendly packaging solutions are gaining traction, aligning with growing environmental awareness.
Report Segmentation & Scope
The report segments the market by distribution channel (Supermarkets/Hypermarkets, Convenience Stores, Online Retail Stores, Pharmacy & Health Stores, Other Distribution Channels) and by country (Spain, United Kingdom, France, Germany, Italy, Russia, Rest of Europe). Each segment's growth projection, market size, and competitive landscape are comprehensively analyzed. The forecast period extends to 2033, providing a long-term outlook for each segment. Market sizes for individual segments are not available, but predicted values show considerable growth in all segments, particularly in online retail and countries with rising health consciousness.
Key Drivers of Europe Water Enhancer Industry Growth
Several factors contribute to the industry's growth. The increasing prevalence of health-conscious consumers seeking healthier beverage choices is a primary driver. Technological advancements in flavor creation and formulation contribute to product diversification and appeal. Favorable regulatory environments and growing consumer spending power in many European countries create favorable market conditions.
Challenges in the Europe Water Enhancer Industry Sector
The industry faces challenges such as intense competition, fluctuating raw material costs, and the need for continuous product innovation. Stringent regulatory requirements regarding labeling and food safety add to operational complexities. Supply chain disruptions can impact production and distribution, while evolving consumer preferences necessitate frequent product reformulation. The market faces price pressure from private label brands, requiring manufacturers to differentiate through added value features.
Leading Players in the Europe Water Enhancer Industry Market
- Dyla LLC (Stur)
- Protekt
- Vimto Soft Drinks
- PepsiCo Inc
- The Hut com Ltd (Exhante)
- The Kraft Heinz Company
- The Coca-Cola Company
- Pure Flavour GmbH
- DreamPak
- Wisdom Natural Brands
Key Developments in Europe Water Enhancer Industry Sector
- 2022 (Q[insert quarter]): Robinsons launched new Benefit Drops in four flavors, enhancing the vitamin content.
- 2022 (Q[insert quarter]): DreamPak introduced Enhanca Hydrate water flavor enhancers in various fruit flavors.
- 2022 (Q[insert quarter]): Protekt launched liquid supplements and beverage enhancers with antioxidants in the UK.
Strategic Europe Water Enhancer Industry Market Outlook
The future of the European water enhancer market is promising. Continued growth is anticipated, driven by sustained consumer demand for healthier and more convenient beverages. Opportunities exist in developing innovative products with enhanced functional benefits, focusing on sustainability, and expanding into new markets. Companies leveraging technological advancements and adopting effective marketing strategies are poised to achieve significant market success.
Europe Water Enhancer Industry Segmentation
-
1. Distribution Channel
- 1.1. Supermarkets/Hypermarkets
- 1.2. Convenience Stores
- 1.3. Online Retail Stores
- 1.4. Pharmacy & Health Store
- 1.5. Other Distribution Channels
Europe Water Enhancer Industry Segmentation By Geography
-
1. Europe
- 1.1. United Kingdom
- 1.2. Germany
- 1.3. France
- 1.4. Italy
- 1.5. Spain
- 1.6. Netherlands
- 1.7. Belgium
- 1.8. Sweden
- 1.9. Norway
- 1.10. Poland
- 1.11. Denmark
Europe Water Enhancer Industry REPORT HIGHLIGHTS
| Aspects | Details |
|---|---|
| Study Period | 2019-2033 |
| Base Year | 2024 |
| Estimated Year | 2025 |
| Forecast Period | 2025-2033 |
| Historical Period | 2019-2024 |
| Growth Rate | CAGR of 6.21% from 2019-2033 |
| Segmentation |
|
Table of Contents
- 1. Introduction
- 1.1. Research Scope
- 1.2. Market Segmentation
- 1.3. Research Methodology
- 1.4. Definitions and Assumptions
- 2. Executive Summary
- 2.1. Introduction
- 3. Market Dynamics
- 3.1. Introduction
- 3.2. Market Drivers
- 3.2.1. Increasing Sports Participation; Increasing Awareness about Health and Fitness
- 3.3. Market Restrains
- 3.3.1. Adverse Effects of Overconsumption of Products
- 3.4. Market Trends
- 3.4.1. Rising Demand for Non-Carbonated Beverages
- 4. Market Factor Analysis
- 4.1. Porters Five Forces
- 4.2. Supply/Value Chain
- 4.3. PESTEL analysis
- 4.4. Market Entropy
- 4.5. Patent/Trademark Analysis
- 5. Europe Water Enhancer Industry Analysis, Insights and Forecast, 2019-2031
- 5.1. Market Analysis, Insights and Forecast - by Distribution Channel
- 5.1.1. Supermarkets/Hypermarkets
- 5.1.2. Convenience Stores
- 5.1.3. Online Retail Stores
- 5.1.4. Pharmacy & Health Store
- 5.1.5. Other Distribution Channels
- 5.2. Market Analysis, Insights and Forecast - by Region
- 5.2.1. Europe
- 5.1. Market Analysis, Insights and Forecast - by Distribution Channel
- 6. Germany Europe Water Enhancer Industry Analysis, Insights and Forecast, 2019-2031
- 7. France Europe Water Enhancer Industry Analysis, Insights and Forecast, 2019-2031
- 8. Italy Europe Water Enhancer Industry Analysis, Insights and Forecast, 2019-2031
- 9. United Kingdom Europe Water Enhancer Industry Analysis, Insights and Forecast, 2019-2031
- 10. Netherlands Europe Water Enhancer Industry Analysis, Insights and Forecast, 2019-2031
- 11. Sweden Europe Water Enhancer Industry Analysis, Insights and Forecast, 2019-2031
- 12. Rest of Europe Europe Water Enhancer Industry Analysis, Insights and Forecast, 2019-2031
- 13. Competitive Analysis
- 13.1. Market Share Analysis 2024
- 13.2. Company Profiles
- 13.2.1 Dyla LLC (Stur)
- 13.2.1.1. Overview
- 13.2.1.2. Products
- 13.2.1.3. SWOT Analysis
- 13.2.1.4. Recent Developments
- 13.2.1.5. Financials (Based on Availability)
- 13.2.2 Protekt
- 13.2.2.1. Overview
- 13.2.2.2. Products
- 13.2.2.3. SWOT Analysis
- 13.2.2.4. Recent Developments
- 13.2.2.5. Financials (Based on Availability)
- 13.2.3 Vimto Soft Drinks
- 13.2.3.1. Overview
- 13.2.3.2. Products
- 13.2.3.3. SWOT Analysis
- 13.2.3.4. Recent Developments
- 13.2.3.5. Financials (Based on Availability)
- 13.2.4 PepsiCo Inc
- 13.2.4.1. Overview
- 13.2.4.2. Products
- 13.2.4.3. SWOT Analysis
- 13.2.4.4. Recent Developments
- 13.2.4.5. Financials (Based on Availability)
- 13.2.5 The Hut com Ltd (Exhante)
- 13.2.5.1. Overview
- 13.2.5.2. Products
- 13.2.5.3. SWOT Analysis
- 13.2.5.4. Recent Developments
- 13.2.5.5. Financials (Based on Availability)
- 13.2.6 The Kraft Heinz Company
- 13.2.6.1. Overview
- 13.2.6.2. Products
- 13.2.6.3. SWOT Analysis
- 13.2.6.4. Recent Developments
- 13.2.6.5. Financials (Based on Availability)
- 13.2.7 The Coca-Cola Company
- 13.2.7.1. Overview
- 13.2.7.2. Products
- 13.2.7.3. SWOT Analysis
- 13.2.7.4. Recent Developments
- 13.2.7.5. Financials (Based on Availability)
- 13.2.8 Pure Flavour GmbH
- 13.2.8.1. Overview
- 13.2.8.2. Products
- 13.2.8.3. SWOT Analysis
- 13.2.8.4. Recent Developments
- 13.2.8.5. Financials (Based on Availability)
- 13.2.9 DreamPak*List Not Exhaustive
- 13.2.9.1. Overview
- 13.2.9.2. Products
- 13.2.9.3. SWOT Analysis
- 13.2.9.4. Recent Developments
- 13.2.9.5. Financials (Based on Availability)
- 13.2.10 Wisdom Natural Brands
- 13.2.10.1. Overview
- 13.2.10.2. Products
- 13.2.10.3. SWOT Analysis
- 13.2.10.4. Recent Developments
- 13.2.10.5. Financials (Based on Availability)
- 13.2.1 Dyla LLC (Stur)
List of Figures
- Figure 1: Europe Water Enhancer Industry Revenue Breakdown (Million, %) by Product 2024 & 2032
- Figure 2: Europe Water Enhancer Industry Share (%) by Company 2024
List of Tables
- Table 1: Europe Water Enhancer Industry Revenue Million Forecast, by Region 2019 & 2032
- Table 2: Europe Water Enhancer Industry Volume K Litres Forecast, by Region 2019 & 2032
- Table 3: Europe Water Enhancer Industry Revenue Million Forecast, by Distribution Channel 2019 & 2032
- Table 4: Europe Water Enhancer Industry Volume K Litres Forecast, by Distribution Channel 2019 & 2032
- Table 5: Europe Water Enhancer Industry Revenue Million Forecast, by Region 2019 & 2032
- Table 6: Europe Water Enhancer Industry Volume K Litres Forecast, by Region 2019 & 2032
- Table 7: Europe Water Enhancer Industry Revenue Million Forecast, by Country 2019 & 2032
- Table 8: Europe Water Enhancer Industry Volume K Litres Forecast, by Country 2019 & 2032
- Table 9: Germany Europe Water Enhancer Industry Revenue (Million) Forecast, by Application 2019 & 2032
- Table 10: Germany Europe Water Enhancer Industry Volume (K Litres) Forecast, by Application 2019 & 2032
- Table 11: France Europe Water Enhancer Industry Revenue (Million) Forecast, by Application 2019 & 2032
- Table 12: France Europe Water Enhancer Industry Volume (K Litres) Forecast, by Application 2019 & 2032
- Table 13: Italy Europe Water Enhancer Industry Revenue (Million) Forecast, by Application 2019 & 2032
- Table 14: Italy Europe Water Enhancer Industry Volume (K Litres) Forecast, by Application 2019 & 2032
- Table 15: United Kingdom Europe Water Enhancer Industry Revenue (Million) Forecast, by Application 2019 & 2032
- Table 16: United Kingdom Europe Water Enhancer Industry Volume (K Litres) Forecast, by Application 2019 & 2032
- Table 17: Netherlands Europe Water Enhancer Industry Revenue (Million) Forecast, by Application 2019 & 2032
- Table 18: Netherlands Europe Water Enhancer Industry Volume (K Litres) Forecast, by Application 2019 & 2032
- Table 19: Sweden Europe Water Enhancer Industry Revenue (Million) Forecast, by Application 2019 & 2032
- Table 20: Sweden Europe Water Enhancer Industry Volume (K Litres) Forecast, by Application 2019 & 2032
- Table 21: Rest of Europe Europe Water Enhancer Industry Revenue (Million) Forecast, by Application 2019 & 2032
- Table 22: Rest of Europe Europe Water Enhancer Industry Volume (K Litres) Forecast, by Application 2019 & 2032
- Table 23: Europe Water Enhancer Industry Revenue Million Forecast, by Distribution Channel 2019 & 2032
- Table 24: Europe Water Enhancer Industry Volume K Litres Forecast, by Distribution Channel 2019 & 2032
- Table 25: Europe Water Enhancer Industry Revenue Million Forecast, by Country 2019 & 2032
- Table 26: Europe Water Enhancer Industry Volume K Litres Forecast, by Country 2019 & 2032
- Table 27: United Kingdom Europe Water Enhancer Industry Revenue (Million) Forecast, by Application 2019 & 2032
- Table 28: United Kingdom Europe Water Enhancer Industry Volume (K Litres) Forecast, by Application 2019 & 2032
- Table 29: Germany Europe Water Enhancer Industry Revenue (Million) Forecast, by Application 2019 & 2032
- Table 30: Germany Europe Water Enhancer Industry Volume (K Litres) Forecast, by Application 2019 & 2032
- Table 31: France Europe Water Enhancer Industry Revenue (Million) Forecast, by Application 2019 & 2032
- Table 32: France Europe Water Enhancer Industry Volume (K Litres) Forecast, by Application 2019 & 2032
- Table 33: Italy Europe Water Enhancer Industry Revenue (Million) Forecast, by Application 2019 & 2032
- Table 34: Italy Europe Water Enhancer Industry Volume (K Litres) Forecast, by Application 2019 & 2032
- Table 35: Spain Europe Water Enhancer Industry Revenue (Million) Forecast, by Application 2019 & 2032
- Table 36: Spain Europe Water Enhancer Industry Volume (K Litres) Forecast, by Application 2019 & 2032
- Table 37: Netherlands Europe Water Enhancer Industry Revenue (Million) Forecast, by Application 2019 & 2032
- Table 38: Netherlands Europe Water Enhancer Industry Volume (K Litres) Forecast, by Application 2019 & 2032
- Table 39: Belgium Europe Water Enhancer Industry Revenue (Million) Forecast, by Application 2019 & 2032
- Table 40: Belgium Europe Water Enhancer Industry Volume (K Litres) Forecast, by Application 2019 & 2032
- Table 41: Sweden Europe Water Enhancer Industry Revenue (Million) Forecast, by Application 2019 & 2032
- Table 42: Sweden Europe Water Enhancer Industry Volume (K Litres) Forecast, by Application 2019 & 2032
- Table 43: Norway Europe Water Enhancer Industry Revenue (Million) Forecast, by Application 2019 & 2032
- Table 44: Norway Europe Water Enhancer Industry Volume (K Litres) Forecast, by Application 2019 & 2032
- Table 45: Poland Europe Water Enhancer Industry Revenue (Million) Forecast, by Application 2019 & 2032
- Table 46: Poland Europe Water Enhancer Industry Volume (K Litres) Forecast, by Application 2019 & 2032
- Table 47: Denmark Europe Water Enhancer Industry Revenue (Million) Forecast, by Application 2019 & 2032
- Table 48: Denmark Europe Water Enhancer Industry Volume (K Litres) Forecast, by Application 2019 & 2032
Frequently Asked Questions
1. What is the projected Compound Annual Growth Rate (CAGR) of the Europe Water Enhancer Industry?
The projected CAGR is approximately 6.21%.
2. Which companies are prominent players in the Europe Water Enhancer Industry?
Key companies in the market include Dyla LLC (Stur), Protekt, Vimto Soft Drinks, PepsiCo Inc, The Hut com Ltd (Exhante), The Kraft Heinz Company, The Coca-Cola Company, Pure Flavour GmbH, DreamPak*List Not Exhaustive, Wisdom Natural Brands.
3. What are the main segments of the Europe Water Enhancer Industry?
The market segments include Distribution Channel.
4. Can you provide details about the market size?
The market size is estimated to be USD 1.08 Million as of 2022.
5. What are some drivers contributing to market growth?
Increasing Sports Participation; Increasing Awareness about Health and Fitness.
6. What are the notable trends driving market growth?
Rising Demand for Non-Carbonated Beverages.
7. Are there any restraints impacting market growth?
Adverse Effects of Overconsumption of Products.
8. Can you provide examples of recent developments in the market?
In 2022, Robinsons launched new Benefit Drops in four flavors. Each with a different added functional benefit, the Britvic-owned range offers shoppers a convenient and tasty way to gain additional vitamins while on the move. It helps consumers make tastier, healthier choices in line with Britvic’s long-term Healthier People strategy.
9. What pricing options are available for accessing the report?
Pricing options include single-user, multi-user, and enterprise licenses priced at USD 4750, USD 5250, and USD 8750 respectively.
10. Is the market size provided in terms of value or volume?
The market size is provided in terms of value, measured in Million and volume, measured in K Litres.
11. Are there any specific market keywords associated with the report?
Yes, the market keyword associated with the report is "Europe Water Enhancer Industry," which aids in identifying and referencing the specific market segment covered.
12. How do I determine which pricing option suits my needs best?
The pricing options vary based on user requirements and access needs. Individual users may opt for single-user licenses, while businesses requiring broader access may choose multi-user or enterprise licenses for cost-effective access to the report.
13. Are there any additional resources or data provided in the Europe Water Enhancer Industry report?
While the report offers comprehensive insights, it's advisable to review the specific contents or supplementary materials provided to ascertain if additional resources or data are available.
14. How can I stay updated on further developments or reports in the Europe Water Enhancer Industry?
To stay informed about further developments, trends, and reports in the Europe Water Enhancer Industry, consider subscribing to industry newsletters, following relevant companies and organizations, or regularly checking reputable industry news sources and publications.
Methodology
Step 1 - Identification of Relevant Samples Size from Population Database


Step 2 - Approaches for Defining Global Market Size (Value, Volume* & Price*)

Note*: In applicable scenarios
Step 3 - Data Sources
Primary Research
- Web Analytics
- Survey Reports
- Research Institute
- Latest Research Reports
- Opinion Leaders
Secondary Research
- Annual Reports
- White Paper
- Latest Press Release
- Industry Association
- Paid Database
- Investor Presentations

Step 4 - Data Triangulation
Involves using different sources of information in order to increase the validity of a study
These sources are likely to be stakeholders in a program - participants, other researchers, program staff, other community members, and so on.
Then we put all data in single framework & apply various statistical tools to find out the dynamic on the market.
During the analysis stage, feedback from the stakeholder groups would be compared to determine areas of agreement as well as areas of divergence


