
Key Insights
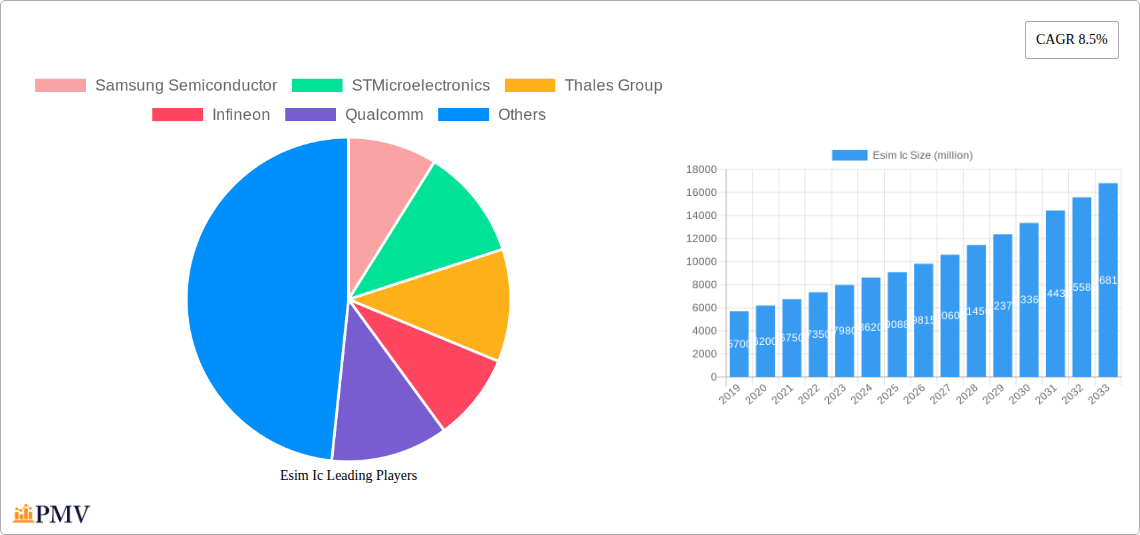
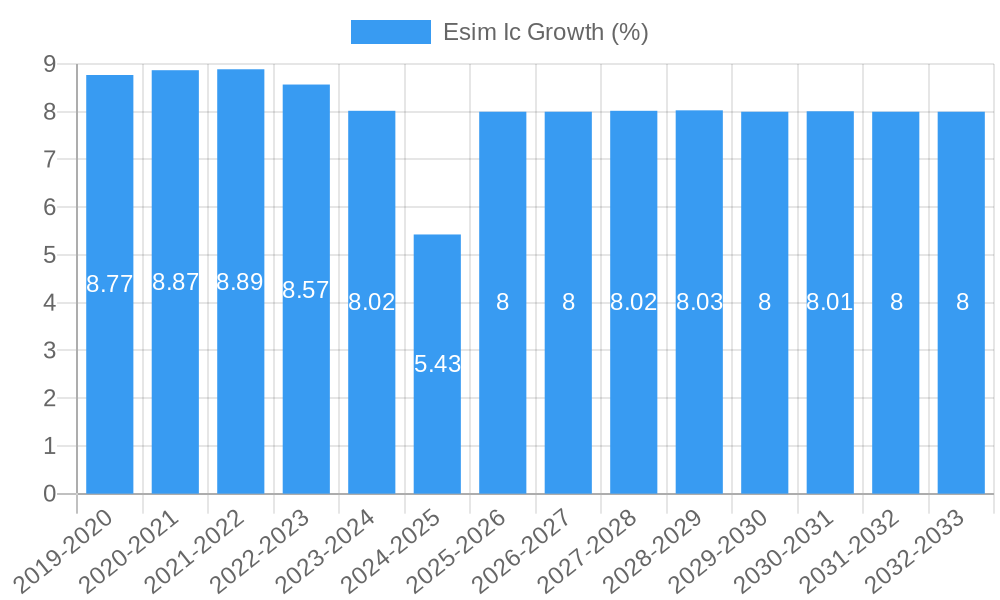
The Esim IC market is poised for substantial growth, projected to reach a market size of approximately $9,088 million by 2025, driven by a robust Compound Annual Growth Rate (CAGR) of 8.5%. This expansion is primarily fueled by the accelerating adoption of eSIM technology across diverse applications, most notably in consumer electronics and the automotive sector. The inherent benefits of eSIMs, such as remote provisioning, enhanced security, and space-saving designs, are making them increasingly indispensable for modern connected devices. In consumer electronics, smartwatches, tablets, and IoT devices are leading the charge, enabling seamless connectivity without the need for physical SIM cards. The automotive industry is also embracing eSIMs for telematics, in-car entertainment systems, and vehicle-to-everything (V2X) communication, thereby improving vehicle functionality and safety. Emerging trends like the proliferation of 5G networks and the burgeoning Internet of Things (IoT) ecosystem are further amplifying demand, creating a fertile ground for innovation and market penetration.
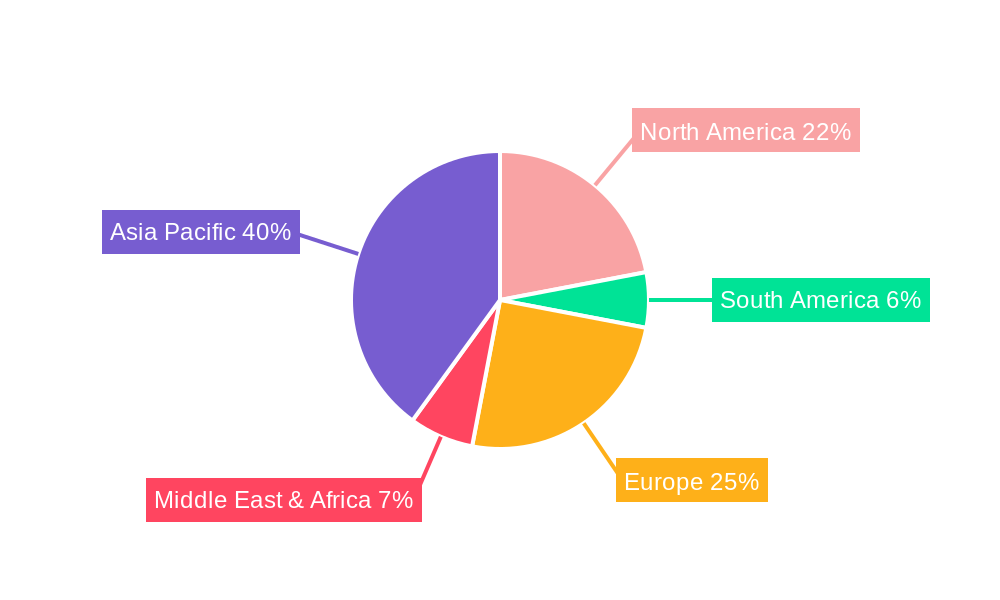
Despite the strong growth trajectory, the market faces certain restraints, including the initial integration costs for manufacturers and the need for widespread consumer understanding and acceptance of eSIM technology. However, these challenges are expected to be largely overcome as the technology matures and economies of scale reduce production expenses. Key players like Samsung Semiconductor, STMicroelectronics, Thales Group, and Infineon are at the forefront of this market, investing heavily in research and development to offer advanced eSIM solutions. The competitive landscape is also characterized by a strong presence of Chinese manufacturers such as Huawei Hisilicon and Spreadtrum Communications, indicating a dynamic global market. Geographically, Asia Pacific, led by China and India, is anticipated to be a significant growth engine due to its vast manufacturing capabilities and rapidly expanding consumer base for smart devices and IoT solutions. North America and Europe also represent mature markets with high adoption rates for advanced connectivity technologies.
Esim Ic Market: Comprehensive Analysis & Future Outlook (2019–2033)
This definitive Esim Ic market report provides an in-depth analysis of the global Esim Ic industry, offering crucial insights for stakeholders, investors, and industry professionals. Covering the historical period from 2019 to 2024, the base year of 2025, and an extensive forecast period up to 2033, this report details market size, segmentation, key trends, competitive landscape, and future growth trajectories. With a focus on Esim Ic applications in Consumer Electronics, Automotive, and Other sectors, and Esim Ic types including Contact Chip and Contactless Chip, this study equips you with the actionable intelligence needed to navigate this dynamic market.
Esim Ic Market Structure & Competitive Dynamics
The Esim Ic market is characterized by a moderately consolidated structure, with a few key players dominating a significant portion of the market share. Innovation ecosystems are vibrant, driven by intense R&D efforts from semiconductor giants and specialized Esim Ic manufacturers. Regulatory frameworks, particularly around data security and interoperability standards, are evolving and play a crucial role in shaping market entry and product development. Product substitutes, such as traditional physical SIM cards, are gradually being phased out in favor of Esim Ic solutions, especially in newer device categories. End-user trends are strongly favoring the convenience, security, and remote provisioning capabilities offered by Esim Ic technology, driving adoption across various consumer and enterprise applications. Mergers and acquisitions (M&A) activities are strategic, aimed at consolidating market positions, acquiring complementary technologies, and expanding geographical reach. M&A deal values are projected to grow significantly as companies seek to enhance their competitive edge in this burgeoning market. The overall market concentration is influenced by patent landscapes and the cost-effectiveness of Esim Ic chip manufacturing.
- Market Share Analysis: Leading companies hold substantial market shares, indicating a competitive but somewhat oligopolistic environment.
- Innovation Ecosystems: Collaboration between hardware manufacturers, software providers, and mobile network operators is crucial for fostering Esim Ic adoption.
- Regulatory Frameworks: Compliance with international standards and national regulations is paramount for market success.
- Product Substitutes: The gradual decline of physical SIM cards highlights the superior value proposition of Esim Ic.
- End-User Trends: Demand is surging due to enhanced user experience and seamless device connectivity.
- M&A Activities: Strategic consolidations are expected to accelerate, with estimated deal values reaching several million.
Esim Ic Industry Trends & Insights
The Esim Ic industry is experiencing robust growth, propelled by several interconnected trends. The escalating demand for connected devices across the Internet of Things (IoT) landscape is a primary market growth driver. As the number of connected devices, from smart wearables to industrial sensors, continues to skyrocket, the need for efficient and secure connectivity solutions like Esim Ic becomes indispensable. Technological disruptions, including advancements in miniaturization, power efficiency, and enhanced security protocols for Esim Ic chips, are further fueling adoption. The integration of Esim Ic into a wider range of consumer electronics, such as smartphones, tablets, smartwatches, and even laptops, is broadening its market penetration. Furthermore, the automotive sector is increasingly adopting Esim Ic for in-car connectivity, telematics, and over-the-air (OTA) updates, marking a significant expansion beyond traditional consumer electronics.
Consumer preferences are shifting towards the convenience of remote SIM provisioning, eliminating the need for physical SIM card swaps and enabling instant connectivity for new devices or multiple mobile plans. This seamless user experience is a key competitive differentiator. The competitive dynamics within the Esim Ic sector are intensifying, with established semiconductor manufacturers and emerging specialized players vying for market dominance. Strategies include developing embedded Esim Ic solutions for mass production, enhancing the security features of Esim Ic chips to meet stringent industry requirements, and fostering partnerships with mobile network operators globally to ensure broad compatibility and service availability. The market penetration of Esim Ic technology is projected to continue its upward trajectory, reaching an impressive percentage within the forecast period. The compound annual growth rate (CAGR) for the Esim Ic market is estimated to be robust, reflecting the sustained demand and technological advancements driving this sector. Companies are investing heavily in research and development to offer more secure, cost-effective, and feature-rich Esim Ic solutions, further solidifying the industry's growth momentum. The ongoing digitalization across various sectors necessitates advanced connectivity, positioning Esim Ic at the forefront of this transformation.
Dominant Markets & Segments in Esim Ic
The Esim Ic market exhibits clear dominance in specific regions and application segments. Asia Pacific, particularly China and South Korea, is a leading region due to its massive consumer electronics manufacturing base and rapid adoption of new technologies. The economic policies in these countries have fostered significant investment in semiconductor R&D and manufacturing, creating a fertile ground for Esim Ic innovation and deployment. Within the Application segments, Consumer Electronics currently holds the largest market share. This dominance is driven by the widespread integration of Esim Ic in smartphones, smartwatches, tablets, and other personal devices, offering consumers unparalleled convenience and flexibility in managing their mobile subscriptions. The economic policies supporting the growth of the consumer electronics industry, coupled with strong consumer demand for feature-rich and connected devices, are key drivers.
The Automotive segment is emerging as a significant growth area, with increasing adoption of Esim Ic for telematics, infotainment systems, and autonomous driving features. Government initiatives promoting connected car technologies and the push for enhanced safety and convenience in vehicles are fueling this expansion. The infrastructure development in emerging economies is also indirectly supporting the growth of Esim Ic by enabling wider connectivity for vehicles. In terms of Type, Contactless Chip solutions are projected to witness substantial growth and are expected to become dominant in the long term. This is primarily due to their inherent security advantages and their suitability for a wide range of applications where physical contact is not practical or desirable, such as in IoT devices and secure payment systems. The inherent advantages of contactless technology, including speed and ease of use, align perfectly with modern technological demands.
- Regional Dominance: Asia Pacific leads due to strong manufacturing capabilities and early adoption.
- Application Dominance (Consumer Electronics): Driven by smartphones, wearables, and tablets, with supportive economic policies.
- Application Growth (Automotive): Fueled by connected car technologies and safety features, supported by government initiatives.
- Type Dominance (Contactless Chip): Projected to grow due to superior security and versatility in diverse applications.
- Key Drivers: Economic policies, infrastructure development, consumer demand, and technological advancements.
Esim Ic Product Innovations
Product innovations in the Esim Ic market are focused on enhancing security, miniaturization, power efficiency, and interoperability. Manufacturers are developing advanced Esim Ic chips with robust cryptographic capabilities to safeguard sensitive user data and prevent unauthorized access. The trend towards smaller form factors is enabling the integration of Esim Ic into an even wider array of compact devices. Furthermore, significant advancements are being made in reducing the power consumption of Esim Ic solutions, which is crucial for battery-operated devices like wearables and IoT sensors. The development of standardized Esim Ic platforms is simplifying integration for device manufacturers and enabling seamless transitions for mobile network operators. These innovations provide competitive advantages by enabling new use cases and improving the overall user experience, positioning Esim Ic as a cornerstone of future connectivity.
Report Segmentation & Scope
This report meticulously segments the Esim Ic market across key applications and chip types.
Application Segments:
- Consumer Electronics: This segment, encompassing smartphones, tablets, smartwatches, and other personal devices, is projected to witness steady growth, driven by the continuous innovation in the connected consumer device market. Its market size is estimated to be in the millions.
- Automotive: The automotive segment is poised for rapid expansion as Esim Ic finds increasing application in telematics, in-car connectivity, and autonomous driving systems. Growth projections for this segment are significant, with market sizes in the millions.
- Other: This broad category includes industrial IoT devices, enterprise solutions, healthcare wearables, and smart grid applications, all contributing to a substantial and growing market size in the millions.
Type Segments:
- Contact Chip: While historically significant, the market for traditional contact Esim Ic is expected to see moderate growth, with market sizes in the millions.
- Contactless Chip: This segment is anticipated to experience robust expansion, driven by its versatility and suitability for a wide range of modern applications, with market sizes projected to reach millions.
Key Drivers of Esim Ic Growth
The global Esim Ic market is experiencing significant growth driven by several compelling factors. The relentless expansion of the Internet of Things (IoT) is a primary catalyst, as billions of devices require secure and seamless connectivity solutions. Technological advancements in semiconductor manufacturing, leading to smaller, more power-efficient, and cost-effective Esim Ic chips, are further accelerating adoption. Growing consumer demand for convenience and flexibility in managing mobile subscriptions, without the need for physical SIM swaps, is a major behavioral driver. Furthermore, evolving regulatory frameworks that promote digital identity and data security are creating a more favorable environment for Esim Ic deployment. Government initiatives aimed at fostering digital transformation and smart infrastructure also contribute to the market's upward trajectory.
Challenges in the Esim Ic Sector
Despite the positive growth outlook, the Esim Ic sector faces several challenges. Regulatory hurdles related to SIM interoperability and data privacy across different regions can slow down widespread adoption. Complexities in the supply chain and the need for specialized manufacturing processes can lead to production bottlenecks and increased costs. Intense competitive pressure among established players and new entrants can impact pricing and profitability. Ensuring robust security measures against sophisticated cyber threats remains a continuous challenge, requiring ongoing investment in R&D and stringent validation processes. The initial cost of Esim Ic integration for some device manufacturers can also act as a restraint, although this is expected to decrease with economies of scale.
Leading Players in the Esim Ic Market
- Samsung Semiconductor
- STMicroelectronics
- Thales Group
- Infineon
- Qualcomm
- Huawei Hisilicon
- Spreadtrum Communications
- China Mobile IoT Company Limit
- Tongxin Microelectronics Co., Ltd.
- Wuhan Tianyu Information Industry Co., Ltd.
- Shenzhen Cmpyun
Key Developments in Esim Ic Sector
- 2023/06: Thales Group launches a new generation of Esim Ic with enhanced security features for automotive applications.
- 2023/10: STMicroelectronics announces a strategic partnership with a major telecommunications provider to expand Esim Ic deployment in consumer electronics.
- 2024/01: Qualcomm introduces a new chipset with integrated Esim Ic capabilities, targeting the growing wearable device market.
- 2024/03: Infineon expands its Esim Ic portfolio with ultra-low power solutions for long-life IoT devices.
- 2024/07: Major mobile network operators begin phasing out physical SIM card support for new device activations, accelerating Esim Ic adoption.
- 2025/01: Industry consortium announces new interoperability standards for Esim Ic, aiming to simplify global deployment.
Strategic Esim Ic Market Outlook
The strategic outlook for the Esim Ic market is exceptionally promising, driven by its integral role in the expanding digital ecosystem. Growth accelerators include the continued proliferation of connected devices, the increasing demand for enhanced security and user convenience, and the ongoing innovation in semiconductor technology. The automotive sector's embrace of Esim Ic for advanced functionalities presents a significant strategic opportunity. As more industries recognize the benefits of seamless connectivity and remote management, the market is poised for sustained expansion. Strategic investments in R&D, partnerships with key industry stakeholders, and a focus on developing solutions for emerging applications like 5G and beyond will be crucial for capturing future market potential. The transition towards fully digital SIM solutions is inevitable, making Esim Ic a critical component for future technological advancements.
Esim Ic Segmentation
-
1. Application
- 1.1. Consumer Electronics
- 1.2. Automotive
- 1.3. Other
-
2. Type
- 2.1. Contact Chip
- 2.2. Contactless Chip
Esim Ic Segmentation By Geography
-
1. North America
- 1.1. United States
- 1.2. Canada
- 1.3. Mexico
-
2. South America
- 2.1. Brazil
- 2.2. Argentina
- 2.3. Rest of South America
-
3. Europe
- 3.1. United Kingdom
- 3.2. Germany
- 3.3. France
- 3.4. Italy
- 3.5. Spain
- 3.6. Russia
- 3.7. Benelux
- 3.8. Nordics
- 3.9. Rest of Europe
-
4. Middle East & Africa
- 4.1. Turkey
- 4.2. Israel
- 4.3. GCC
- 4.4. North Africa
- 4.5. South Africa
- 4.6. Rest of Middle East & Africa
-
5. Asia Pacific
- 5.1. China
- 5.2. India
- 5.3. Japan
- 5.4. South Korea
- 5.5. ASEAN
- 5.6. Oceania
- 5.7. Rest of Asia Pacific
Esim Ic REPORT HIGHLIGHTS
| Aspects | Details |
|---|---|
| Study Period | 2019-2033 |
| Base Year | 2024 |
| Estimated Year | 2025 |
| Forecast Period | 2025-2033 |
| Historical Period | 2019-2024 |
| Growth Rate | CAGR of 8.5% from 2019-2033 |
| Segmentation |
|
Table of Contents
- 1. Introduction
- 1.1. Research Scope
- 1.2. Market Segmentation
- 1.3. Research Methodology
- 1.4. Definitions and Assumptions
- 2. Executive Summary
- 2.1. Introduction
- 3. Market Dynamics
- 3.1. Introduction
- 3.2. Market Drivers
- 3.3. Market Restrains
- 3.4. Market Trends
- 4. Market Factor Analysis
- 4.1. Porters Five Forces
- 4.2. Supply/Value Chain
- 4.3. PESTEL analysis
- 4.4. Market Entropy
- 4.5. Patent/Trademark Analysis
- 5. Global Esim Ic Analysis, Insights and Forecast, 2019-2031
- 5.1. Market Analysis, Insights and Forecast - by Application
- 5.1.1. Consumer Electronics
- 5.1.2. Automotive
- 5.1.3. Other
- 5.2. Market Analysis, Insights and Forecast - by Type
- 5.2.1. Contact Chip
- 5.2.2. Contactless Chip
- 5.3. Market Analysis, Insights and Forecast - by Region
- 5.3.1. North America
- 5.3.2. South America
- 5.3.3. Europe
- 5.3.4. Middle East & Africa
- 5.3.5. Asia Pacific
- 5.1. Market Analysis, Insights and Forecast - by Application
- 6. North America Esim Ic Analysis, Insights and Forecast, 2019-2031
- 6.1. Market Analysis, Insights and Forecast - by Application
- 6.1.1. Consumer Electronics
- 6.1.2. Automotive
- 6.1.3. Other
- 6.2. Market Analysis, Insights and Forecast - by Type
- 6.2.1. Contact Chip
- 6.2.2. Contactless Chip
- 6.1. Market Analysis, Insights and Forecast - by Application
- 7. South America Esim Ic Analysis, Insights and Forecast, 2019-2031
- 7.1. Market Analysis, Insights and Forecast - by Application
- 7.1.1. Consumer Electronics
- 7.1.2. Automotive
- 7.1.3. Other
- 7.2. Market Analysis, Insights and Forecast - by Type
- 7.2.1. Contact Chip
- 7.2.2. Contactless Chip
- 7.1. Market Analysis, Insights and Forecast - by Application
- 8. Europe Esim Ic Analysis, Insights and Forecast, 2019-2031
- 8.1. Market Analysis, Insights and Forecast - by Application
- 8.1.1. Consumer Electronics
- 8.1.2. Automotive
- 8.1.3. Other
- 8.2. Market Analysis, Insights and Forecast - by Type
- 8.2.1. Contact Chip
- 8.2.2. Contactless Chip
- 8.1. Market Analysis, Insights and Forecast - by Application
- 9. Middle East & Africa Esim Ic Analysis, Insights and Forecast, 2019-2031
- 9.1. Market Analysis, Insights and Forecast - by Application
- 9.1.1. Consumer Electronics
- 9.1.2. Automotive
- 9.1.3. Other
- 9.2. Market Analysis, Insights and Forecast - by Type
- 9.2.1. Contact Chip
- 9.2.2. Contactless Chip
- 9.1. Market Analysis, Insights and Forecast - by Application
- 10. Asia Pacific Esim Ic Analysis, Insights and Forecast, 2019-2031
- 10.1. Market Analysis, Insights and Forecast - by Application
- 10.1.1. Consumer Electronics
- 10.1.2. Automotive
- 10.1.3. Other
- 10.2. Market Analysis, Insights and Forecast - by Type
- 10.2.1. Contact Chip
- 10.2.2. Contactless Chip
- 10.1. Market Analysis, Insights and Forecast - by Application
- 11. Competitive Analysis
- 11.1. Global Market Share Analysis 2024
- 11.2. Company Profiles
- 11.2.1 Samsung Semiconductor
- 11.2.1.1. Overview
- 11.2.1.2. Products
- 11.2.1.3. SWOT Analysis
- 11.2.1.4. Recent Developments
- 11.2.1.5. Financials (Based on Availability)
- 11.2.2 STMicroelectronics
- 11.2.2.1. Overview
- 11.2.2.2. Products
- 11.2.2.3. SWOT Analysis
- 11.2.2.4. Recent Developments
- 11.2.2.5. Financials (Based on Availability)
- 11.2.3 Thales Group
- 11.2.3.1. Overview
- 11.2.3.2. Products
- 11.2.3.3. SWOT Analysis
- 11.2.3.4. Recent Developments
- 11.2.3.5. Financials (Based on Availability)
- 11.2.4 Infineon
- 11.2.4.1. Overview
- 11.2.4.2. Products
- 11.2.4.3. SWOT Analysis
- 11.2.4.4. Recent Developments
- 11.2.4.5. Financials (Based on Availability)
- 11.2.5 Qualcomm
- 11.2.5.1. Overview
- 11.2.5.2. Products
- 11.2.5.3. SWOT Analysis
- 11.2.5.4. Recent Developments
- 11.2.5.5. Financials (Based on Availability)
- 11.2.6 Huawei Hisilicon
- 11.2.6.1. Overview
- 11.2.6.2. Products
- 11.2.6.3. SWOT Analysis
- 11.2.6.4. Recent Developments
- 11.2.6.5. Financials (Based on Availability)
- 11.2.7 Spreadtrum Communications
- 11.2.7.1. Overview
- 11.2.7.2. Products
- 11.2.7.3. SWOT Analysis
- 11.2.7.4. Recent Developments
- 11.2.7.5. Financials (Based on Availability)
- 11.2.8 China Mobile IoT Company Limit
- 11.2.8.1. Overview
- 11.2.8.2. Products
- 11.2.8.3. SWOT Analysis
- 11.2.8.4. Recent Developments
- 11.2.8.5. Financials (Based on Availability)
- 11.2.9 Tongxin Microelectronics Co. Ltd.
- 11.2.9.1. Overview
- 11.2.9.2. Products
- 11.2.9.3. SWOT Analysis
- 11.2.9.4. Recent Developments
- 11.2.9.5. Financials (Based on Availability)
- 11.2.10 Wuhan Tianyu Information Industry Co. Ltd.
- 11.2.10.1. Overview
- 11.2.10.2. Products
- 11.2.10.3. SWOT Analysis
- 11.2.10.4. Recent Developments
- 11.2.10.5. Financials (Based on Availability)
- 11.2.11 Shenzhen Cmpyun
- 11.2.11.1. Overview
- 11.2.11.2. Products
- 11.2.11.3. SWOT Analysis
- 11.2.11.4. Recent Developments
- 11.2.11.5. Financials (Based on Availability)
- 11.2.1 Samsung Semiconductor
List of Figures
- Figure 1: Global Esim Ic Revenue Breakdown (million, %) by Region 2024 & 2032
- Figure 2: Global Esim Ic Volume Breakdown (K, %) by Region 2024 & 2032
- Figure 3: North America Esim Ic Revenue (million), by Application 2024 & 2032
- Figure 4: North America Esim Ic Volume (K), by Application 2024 & 2032
- Figure 5: North America Esim Ic Revenue Share (%), by Application 2024 & 2032
- Figure 6: North America Esim Ic Volume Share (%), by Application 2024 & 2032
- Figure 7: North America Esim Ic Revenue (million), by Type 2024 & 2032
- Figure 8: North America Esim Ic Volume (K), by Type 2024 & 2032
- Figure 9: North America Esim Ic Revenue Share (%), by Type 2024 & 2032
- Figure 10: North America Esim Ic Volume Share (%), by Type 2024 & 2032
- Figure 11: North America Esim Ic Revenue (million), by Country 2024 & 2032
- Figure 12: North America Esim Ic Volume (K), by Country 2024 & 2032
- Figure 13: North America Esim Ic Revenue Share (%), by Country 2024 & 2032
- Figure 14: North America Esim Ic Volume Share (%), by Country 2024 & 2032
- Figure 15: South America Esim Ic Revenue (million), by Application 2024 & 2032
- Figure 16: South America Esim Ic Volume (K), by Application 2024 & 2032
- Figure 17: South America Esim Ic Revenue Share (%), by Application 2024 & 2032
- Figure 18: South America Esim Ic Volume Share (%), by Application 2024 & 2032
- Figure 19: South America Esim Ic Revenue (million), by Type 2024 & 2032
- Figure 20: South America Esim Ic Volume (K), by Type 2024 & 2032
- Figure 21: South America Esim Ic Revenue Share (%), by Type 2024 & 2032
- Figure 22: South America Esim Ic Volume Share (%), by Type 2024 & 2032
- Figure 23: South America Esim Ic Revenue (million), by Country 2024 & 2032
- Figure 24: South America Esim Ic Volume (K), by Country 2024 & 2032
- Figure 25: South America Esim Ic Revenue Share (%), by Country 2024 & 2032
- Figure 26: South America Esim Ic Volume Share (%), by Country 2024 & 2032
- Figure 27: Europe Esim Ic Revenue (million), by Application 2024 & 2032
- Figure 28: Europe Esim Ic Volume (K), by Application 2024 & 2032
- Figure 29: Europe Esim Ic Revenue Share (%), by Application 2024 & 2032
- Figure 30: Europe Esim Ic Volume Share (%), by Application 2024 & 2032
- Figure 31: Europe Esim Ic Revenue (million), by Type 2024 & 2032
- Figure 32: Europe Esim Ic Volume (K), by Type 2024 & 2032
- Figure 33: Europe Esim Ic Revenue Share (%), by Type 2024 & 2032
- Figure 34: Europe Esim Ic Volume Share (%), by Type 2024 & 2032
- Figure 35: Europe Esim Ic Revenue (million), by Country 2024 & 2032
- Figure 36: Europe Esim Ic Volume (K), by Country 2024 & 2032
- Figure 37: Europe Esim Ic Revenue Share (%), by Country 2024 & 2032
- Figure 38: Europe Esim Ic Volume Share (%), by Country 2024 & 2032
- Figure 39: Middle East & Africa Esim Ic Revenue (million), by Application 2024 & 2032
- Figure 40: Middle East & Africa Esim Ic Volume (K), by Application 2024 & 2032
- Figure 41: Middle East & Africa Esim Ic Revenue Share (%), by Application 2024 & 2032
- Figure 42: Middle East & Africa Esim Ic Volume Share (%), by Application 2024 & 2032
- Figure 43: Middle East & Africa Esim Ic Revenue (million), by Type 2024 & 2032
- Figure 44: Middle East & Africa Esim Ic Volume (K), by Type 2024 & 2032
- Figure 45: Middle East & Africa Esim Ic Revenue Share (%), by Type 2024 & 2032
- Figure 46: Middle East & Africa Esim Ic Volume Share (%), by Type 2024 & 2032
- Figure 47: Middle East & Africa Esim Ic Revenue (million), by Country 2024 & 2032
- Figure 48: Middle East & Africa Esim Ic Volume (K), by Country 2024 & 2032
- Figure 49: Middle East & Africa Esim Ic Revenue Share (%), by Country 2024 & 2032
- Figure 50: Middle East & Africa Esim Ic Volume Share (%), by Country 2024 & 2032
- Figure 51: Asia Pacific Esim Ic Revenue (million), by Application 2024 & 2032
- Figure 52: Asia Pacific Esim Ic Volume (K), by Application 2024 & 2032
- Figure 53: Asia Pacific Esim Ic Revenue Share (%), by Application 2024 & 2032
- Figure 54: Asia Pacific Esim Ic Volume Share (%), by Application 2024 & 2032
- Figure 55: Asia Pacific Esim Ic Revenue (million), by Type 2024 & 2032
- Figure 56: Asia Pacific Esim Ic Volume (K), by Type 2024 & 2032
- Figure 57: Asia Pacific Esim Ic Revenue Share (%), by Type 2024 & 2032
- Figure 58: Asia Pacific Esim Ic Volume Share (%), by Type 2024 & 2032
- Figure 59: Asia Pacific Esim Ic Revenue (million), by Country 2024 & 2032
- Figure 60: Asia Pacific Esim Ic Volume (K), by Country 2024 & 2032
- Figure 61: Asia Pacific Esim Ic Revenue Share (%), by Country 2024 & 2032
- Figure 62: Asia Pacific Esim Ic Volume Share (%), by Country 2024 & 2032
List of Tables
- Table 1: Global Esim Ic Revenue million Forecast, by Region 2019 & 2032
- Table 2: Global Esim Ic Volume K Forecast, by Region 2019 & 2032
- Table 3: Global Esim Ic Revenue million Forecast, by Application 2019 & 2032
- Table 4: Global Esim Ic Volume K Forecast, by Application 2019 & 2032
- Table 5: Global Esim Ic Revenue million Forecast, by Type 2019 & 2032
- Table 6: Global Esim Ic Volume K Forecast, by Type 2019 & 2032
- Table 7: Global Esim Ic Revenue million Forecast, by Region 2019 & 2032
- Table 8: Global Esim Ic Volume K Forecast, by Region 2019 & 2032
- Table 9: Global Esim Ic Revenue million Forecast, by Application 2019 & 2032
- Table 10: Global Esim Ic Volume K Forecast, by Application 2019 & 2032
- Table 11: Global Esim Ic Revenue million Forecast, by Type 2019 & 2032
- Table 12: Global Esim Ic Volume K Forecast, by Type 2019 & 2032
- Table 13: Global Esim Ic Revenue million Forecast, by Country 2019 & 2032
- Table 14: Global Esim Ic Volume K Forecast, by Country 2019 & 2032
- Table 15: United States Esim Ic Revenue (million) Forecast, by Application 2019 & 2032
- Table 16: United States Esim Ic Volume (K) Forecast, by Application 2019 & 2032
- Table 17: Canada Esim Ic Revenue (million) Forecast, by Application 2019 & 2032
- Table 18: Canada Esim Ic Volume (K) Forecast, by Application 2019 & 2032
- Table 19: Mexico Esim Ic Revenue (million) Forecast, by Application 2019 & 2032
- Table 20: Mexico Esim Ic Volume (K) Forecast, by Application 2019 & 2032
- Table 21: Global Esim Ic Revenue million Forecast, by Application 2019 & 2032
- Table 22: Global Esim Ic Volume K Forecast, by Application 2019 & 2032
- Table 23: Global Esim Ic Revenue million Forecast, by Type 2019 & 2032
- Table 24: Global Esim Ic Volume K Forecast, by Type 2019 & 2032
- Table 25: Global Esim Ic Revenue million Forecast, by Country 2019 & 2032
- Table 26: Global Esim Ic Volume K Forecast, by Country 2019 & 2032
- Table 27: Brazil Esim Ic Revenue (million) Forecast, by Application 2019 & 2032
- Table 28: Brazil Esim Ic Volume (K) Forecast, by Application 2019 & 2032
- Table 29: Argentina Esim Ic Revenue (million) Forecast, by Application 2019 & 2032
- Table 30: Argentina Esim Ic Volume (K) Forecast, by Application 2019 & 2032
- Table 31: Rest of South America Esim Ic Revenue (million) Forecast, by Application 2019 & 2032
- Table 32: Rest of South America Esim Ic Volume (K) Forecast, by Application 2019 & 2032
- Table 33: Global Esim Ic Revenue million Forecast, by Application 2019 & 2032
- Table 34: Global Esim Ic Volume K Forecast, by Application 2019 & 2032
- Table 35: Global Esim Ic Revenue million Forecast, by Type 2019 & 2032
- Table 36: Global Esim Ic Volume K Forecast, by Type 2019 & 2032
- Table 37: Global Esim Ic Revenue million Forecast, by Country 2019 & 2032
- Table 38: Global Esim Ic Volume K Forecast, by Country 2019 & 2032
- Table 39: United Kingdom Esim Ic Revenue (million) Forecast, by Application 2019 & 2032
- Table 40: United Kingdom Esim Ic Volume (K) Forecast, by Application 2019 & 2032
- Table 41: Germany Esim Ic Revenue (million) Forecast, by Application 2019 & 2032
- Table 42: Germany Esim Ic Volume (K) Forecast, by Application 2019 & 2032
- Table 43: France Esim Ic Revenue (million) Forecast, by Application 2019 & 2032
- Table 44: France Esim Ic Volume (K) Forecast, by Application 2019 & 2032
- Table 45: Italy Esim Ic Revenue (million) Forecast, by Application 2019 & 2032
- Table 46: Italy Esim Ic Volume (K) Forecast, by Application 2019 & 2032
- Table 47: Spain Esim Ic Revenue (million) Forecast, by Application 2019 & 2032
- Table 48: Spain Esim Ic Volume (K) Forecast, by Application 2019 & 2032
- Table 49: Russia Esim Ic Revenue (million) Forecast, by Application 2019 & 2032
- Table 50: Russia Esim Ic Volume (K) Forecast, by Application 2019 & 2032
- Table 51: Benelux Esim Ic Revenue (million) Forecast, by Application 2019 & 2032
- Table 52: Benelux Esim Ic Volume (K) Forecast, by Application 2019 & 2032
- Table 53: Nordics Esim Ic Revenue (million) Forecast, by Application 2019 & 2032
- Table 54: Nordics Esim Ic Volume (K) Forecast, by Application 2019 & 2032
- Table 55: Rest of Europe Esim Ic Revenue (million) Forecast, by Application 2019 & 2032
- Table 56: Rest of Europe Esim Ic Volume (K) Forecast, by Application 2019 & 2032
- Table 57: Global Esim Ic Revenue million Forecast, by Application 2019 & 2032
- Table 58: Global Esim Ic Volume K Forecast, by Application 2019 & 2032
- Table 59: Global Esim Ic Revenue million Forecast, by Type 2019 & 2032
- Table 60: Global Esim Ic Volume K Forecast, by Type 2019 & 2032
- Table 61: Global Esim Ic Revenue million Forecast, by Country 2019 & 2032
- Table 62: Global Esim Ic Volume K Forecast, by Country 2019 & 2032
- Table 63: Turkey Esim Ic Revenue (million) Forecast, by Application 2019 & 2032
- Table 64: Turkey Esim Ic Volume (K) Forecast, by Application 2019 & 2032
- Table 65: Israel Esim Ic Revenue (million) Forecast, by Application 2019 & 2032
- Table 66: Israel Esim Ic Volume (K) Forecast, by Application 2019 & 2032
- Table 67: GCC Esim Ic Revenue (million) Forecast, by Application 2019 & 2032
- Table 68: GCC Esim Ic Volume (K) Forecast, by Application 2019 & 2032
- Table 69: North Africa Esim Ic Revenue (million) Forecast, by Application 2019 & 2032
- Table 70: North Africa Esim Ic Volume (K) Forecast, by Application 2019 & 2032
- Table 71: South Africa Esim Ic Revenue (million) Forecast, by Application 2019 & 2032
- Table 72: South Africa Esim Ic Volume (K) Forecast, by Application 2019 & 2032
- Table 73: Rest of Middle East & Africa Esim Ic Revenue (million) Forecast, by Application 2019 & 2032
- Table 74: Rest of Middle East & Africa Esim Ic Volume (K) Forecast, by Application 2019 & 2032
- Table 75: Global Esim Ic Revenue million Forecast, by Application 2019 & 2032
- Table 76: Global Esim Ic Volume K Forecast, by Application 2019 & 2032
- Table 77: Global Esim Ic Revenue million Forecast, by Type 2019 & 2032
- Table 78: Global Esim Ic Volume K Forecast, by Type 2019 & 2032
- Table 79: Global Esim Ic Revenue million Forecast, by Country 2019 & 2032
- Table 80: Global Esim Ic Volume K Forecast, by Country 2019 & 2032
- Table 81: China Esim Ic Revenue (million) Forecast, by Application 2019 & 2032
- Table 82: China Esim Ic Volume (K) Forecast, by Application 2019 & 2032
- Table 83: India Esim Ic Revenue (million) Forecast, by Application 2019 & 2032
- Table 84: India Esim Ic Volume (K) Forecast, by Application 2019 & 2032
- Table 85: Japan Esim Ic Revenue (million) Forecast, by Application 2019 & 2032
- Table 86: Japan Esim Ic Volume (K) Forecast, by Application 2019 & 2032
- Table 87: South Korea Esim Ic Revenue (million) Forecast, by Application 2019 & 2032
- Table 88: South Korea Esim Ic Volume (K) Forecast, by Application 2019 & 2032
- Table 89: ASEAN Esim Ic Revenue (million) Forecast, by Application 2019 & 2032
- Table 90: ASEAN Esim Ic Volume (K) Forecast, by Application 2019 & 2032
- Table 91: Oceania Esim Ic Revenue (million) Forecast, by Application 2019 & 2032
- Table 92: Oceania Esim Ic Volume (K) Forecast, by Application 2019 & 2032
- Table 93: Rest of Asia Pacific Esim Ic Revenue (million) Forecast, by Application 2019 & 2032
- Table 94: Rest of Asia Pacific Esim Ic Volume (K) Forecast, by Application 2019 & 2032
Frequently Asked Questions
1. What is the projected Compound Annual Growth Rate (CAGR) of the Esim Ic?
The projected CAGR is approximately 8.5%.
2. Which companies are prominent players in the Esim Ic?
Key companies in the market include Samsung Semiconductor, STMicroelectronics, Thales Group, Infineon, Qualcomm, Huawei Hisilicon, Spreadtrum Communications, China Mobile IoT Company Limit, Tongxin Microelectronics Co., Ltd., Wuhan Tianyu Information Industry Co., Ltd., Shenzhen Cmpyun.
3. What are the main segments of the Esim Ic?
The market segments include Application, Type.
4. Can you provide details about the market size?
The market size is estimated to be USD 9088 million as of 2022.
5. What are some drivers contributing to market growth?
N/A
6. What are the notable trends driving market growth?
N/A
7. Are there any restraints impacting market growth?
N/A
8. Can you provide examples of recent developments in the market?
N/A
9. What pricing options are available for accessing the report?
Pricing options include single-user, multi-user, and enterprise licenses priced at USD 3950.00, USD 5925.00, and USD 7900.00 respectively.
10. Is the market size provided in terms of value or volume?
The market size is provided in terms of value, measured in million and volume, measured in K.
11. Are there any specific market keywords associated with the report?
Yes, the market keyword associated with the report is "Esim Ic," which aids in identifying and referencing the specific market segment covered.
12. How do I determine which pricing option suits my needs best?
The pricing options vary based on user requirements and access needs. Individual users may opt for single-user licenses, while businesses requiring broader access may choose multi-user or enterprise licenses for cost-effective access to the report.
13. Are there any additional resources or data provided in the Esim Ic report?
While the report offers comprehensive insights, it's advisable to review the specific contents or supplementary materials provided to ascertain if additional resources or data are available.
14. How can I stay updated on further developments or reports in the Esim Ic?
To stay informed about further developments, trends, and reports in the Esim Ic, consider subscribing to industry newsletters, following relevant companies and organizations, or regularly checking reputable industry news sources and publications.
Methodology
Step 1 - Identification of Relevant Samples Size from Population Database


Step 2 - Approaches for Defining Global Market Size (Value, Volume* & Price*)

Note*: In applicable scenarios
Step 3 - Data Sources
Primary Research
- Web Analytics
- Survey Reports
- Research Institute
- Latest Research Reports
- Opinion Leaders
Secondary Research
- Annual Reports
- White Paper
- Latest Press Release
- Industry Association
- Paid Database
- Investor Presentations

Step 4 - Data Triangulation
Involves using different sources of information in order to increase the validity of a study
These sources are likely to be stakeholders in a program - participants, other researchers, program staff, other community members, and so on.
Then we put all data in single framework & apply various statistical tools to find out the dynamic on the market.
During the analysis stage, feedback from the stakeholder groups would be compared to determine areas of agreement as well as areas of divergence


