


Key Insights
The MEMS Combo Interaction Sensor market is poised for substantial expansion, driven by increasing demand across key industries. This market is projected to reach $17.61 billion by 2025, exhibiting a Compound Annual Growth Rate (CAGR) of 4.6%. The integration of multiple sensing functionalities into compact, cost-effective units enhances performance and miniaturization, fueling adoption. The automotive sector's reliance on advanced driver-assistance systems (ADAS) and autonomous driving technologies is a significant growth catalyst. Consumer electronics, particularly wearables and smartphones, also contribute to market expansion due to the demand for smaller, smarter devices. Aerospace and defense industries are adopting these sensors for enhanced navigation, control, and safety systems. The burgeoning Internet of Things (IoT) and smart city initiatives present new growth opportunities, leveraging sensor data for real-time monitoring and control.

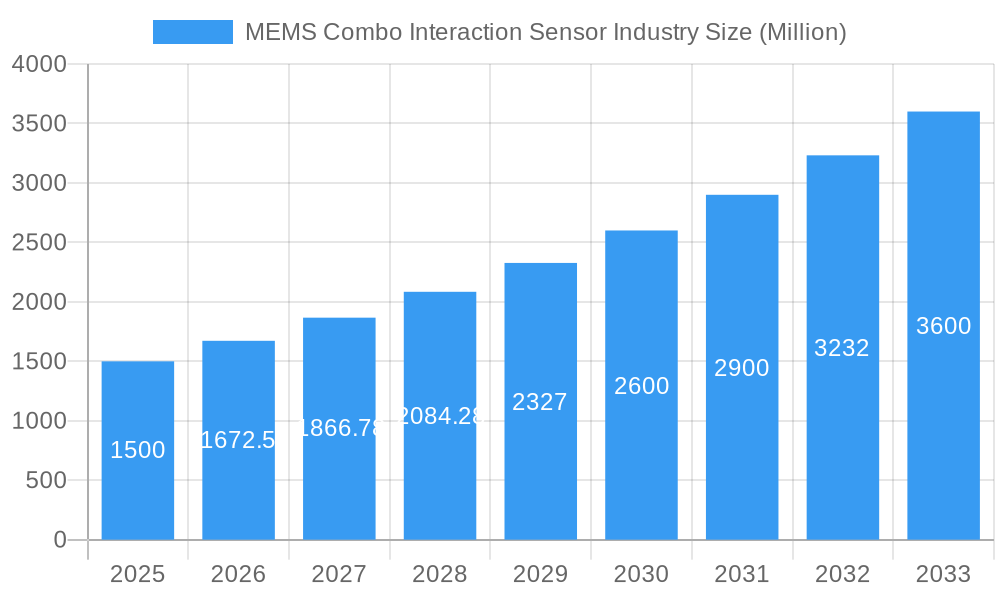
MEMS Combo Interaction Sensor Industry Market Size (In Billion)

Challenges include high initial development and manufacturing costs for complex MEMS sensors and potential competitive pressure from alternative sensing technologies. Market growth is geographically diverse, with North America and Asia-Pacific leading adoption. Segmentation by sensor type (Movement, Environment, Optical, Others) and end-user (Aerospace & Defense, Automotive, Consumer Electronics) highlights opportunities for specialized solutions. Continued innovation and the growing demand for connected devices are expected to drive significant market growth beyond the forecast period.
MEMS Combo Interaction Sensor Industry Company Market Share
MEMS Combo Interaction Sensor Industry Market Report: 2019-2033
This comprehensive report provides a detailed analysis of the MEMS Combo Interaction Sensor industry, offering invaluable insights for stakeholders, investors, and industry professionals. Covering the period from 2019 to 2033, with a focus on 2025, this report forecasts significant growth driven by technological advancements and increasing demand across diverse end-use sectors. The study period is 2019-2033, the base year is 2025, the estimated year is 2025, and the forecast period is 2025-2033. The historical period covered is 2019-2024.
MEMS Combo Interaction Sensor Industry Market Structure & Competitive Dynamics
The MEMS combo interaction sensor market is characterized by a moderately concentrated landscape with several key players vying for market share. Major players like Honeywell International Inc, Microchip Technology Inc, MEMSIC Inc, Bosch Sensortec GmbH, NXP Semiconductors, KIONIX Inc, Safran Colibrys SA, Murata Manufacturing Co Ltd, STMicroelectronics NV, Analog Devices Inc, InvenSense Inc, and Panasonic Corporation, along with several other smaller players, contribute to a competitive dynamic shaped by innovation and strategic acquisitions.
Market concentration is estimated at xx% in 2025, with the top 5 players holding approximately xx% of the global market share. The industry's innovation ecosystem is robust, with ongoing R&D investments driving advancements in sensor technology, miniaturization, and power efficiency. Regulatory frameworks, varying across regions, play a significant role in shaping product development and market access. The industry witnesses considerable M&A activity, with deal values totaling an estimated $xx Million in the past five years. These transactions often involve the acquisition of smaller sensor technology companies by larger players, broadening their product portfolios and geographical reach. Product substitutes, such as traditional sensor technologies, pose limited threat due to the superior performance and functionalities offered by MEMS combo sensors. End-user trends, particularly in the automotive and consumer electronics sectors, heavily influence market growth.
- Market Share (2025): Top 5 players - xx%; Remaining players - xx%
- M&A Deal Value (2020-2024): $xx Million
- Key Competitive Strategies: Innovation, M&A, strategic partnerships
MEMS Combo Interaction Sensor Industry Industry Trends & Insights
The MEMS combo interaction sensor market is experiencing robust growth, projected to reach $xx Million by 2033, exhibiting a Compound Annual Growth Rate (CAGR) of xx% during the forecast period (2025-2033). This expansion is driven primarily by the increasing demand for miniaturized, high-precision sensing solutions in diverse applications. Technological disruptions, such as the integration of artificial intelligence (AI) and machine learning (ML) algorithms with sensor data, are further accelerating market growth. Consumer preference shifts towards smarter, more interactive devices are propelling adoption across consumer electronics. Intense competition among industry players drives innovation and cost reduction, benefiting consumers. Market penetration in key end-user segments, such as automotive and consumer electronics, is expected to increase significantly in the coming years. The growing adoption of IoT (Internet of Things) devices is also contributing to the market growth. Specific examples of these trends include the rising demand for advanced driver-assistance systems (ADAS) in the automotive sector and the integration of MEMS combo sensors in wearable fitness trackers and smartphones.
Dominant Markets & Segments in MEMS Combo Interaction Sensor Industry
The automotive sector dominates the MEMS combo interaction sensor market, driven by the increasing adoption of advanced driver-assistance systems (ADAS) and the rising demand for enhanced vehicle safety features. The Asia-Pacific region is the leading geographical market, fueled by rapid industrialization, high consumer electronics adoption, and expanding automotive production.
By Type:
- Movement Combo Sensor: This segment holds the largest market share, primarily driven by its application in gaming devices, smartphones, and wearable technology. Key drivers include increasing demand for enhanced user interfaces and precise motion tracking capabilities.
- Environment Combo Sensor: This segment is witnessing steady growth, propelled by its use in smart home applications, industrial automation, and environmental monitoring. Key drivers include the growing popularity of smart homes and the increasing need for efficient environmental monitoring.
- Optical Combo Sensor: This segment holds a smaller market share but displays promising growth potential, particularly in augmented reality (AR) and virtual reality (VR) applications.
- Other Sensor Types: This includes a variety of sensors with smaller market shares individually but collectively contribute significantly to the overall market.
By End User:
- Automotive: The automotive sector is the dominant end-user, driven by the integration of MEMS combo sensors in ADAS systems, airbag deployments, and other safety features. Government regulations mandating advanced safety features are further boosting growth.
- Consumer Electronics: This segment is experiencing substantial growth due to the incorporation of MEMS combo sensors in smartphones, wearable devices, gaming controllers, and other interactive consumer electronics. The trend towards smarter and more interactive devices fuels this growth.
- Aerospace & Defense: This sector utilizes MEMS combo sensors for navigation, guidance, and stabilization systems in aircraft and military applications. The demand for advanced defense systems fuels this segment's growth.
- Other End Users: These include applications in healthcare, industrial automation, and environmental monitoring.
MEMS Combo Interaction Sensor Industry Product Innovations
Recent advancements in MEMS combo interaction sensor technology have focused on improving sensitivity, accuracy, power efficiency, and miniaturization. The integration of multiple sensing modalities within a single compact package enhances functionality and reduces the overall system cost. Innovative applications are emerging in areas such as gesture recognition, health monitoring, and precision industrial automation, demonstrating the versatility and expanding market potential of MEMS combo sensors. The development of MEMS 6-axis inertial sensors, like the MIC6100AL launched by MEMS in August 2022, showcases the progress in enhancing accuracy and responsiveness for interactive devices.
Report Segmentation & Scope
This report segments the MEMS combo interaction sensor market by type (Movement Combo Sensor, Environment Combo Sensor, Optical Combo Sensor, Other Sensor Type) and end-user (Aerospace & Defense, Automotive, Consumer Electronics, Water and Wastewater Management, Oil and Gas, Food and Beverage, Other End Users). Each segment's growth projections, market sizes, and competitive dynamics are analyzed in detail. The report offers a comprehensive understanding of market trends, opportunities, and challenges within each segment. It provides detailed information on market size, growth rate, and key players in each segment. For example, the automotive segment is projected to have significant growth due to the increased demand for ADAS systems, and the consumer electronics segment is expected to experience robust growth due to the integration of MEMS combo sensors into wearable devices and smartphones.
Key Drivers of MEMS Combo Interaction Sensor Growth
The MEMS combo interaction sensor market's growth is propelled by several key factors:
- Technological advancements: Continuous innovation in sensor technology, improving miniaturization, power efficiency, and sensitivity.
- Rising demand in various end-use sectors: Increased adoption in automotive, consumer electronics, and industrial automation.
- Government regulations and safety standards: Mandates for advanced safety features in automobiles drive market growth.
- Increasing adoption of IoT devices: This trend necessitates high-precision, low-power sensing solutions.
Challenges in the MEMS Combo Interaction Sensor Industry Sector
The MEMS combo interaction sensor industry faces several challenges:
- High initial investment costs: Development and manufacturing of advanced MEMS sensors require significant upfront investment.
- Supply chain disruptions: Global supply chain instability can affect production and delivery timelines.
- Intense competition: The market is characterized by intense competition among numerous established players and emerging startups, putting pressure on pricing and margins.
- Stringent regulatory compliance: Meeting various regional safety and environmental regulations adds to the cost and complexity of product development.
Leading Players in the MEMS Combo Interaction Sensor Industry Market
- Honeywell International Inc
- Microchip Technology Inc
- MEMSIC Inc
- Bosch Sensortec GmbH
- NXP Semiconductors
- KIONIX Inc
- Safran Colibrys SA
- Murata Manufacturing Co Ltd
- STMicroelectronics NV
- Analog Devices Inc
- InvenSense Inc
- Panasonic Corporation
Key Developments in MEMS Combo Interaction Sensor Industry Sector
- August 2022: MEMS launched the MIC6100AL, its first MEMS 6-axis inertial sensor (IMU), significantly enhancing the accuracy of physical interactive devices.
Strategic MEMS Combo Interaction Sensor Industry Market Outlook
The MEMS combo interaction sensor market is poised for continued growth, driven by technological innovation and expanding applications across various industries. Strategic opportunities exist for players who can develop cost-effective, high-performance sensors catering to the growing demand for sophisticated sensing solutions in the automotive, consumer electronics, and industrial automation sectors. The integration of AI and machine learning capabilities into MEMS sensors will further broaden their applications and unlock new market opportunities. Furthermore, strategic partnerships and acquisitions will play a crucial role in shaping the future competitive landscape of this dynamic industry.
MEMS Combo Interaction Sensor Industry Segmentation
-
1. Type
- 1.1. Movement Combo Sensor
- 1.2. Environment Combo Sensor
- 1.3. Optical Combo Sensor
- 1.4. Other Sensor Type
-
2. End User
- 2.1. Aerospace & Defense
- 2.2. Automotive
- 2.3. Consumer Electronics
- 2.4. Water and Wastewater Management
- 2.5. Oil and Gas
- 2.6. Food and Beverage
- 2.7. Other End Users
MEMS Combo Interaction Sensor Industry Segmentation By Geography
- 1. North America
- 2. Europe
- 3. Asia Pacific
- 4. Rest of the World

MEMS Combo Interaction Sensor Industry Regional Market Share
Geographic Coverage of MEMS Combo Interaction Sensor Industry
MEMS Combo Interaction Sensor Industry REPORT HIGHLIGHTS
| Aspects | Details |
|---|---|
| Study Period | 2020-2034 |
| Base Year | 2025 |
| Estimated Year | 2026 |
| Forecast Period | 2026-2034 |
| Historical Period | 2020-2025 |
| Growth Rate | CAGR of 4.6% from 2020-2034 |
| Segmentation |
|
Table of Contents
- 1. Introduction
- 1.1. Research Scope
- 1.2. Market Segmentation
- 1.3. Research Methodology
- 1.4. Definitions and Assumptions
- 2. Executive Summary
- 2.1. Introduction
- 3. Market Dynamics
- 3.1. Introduction
- 3.2. Market Drivers
- 3.2.1. Increasing Demand for Handheld & Wearable Devices; Adoption of ADAS and Self Driving Solutions in Automotive Industry; Growth in Interactive Gaming
- 3.3. Market Restrains
- 3.3.1. Increase in Overall Cost of MEMS
- 3.4. Market Trends
- 3.4.1. Growing Demand for Connected Handheld and Wearable Devices to Drive the Market
- 4. Market Factor Analysis
- 4.1. Porters Five Forces
- 4.2. Supply/Value Chain
- 4.3. PESTEL analysis
- 4.4. Market Entropy
- 4.5. Patent/Trademark Analysis
- 5. Global MEMS Combo Interaction Sensor Industry Analysis, Insights and Forecast, 2020-2032
- 5.1. Market Analysis, Insights and Forecast - by Type
- 5.1.1. Movement Combo Sensor
- 5.1.2. Environment Combo Sensor
- 5.1.3. Optical Combo Sensor
- 5.1.4. Other Sensor Type
- 5.2. Market Analysis, Insights and Forecast - by End User
- 5.2.1. Aerospace & Defense
- 5.2.2. Automotive
- 5.2.3. Consumer Electronics
- 5.2.4. Water and Wastewater Management
- 5.2.5. Oil and Gas
- 5.2.6. Food and Beverage
- 5.2.7. Other End Users
- 5.3. Market Analysis, Insights and Forecast - by Region
- 5.3.1. North America
- 5.3.2. Europe
- 5.3.3. Asia Pacific
- 5.3.4. Rest of the World
- 5.1. Market Analysis, Insights and Forecast - by Type
- 6. North America MEMS Combo Interaction Sensor Industry Analysis, Insights and Forecast, 2020-2032
- 6.1. Market Analysis, Insights and Forecast - by Type
- 6.1.1. Movement Combo Sensor
- 6.1.2. Environment Combo Sensor
- 6.1.3. Optical Combo Sensor
- 6.1.4. Other Sensor Type
- 6.2. Market Analysis, Insights and Forecast - by End User
- 6.2.1. Aerospace & Defense
- 6.2.2. Automotive
- 6.2.3. Consumer Electronics
- 6.2.4. Water and Wastewater Management
- 6.2.5. Oil and Gas
- 6.2.6. Food and Beverage
- 6.2.7. Other End Users
- 6.1. Market Analysis, Insights and Forecast - by Type
- 7. Europe MEMS Combo Interaction Sensor Industry Analysis, Insights and Forecast, 2020-2032
- 7.1. Market Analysis, Insights and Forecast - by Type
- 7.1.1. Movement Combo Sensor
- 7.1.2. Environment Combo Sensor
- 7.1.3. Optical Combo Sensor
- 7.1.4. Other Sensor Type
- 7.2. Market Analysis, Insights and Forecast - by End User
- 7.2.1. Aerospace & Defense
- 7.2.2. Automotive
- 7.2.3. Consumer Electronics
- 7.2.4. Water and Wastewater Management
- 7.2.5. Oil and Gas
- 7.2.6. Food and Beverage
- 7.2.7. Other End Users
- 7.1. Market Analysis, Insights and Forecast - by Type
- 8. Asia Pacific MEMS Combo Interaction Sensor Industry Analysis, Insights and Forecast, 2020-2032
- 8.1. Market Analysis, Insights and Forecast - by Type
- 8.1.1. Movement Combo Sensor
- 8.1.2. Environment Combo Sensor
- 8.1.3. Optical Combo Sensor
- 8.1.4. Other Sensor Type
- 8.2. Market Analysis, Insights and Forecast - by End User
- 8.2.1. Aerospace & Defense
- 8.2.2. Automotive
- 8.2.3. Consumer Electronics
- 8.2.4. Water and Wastewater Management
- 8.2.5. Oil and Gas
- 8.2.6. Food and Beverage
- 8.2.7. Other End Users
- 8.1. Market Analysis, Insights and Forecast - by Type
- 9. Rest of the World MEMS Combo Interaction Sensor Industry Analysis, Insights and Forecast, 2020-2032
- 9.1. Market Analysis, Insights and Forecast - by Type
- 9.1.1. Movement Combo Sensor
- 9.1.2. Environment Combo Sensor
- 9.1.3. Optical Combo Sensor
- 9.1.4. Other Sensor Type
- 9.2. Market Analysis, Insights and Forecast - by End User
- 9.2.1. Aerospace & Defense
- 9.2.2. Automotive
- 9.2.3. Consumer Electronics
- 9.2.4. Water and Wastewater Management
- 9.2.5. Oil and Gas
- 9.2.6. Food and Beverage
- 9.2.7. Other End Users
- 9.1. Market Analysis, Insights and Forecast - by Type
- 10. Competitive Analysis
- 10.1. Global Market Share Analysis 2025
- 10.2. Company Profiles
- 10.2.1 Honeywell International Inc
- 10.2.1.1. Overview
- 10.2.1.2. Products
- 10.2.1.3. SWOT Analysis
- 10.2.1.4. Recent Developments
- 10.2.1.5. Financials (Based on Availability)
- 10.2.2 Microchip Technology Inc
- 10.2.2.1. Overview
- 10.2.2.2. Products
- 10.2.2.3. SWOT Analysis
- 10.2.2.4. Recent Developments
- 10.2.2.5. Financials (Based on Availability)
- 10.2.3 MEMSIC Inc
- 10.2.3.1. Overview
- 10.2.3.2. Products
- 10.2.3.3. SWOT Analysis
- 10.2.3.4. Recent Developments
- 10.2.3.5. Financials (Based on Availability)
- 10.2.4 Bosch Sensortec GmbH
- 10.2.4.1. Overview
- 10.2.4.2. Products
- 10.2.4.3. SWOT Analysis
- 10.2.4.4. Recent Developments
- 10.2.4.5. Financials (Based on Availability)
- 10.2.5 NXP Semiconductors
- 10.2.5.1. Overview
- 10.2.5.2. Products
- 10.2.5.3. SWOT Analysis
- 10.2.5.4. Recent Developments
- 10.2.5.5. Financials (Based on Availability)
- 10.2.6 KIONIX Inc
- 10.2.6.1. Overview
- 10.2.6.2. Products
- 10.2.6.3. SWOT Analysis
- 10.2.6.4. Recent Developments
- 10.2.6.5. Financials (Based on Availability)
- 10.2.7 Safran Colibrys SA
- 10.2.7.1. Overview
- 10.2.7.2. Products
- 10.2.7.3. SWOT Analysis
- 10.2.7.4. Recent Developments
- 10.2.7.5. Financials (Based on Availability)
- 10.2.8 Murata Manufacturing Co Ltd
- 10.2.8.1. Overview
- 10.2.8.2. Products
- 10.2.8.3. SWOT Analysis
- 10.2.8.4. Recent Developments
- 10.2.8.5. Financials (Based on Availability)
- 10.2.9 STMicroelectronics NV*List Not Exhaustive
- 10.2.9.1. Overview
- 10.2.9.2. Products
- 10.2.9.3. SWOT Analysis
- 10.2.9.4. Recent Developments
- 10.2.9.5. Financials (Based on Availability)
- 10.2.10 Analog Devices Inc
- 10.2.10.1. Overview
- 10.2.10.2. Products
- 10.2.10.3. SWOT Analysis
- 10.2.10.4. Recent Developments
- 10.2.10.5. Financials (Based on Availability)
- 10.2.11 InvenSense Inc
- 10.2.11.1. Overview
- 10.2.11.2. Products
- 10.2.11.3. SWOT Analysis
- 10.2.11.4. Recent Developments
- 10.2.11.5. Financials (Based on Availability)
- 10.2.12 Panasonic Corporation
- 10.2.12.1. Overview
- 10.2.12.2. Products
- 10.2.12.3. SWOT Analysis
- 10.2.12.4. Recent Developments
- 10.2.12.5. Financials (Based on Availability)
- 10.2.1 Honeywell International Inc
List of Figures
- Figure 1: Global MEMS Combo Interaction Sensor Industry Revenue Breakdown (billion, %) by Region 2025 & 2033
- Figure 2: North America MEMS Combo Interaction Sensor Industry Revenue (billion), by Type 2025 & 2033
- Figure 3: North America MEMS Combo Interaction Sensor Industry Revenue Share (%), by Type 2025 & 2033
- Figure 4: North America MEMS Combo Interaction Sensor Industry Revenue (billion), by End User 2025 & 2033
- Figure 5: North America MEMS Combo Interaction Sensor Industry Revenue Share (%), by End User 2025 & 2033
- Figure 6: North America MEMS Combo Interaction Sensor Industry Revenue (billion), by Country 2025 & 2033
- Figure 7: North America MEMS Combo Interaction Sensor Industry Revenue Share (%), by Country 2025 & 2033
- Figure 8: Europe MEMS Combo Interaction Sensor Industry Revenue (billion), by Type 2025 & 2033
- Figure 9: Europe MEMS Combo Interaction Sensor Industry Revenue Share (%), by Type 2025 & 2033
- Figure 10: Europe MEMS Combo Interaction Sensor Industry Revenue (billion), by End User 2025 & 2033
- Figure 11: Europe MEMS Combo Interaction Sensor Industry Revenue Share (%), by End User 2025 & 2033
- Figure 12: Europe MEMS Combo Interaction Sensor Industry Revenue (billion), by Country 2025 & 2033
- Figure 13: Europe MEMS Combo Interaction Sensor Industry Revenue Share (%), by Country 2025 & 2033
- Figure 14: Asia Pacific MEMS Combo Interaction Sensor Industry Revenue (billion), by Type 2025 & 2033
- Figure 15: Asia Pacific MEMS Combo Interaction Sensor Industry Revenue Share (%), by Type 2025 & 2033
- Figure 16: Asia Pacific MEMS Combo Interaction Sensor Industry Revenue (billion), by End User 2025 & 2033
- Figure 17: Asia Pacific MEMS Combo Interaction Sensor Industry Revenue Share (%), by End User 2025 & 2033
- Figure 18: Asia Pacific MEMS Combo Interaction Sensor Industry Revenue (billion), by Country 2025 & 2033
- Figure 19: Asia Pacific MEMS Combo Interaction Sensor Industry Revenue Share (%), by Country 2025 & 2033
- Figure 20: Rest of the World MEMS Combo Interaction Sensor Industry Revenue (billion), by Type 2025 & 2033
- Figure 21: Rest of the World MEMS Combo Interaction Sensor Industry Revenue Share (%), by Type 2025 & 2033
- Figure 22: Rest of the World MEMS Combo Interaction Sensor Industry Revenue (billion), by End User 2025 & 2033
- Figure 23: Rest of the World MEMS Combo Interaction Sensor Industry Revenue Share (%), by End User 2025 & 2033
- Figure 24: Rest of the World MEMS Combo Interaction Sensor Industry Revenue (billion), by Country 2025 & 2033
- Figure 25: Rest of the World MEMS Combo Interaction Sensor Industry Revenue Share (%), by Country 2025 & 2033
List of Tables
- Table 1: Global MEMS Combo Interaction Sensor Industry Revenue billion Forecast, by Type 2020 & 2033
- Table 2: Global MEMS Combo Interaction Sensor Industry Revenue billion Forecast, by End User 2020 & 2033
- Table 3: Global MEMS Combo Interaction Sensor Industry Revenue billion Forecast, by Region 2020 & 2033
- Table 4: Global MEMS Combo Interaction Sensor Industry Revenue billion Forecast, by Type 2020 & 2033
- Table 5: Global MEMS Combo Interaction Sensor Industry Revenue billion Forecast, by End User 2020 & 2033
- Table 6: Global MEMS Combo Interaction Sensor Industry Revenue billion Forecast, by Country 2020 & 2033
- Table 7: Global MEMS Combo Interaction Sensor Industry Revenue billion Forecast, by Type 2020 & 2033
- Table 8: Global MEMS Combo Interaction Sensor Industry Revenue billion Forecast, by End User 2020 & 2033
- Table 9: Global MEMS Combo Interaction Sensor Industry Revenue billion Forecast, by Country 2020 & 2033
- Table 10: Global MEMS Combo Interaction Sensor Industry Revenue billion Forecast, by Type 2020 & 2033
- Table 11: Global MEMS Combo Interaction Sensor Industry Revenue billion Forecast, by End User 2020 & 2033
- Table 12: Global MEMS Combo Interaction Sensor Industry Revenue billion Forecast, by Country 2020 & 2033
- Table 13: Global MEMS Combo Interaction Sensor Industry Revenue billion Forecast, by Type 2020 & 2033
- Table 14: Global MEMS Combo Interaction Sensor Industry Revenue billion Forecast, by End User 2020 & 2033
- Table 15: Global MEMS Combo Interaction Sensor Industry Revenue billion Forecast, by Country 2020 & 2033
Frequently Asked Questions
1. What is the projected Compound Annual Growth Rate (CAGR) of the MEMS Combo Interaction Sensor Industry?
The projected CAGR is approximately 4.6%.
2. Which companies are prominent players in the MEMS Combo Interaction Sensor Industry?
Key companies in the market include Honeywell International Inc, Microchip Technology Inc, MEMSIC Inc, Bosch Sensortec GmbH, NXP Semiconductors, KIONIX Inc, Safran Colibrys SA, Murata Manufacturing Co Ltd, STMicroelectronics NV*List Not Exhaustive, Analog Devices Inc, InvenSense Inc, Panasonic Corporation.
3. What are the main segments of the MEMS Combo Interaction Sensor Industry?
The market segments include Type, End User.
4. Can you provide details about the market size?
The market size is estimated to be USD 17.61 billion as of 2022.
5. What are some drivers contributing to market growth?
Increasing Demand for Handheld & Wearable Devices; Adoption of ADAS and Self Driving Solutions in Automotive Industry; Growth in Interactive Gaming.
6. What are the notable trends driving market growth?
Growing Demand for Connected Handheld and Wearable Devices to Drive the Market.
7. Are there any restraints impacting market growth?
Increase in Overall Cost of MEMS.
8. Can you provide examples of recent developments in the market?
August 2022 - MEMS, a primary global provider of inertial MEMS sensors, launched the MIC6100AL, its first MEMS 6-axis inertial sensor (IMU), which blends a 3-axis gyroscope and 3-axis accelerometer to enable physical interactive devices, including gamepads and smart remotes with accurate sensing, considerably improving the user experience.
9. What pricing options are available for accessing the report?
Pricing options include single-user, multi-user, and enterprise licenses priced at USD 4750, USD 5250, and USD 8750 respectively.
10. Is the market size provided in terms of value or volume?
The market size is provided in terms of value, measured in billion.
11. Are there any specific market keywords associated with the report?
Yes, the market keyword associated with the report is "MEMS Combo Interaction Sensor Industry," which aids in identifying and referencing the specific market segment covered.
12. How do I determine which pricing option suits my needs best?
The pricing options vary based on user requirements and access needs. Individual users may opt for single-user licenses, while businesses requiring broader access may choose multi-user or enterprise licenses for cost-effective access to the report.
13. Are there any additional resources or data provided in the MEMS Combo Interaction Sensor Industry report?
While the report offers comprehensive insights, it's advisable to review the specific contents or supplementary materials provided to ascertain if additional resources or data are available.
14. How can I stay updated on further developments or reports in the MEMS Combo Interaction Sensor Industry?
To stay informed about further developments, trends, and reports in the MEMS Combo Interaction Sensor Industry, consider subscribing to industry newsletters, following relevant companies and organizations, or regularly checking reputable industry news sources and publications.
Methodology
Step 1 - Identification of Relevant Samples Size from Population Database


Step 2 - Approaches for Defining Global Market Size (Value, Volume* & Price*)

Note*: In applicable scenarios
Step 3 - Data Sources
Primary Research
- Web Analytics
- Survey Reports
- Research Institute
- Latest Research Reports
- Opinion Leaders
Secondary Research
- Annual Reports
- White Paper
- Latest Press Release
- Industry Association
- Paid Database
- Investor Presentations

Step 4 - Data Triangulation
Involves using different sources of information in order to increase the validity of a study
These sources are likely to be stakeholders in a program - participants, other researchers, program staff, other community members, and so on.
Then we put all data in single framework & apply various statistical tools to find out the dynamic on the market.
During the analysis stage, feedback from the stakeholder groups would be compared to determine areas of agreement as well as areas of divergence