
Key Insights
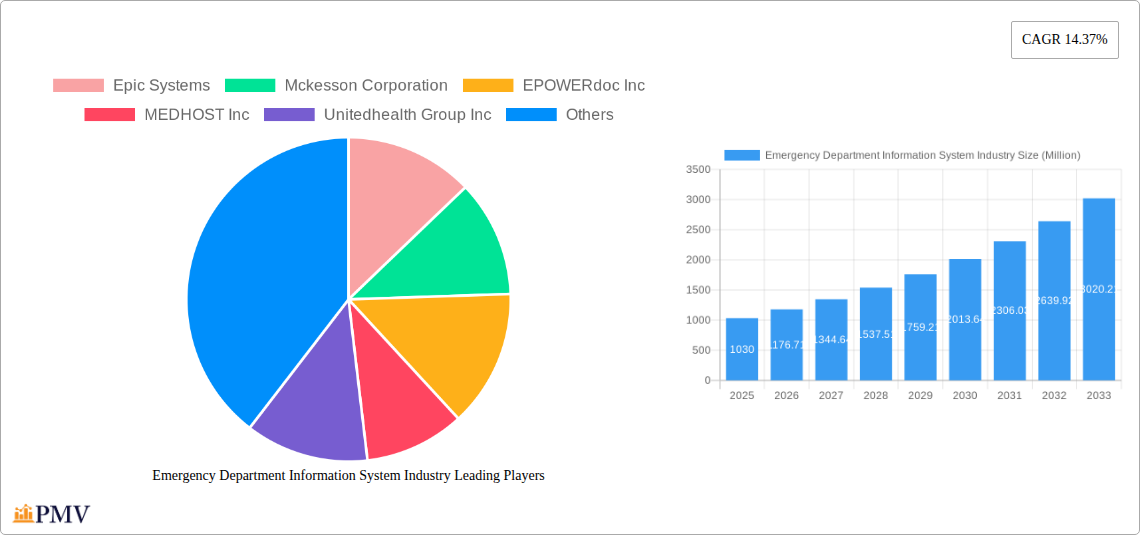
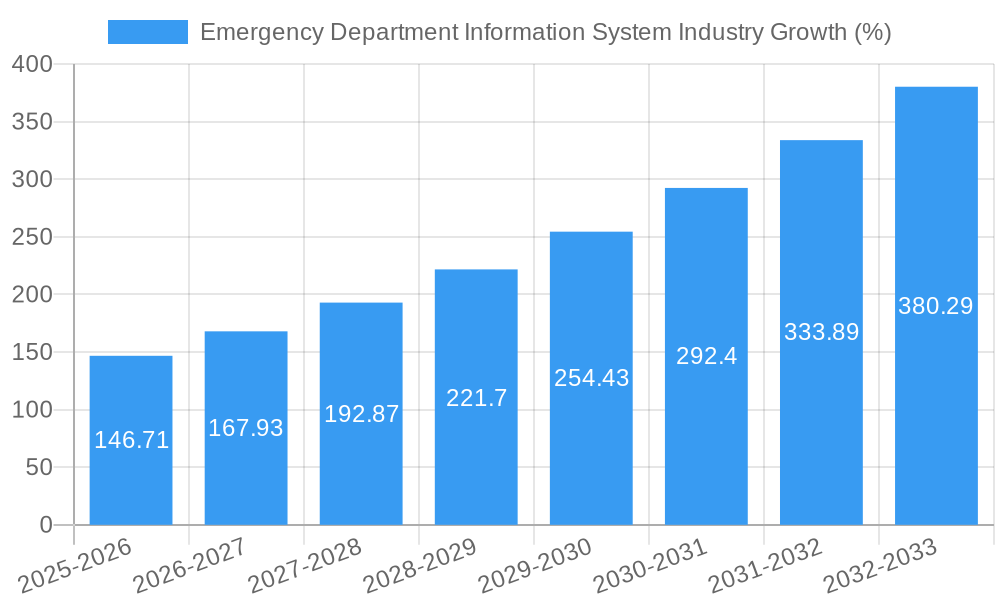
The Emergency Department Information System (EDIS) market is experiencing robust growth, projected to reach a market size of $1.03 billion in 2025 and maintain a Compound Annual Growth Rate (CAGR) of 14.37% from 2025 to 2033. This expansion is driven by several key factors. Increasing patient volumes in emergency departments necessitate efficient patient management systems, leading to widespread adoption of EDIS solutions. The shift towards value-based care models emphasizes improved patient outcomes and reduced operational costs, further fueling demand for these systems. Furthermore, the growing integration of Electronic Health Records (EHRs) and the increasing need for real-time data analytics for improved decision-making are significant drivers. Government initiatives promoting the digitalization of healthcare and the rising adoption of telehealth are also contributing factors. The market segmentation reveals a diverse landscape, with Computerized Physician Order Entry (CPOE) and Clinical Documentation modules being particularly prevalent. Software-as-a-Service (SaaS) deployment models are gaining traction due to their scalability and cost-effectiveness compared to on-premise solutions. Large hospitals constitute a significant portion of the end-user segment, but the market is also witnessing growth among medium and small hospitals as they seek to modernize their operations. Competition among leading vendors like Epic Systems, Cerner Corporation, and McKesson Corporation is intense, stimulating innovation and driving prices down. Geographical growth is expected to be robust across North America, Europe, and Asia Pacific, driven by varying levels of technological adoption and healthcare infrastructure development.
The forecast period (2025-2033) presents significant opportunities for EDIS vendors to capitalize on the expanding market. Further growth will depend on continued technological advancements, such as artificial intelligence (AI) integration for improved diagnostics and predictive analytics. The increasing emphasis on data security and interoperability will also play a crucial role in shaping market dynamics. Addressing potential restraints, such as high implementation costs, complexity of integration with existing systems, and concerns about data privacy, will be key to sustainable market growth. Focusing on user-friendly interfaces and providing comprehensive training programs can help mitigate these challenges. Ultimately, the EDIS market is poised for sustained growth, driven by the increasing demand for efficient, data-driven healthcare solutions in emergency departments worldwide.
Emergency Department Information System (EDIS) Market Report: 2019-2033
This comprehensive report provides an in-depth analysis of the Emergency Department Information System (EDIS) industry, offering actionable insights for stakeholders across the value chain. The report covers the period from 2019 to 2033, with a focus on the forecast period from 2025 to 2033 and a base year of 2025. The EDIS market is segmented by application, deployment, software type, and end-user, providing a granular understanding of market dynamics and growth opportunities. The market size is projected to reach xx Million by 2033, exhibiting a CAGR of xx%. This report is an invaluable resource for businesses, investors, and researchers seeking to understand the current state and future trajectory of the EDIS market.
Emergency Department Information System Industry Market Structure & Competitive Dynamics
The Emergency Department Information System (EDIS) market is characterized by a moderately concentrated structure, with key players such as Epic Systems, McKesson Corporation, and Cerner Corporation holding significant market share. The total market value in 2024 was approximately xx Million. The industry witnesses continuous innovation driven by technological advancements and the increasing adoption of AI and machine learning. Regulatory frameworks, particularly HIPAA compliance in the US and similar data privacy regulations globally, play a critical role in shaping market dynamics. Product substitutes include legacy systems and manual processes, but the increasing demand for efficiency and improved patient care drives the adoption of EDIS solutions. Mergers and acquisitions (M&A) are common, with deal values ranging from xx Million to xx Million in recent years. For example, the acquisition of xx company by yy company in 2022 reshaped the competitive landscape. End-user trends indicate a strong preference for cloud-based SaaS solutions due to their scalability and cost-effectiveness.
- Market Concentration: Moderately concentrated, with top 5 players accounting for approximately xx% of the market share in 2024.
- Innovation Ecosystems: Robust, with significant investments in AI, machine learning, and data analytics.
- Regulatory Frameworks: Stringent data privacy regulations (e.g., HIPAA) significantly impact market dynamics.
- M&A Activity: Frequent M&A activity driving consolidation and market share shifts. Deal values are typically in the xx Million to xx Million range.
Emergency Department Information System Industry Industry Trends & Insights
The EDIS market is experiencing robust growth, driven by several key factors. The rising prevalence of chronic diseases and the increasing number of emergency department visits are creating a significant demand for efficient and effective patient management systems. Technological advancements, particularly the integration of Artificial Intelligence (AI) and machine learning, are transforming the functionality of EDIS solutions, enhancing diagnostic accuracy, and improving patient outcomes. The increasing adoption of cloud-based SaaS solutions offers enhanced scalability, accessibility, and cost-effectiveness for healthcare providers of all sizes. Consumer preferences are shifting towards user-friendly, intuitive interfaces and integrated platforms that seamlessly connect with other healthcare systems. Competitive dynamics are intense, with established players focusing on innovation and expanding their product portfolios, while new entrants leverage technological advancements to disrupt the market. The overall market is projected to experience a Compound Annual Growth Rate (CAGR) of xx% between 2025 and 2033, reaching a value of xx Million by 2033. Market penetration of EDIS solutions in small and medium-sized hospitals is increasing, indicating a vast untapped potential for market growth.
Dominant Markets & Segments in Emergency Department Information System Industry
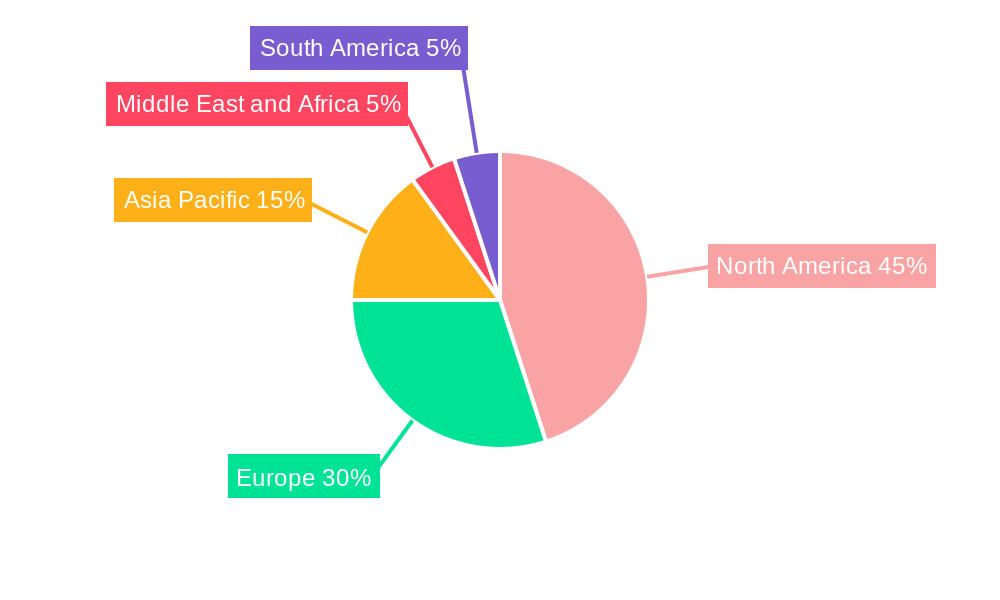
The North American region, particularly the United States, dominates the EDIS market, driven by high healthcare spending, advanced technological infrastructure, and stringent regulatory requirements. Within the application segments, Computerized Physician Order Entry (CPOE) and Patient Tracking & Triage hold the largest market shares, reflecting the critical role of these functionalities in optimizing emergency department workflows. The SaaS deployment model is gaining significant traction, surpassing on-premise solutions due to its flexibility and cost-effectiveness. Large hospitals currently represent the largest end-user segment, but there is significant growth potential among medium-sized and small hospitals as affordability and ease of implementation improve.
Key Drivers for North American Dominance:
- High healthcare expenditure
- Advanced technological infrastructure
- Stringent regulatory environment fostering innovation
- High adoption rates among large hospitals
Dominant Application Segments: CPOE and Patient Tracking & Triage.
Dominant Deployment Model: SaaS.
Dominant End-User Segment: Large Hospitals, followed by Medium-Sized Hospitals.
Emergency Department Information System Industry Product Innovations
Recent product innovations in the EDIS market focus on enhancing interoperability, integrating AI-powered diagnostic tools, and improving user experience. Key trends include the development of cloud-based platforms, the integration of mobile applications for remote patient monitoring, and the incorporation of predictive analytics for resource allocation. These innovations aim to address critical challenges such as reducing wait times, improving diagnostic accuracy, and enhancing overall efficiency in emergency departments. The successful integration of these technologies offers significant competitive advantages, creating opportunities for market differentiation and increased market share.
Report Segmentation & Scope
This report segments the EDIS market across multiple dimensions:
Application: Computerized Physician Order Entry (CPOE), Clinical Documentation, Patient Tracking & Triage, E-Prescribing, Others. Each segment's growth is projected based on its current market size and adoption rates.
Deployment: On-Premise EDIS and Software-as-a-Service (SaaS). SaaS is projected to grow faster due to its scalability and accessibility.
Software Type: Enterprise Solutions and Best of Breed (B.O.B.) Solutions. The choice between these depends on the hospital's specific needs and existing infrastructure.
End-User: Small Hospitals, Medium-Sized Hospitals, and Large Hospitals. Growth will vary depending on factors such as budget and technological capabilities. Each segment shows different growth projections based on technological adoption and investment capacity.
Key Drivers of Emergency Department Information System Industry Growth
Several factors are driving growth in the EDIS market. Technological advancements, such as AI-powered diagnostics and predictive analytics, are significantly enhancing the efficiency and effectiveness of emergency departments. The increasing prevalence of chronic diseases is creating a greater demand for improved patient management systems. Government initiatives promoting the adoption of electronic health records (EHRs) and interoperability standards are further fueling market growth. Finally, the growing demand for cost-effective and efficient healthcare solutions is driving the adoption of cloud-based EDIS solutions.
Challenges in the Emergency Department Information System Industry Sector
The EDIS market faces challenges such as high implementation costs, the need for extensive staff training, and the complexity of integrating different systems. Data security and privacy concerns are also critical. The competitive landscape is intense, with several established players and new entrants vying for market share. Supply chain disruptions can impact the availability and cost of hardware and software components. Regulatory hurdles and compliance requirements can also pose challenges for vendors and healthcare providers. These factors collectively impact market growth and adoption rates.
Leading Players in the Emergency Department Information System Industry Market
- Epic Systems
- McKesson Corporation
- EPOWERdoc Inc
- MEDHOST Inc
- Unitedhealth Group Inc
- Cerner Corporation
- Medical Information Technology Inc
- Logibec Canada
- Allscripts Healthcare Solutions Inc
- T-Systems Inc
- Evident
- Medsphere Systems Corporation
Key Developments in Emergency Department Information System Industry Sector
- March 2022: HeartBeam, Inc. signed a BAA and CTA with Phoebe Putney Health System to evaluate its ED MI software. This signifies growing interest in AI-powered solutions for improving MI diagnosis and care.
- January 2022: Aidoc partnered with Novant Health, integrating its AI platform to improve patient triage and reduce ED length of stay. This highlights the increasing adoption of AI for streamlining ED workflows and optimizing resource allocation.
Strategic Emergency Department Information System Industry Market Outlook
The EDIS market holds significant growth potential, driven by continuous technological advancements, increasing demand for improved patient care, and the expanding adoption of cloud-based solutions. Strategic opportunities lie in developing AI-powered diagnostic tools, enhancing interoperability across healthcare systems, and focusing on user-friendly interfaces. Companies that can effectively address the challenges of data security, integration complexity, and staff training will be well-positioned to capture a significant share of the growing market. The focus on improving patient outcomes and operational efficiency will continue to drive innovation and market expansion in the coming years.
Emergency Department Information System Industry Segmentation
-
1. Application
- 1.1. Computerized Physician Order Entry (CPOE)
- 1.2. Clinical Documentation
- 1.3. Patient Tracking & Triage
- 1.4. E-Prescribing
- 1.5. Others
-
2. Deployment
- 2.1. On-Premise EDIS
- 2.2. Software-As-A-Services (SaaS)
-
3. Software Type
- 3.1. Enterprise Solutions
- 3.2. Best of Breed (B.O.B.) Solutions
-
4. End User
- 4.1. Small Hospitals
- 4.2. Medium-Sized Hospitals
- 4.3. Large Hospitals
Emergency Department Information System Industry Segmentation By Geography
-
1. North America
- 1.1. United States
- 1.2. Canada
- 1.3. Mexico
-
2. Europe
- 2.1. Germany
- 2.2. United Kingdom
- 2.3. France
- 2.4. Italy
- 2.5. Spain
- 2.6. Rest of Europe
-
3. Asia Pacific
- 3.1. China
- 3.2. Japan
- 3.3. India
- 3.4. Australia
- 3.5. South Korea
- 3.6. Rest of Asia Pacific
-
4. Middle East and Africa
- 4.1. GCC
- 4.2. South Africa
- 4.3. Rest of Middle East and Africa
-
5. South America
- 5.1. Brazil
- 5.2. Argentina
- 5.3. Rest of South America
Emergency Department Information System Industry REPORT HIGHLIGHTS
| Aspects | Details |
|---|---|
| Study Period | 2019-2033 |
| Base Year | 2024 |
| Estimated Year | 2025 |
| Forecast Period | 2025-2033 |
| Historical Period | 2019-2024 |
| Growth Rate | CAGR of 14.37% from 2019-2033 |
| Segmentation |
|
Table of Contents
- 1. Introduction
- 1.1. Research Scope
- 1.2. Market Segmentation
- 1.3. Research Methodology
- 1.4. Definitions and Assumptions
- 2. Executive Summary
- 2.1. Introduction
- 3. Market Dynamics
- 3.1. Introduction
- 3.2. Market Drivers
- 3.2.1. Rise in the Geriatric Population; Increasing Use Of Data-Driven Technologies; Increase in Number of Insured Population
- 3.3. Market Restrains
- 3.3.1. Adverse Quality and Safety Implications Of EDIS; Lack of Skilled Healthcare IT Professionals
- 3.4. Market Trends
- 3.4.1. Best of Breed (B.O.B.) Solutions are Anticipated to be the Dominant Segment in Software Type During the Forecast Period
- 4. Market Factor Analysis
- 4.1. Porters Five Forces
- 4.2. Supply/Value Chain
- 4.3. PESTEL analysis
- 4.4. Market Entropy
- 4.5. Patent/Trademark Analysis
- 5. Global Emergency Department Information System Industry Analysis, Insights and Forecast, 2019-2031
- 5.1. Market Analysis, Insights and Forecast - by Application
- 5.1.1. Computerized Physician Order Entry (CPOE)
- 5.1.2. Clinical Documentation
- 5.1.3. Patient Tracking & Triage
- 5.1.4. E-Prescribing
- 5.1.5. Others
- 5.2. Market Analysis, Insights and Forecast - by Deployment
- 5.2.1. On-Premise EDIS
- 5.2.2. Software-As-A-Services (SaaS)
- 5.3. Market Analysis, Insights and Forecast - by Software Type
- 5.3.1. Enterprise Solutions
- 5.3.2. Best of Breed (B.O.B.) Solutions
- 5.4. Market Analysis, Insights and Forecast - by End User
- 5.4.1. Small Hospitals
- 5.4.2. Medium-Sized Hospitals
- 5.4.3. Large Hospitals
- 5.5. Market Analysis, Insights and Forecast - by Region
- 5.5.1. North America
- 5.5.2. Europe
- 5.5.3. Asia Pacific
- 5.5.4. Middle East and Africa
- 5.5.5. South America
- 5.1. Market Analysis, Insights and Forecast - by Application
- 6. North America Emergency Department Information System Industry Analysis, Insights and Forecast, 2019-2031
- 6.1. Market Analysis, Insights and Forecast - by Application
- 6.1.1. Computerized Physician Order Entry (CPOE)
- 6.1.2. Clinical Documentation
- 6.1.3. Patient Tracking & Triage
- 6.1.4. E-Prescribing
- 6.1.5. Others
- 6.2. Market Analysis, Insights and Forecast - by Deployment
- 6.2.1. On-Premise EDIS
- 6.2.2. Software-As-A-Services (SaaS)
- 6.3. Market Analysis, Insights and Forecast - by Software Type
- 6.3.1. Enterprise Solutions
- 6.3.2. Best of Breed (B.O.B.) Solutions
- 6.4. Market Analysis, Insights and Forecast - by End User
- 6.4.1. Small Hospitals
- 6.4.2. Medium-Sized Hospitals
- 6.4.3. Large Hospitals
- 6.1. Market Analysis, Insights and Forecast - by Application
- 7. Europe Emergency Department Information System Industry Analysis, Insights and Forecast, 2019-2031
- 7.1. Market Analysis, Insights and Forecast - by Application
- 7.1.1. Computerized Physician Order Entry (CPOE)
- 7.1.2. Clinical Documentation
- 7.1.3. Patient Tracking & Triage
- 7.1.4. E-Prescribing
- 7.1.5. Others
- 7.2. Market Analysis, Insights and Forecast - by Deployment
- 7.2.1. On-Premise EDIS
- 7.2.2. Software-As-A-Services (SaaS)
- 7.3. Market Analysis, Insights and Forecast - by Software Type
- 7.3.1. Enterprise Solutions
- 7.3.2. Best of Breed (B.O.B.) Solutions
- 7.4. Market Analysis, Insights and Forecast - by End User
- 7.4.1. Small Hospitals
- 7.4.2. Medium-Sized Hospitals
- 7.4.3. Large Hospitals
- 7.1. Market Analysis, Insights and Forecast - by Application
- 8. Asia Pacific Emergency Department Information System Industry Analysis, Insights and Forecast, 2019-2031
- 8.1. Market Analysis, Insights and Forecast - by Application
- 8.1.1. Computerized Physician Order Entry (CPOE)
- 8.1.2. Clinical Documentation
- 8.1.3. Patient Tracking & Triage
- 8.1.4. E-Prescribing
- 8.1.5. Others
- 8.2. Market Analysis, Insights and Forecast - by Deployment
- 8.2.1. On-Premise EDIS
- 8.2.2. Software-As-A-Services (SaaS)
- 8.3. Market Analysis, Insights and Forecast - by Software Type
- 8.3.1. Enterprise Solutions
- 8.3.2. Best of Breed (B.O.B.) Solutions
- 8.4. Market Analysis, Insights and Forecast - by End User
- 8.4.1. Small Hospitals
- 8.4.2. Medium-Sized Hospitals
- 8.4.3. Large Hospitals
- 8.1. Market Analysis, Insights and Forecast - by Application
- 9. Middle East and Africa Emergency Department Information System Industry Analysis, Insights and Forecast, 2019-2031
- 9.1. Market Analysis, Insights and Forecast - by Application
- 9.1.1. Computerized Physician Order Entry (CPOE)
- 9.1.2. Clinical Documentation
- 9.1.3. Patient Tracking & Triage
- 9.1.4. E-Prescribing
- 9.1.5. Others
- 9.2. Market Analysis, Insights and Forecast - by Deployment
- 9.2.1. On-Premise EDIS
- 9.2.2. Software-As-A-Services (SaaS)
- 9.3. Market Analysis, Insights and Forecast - by Software Type
- 9.3.1. Enterprise Solutions
- 9.3.2. Best of Breed (B.O.B.) Solutions
- 9.4. Market Analysis, Insights and Forecast - by End User
- 9.4.1. Small Hospitals
- 9.4.2. Medium-Sized Hospitals
- 9.4.3. Large Hospitals
- 9.1. Market Analysis, Insights and Forecast - by Application
- 10. South America Emergency Department Information System Industry Analysis, Insights and Forecast, 2019-2031
- 10.1. Market Analysis, Insights and Forecast - by Application
- 10.1.1. Computerized Physician Order Entry (CPOE)
- 10.1.2. Clinical Documentation
- 10.1.3. Patient Tracking & Triage
- 10.1.4. E-Prescribing
- 10.1.5. Others
- 10.2. Market Analysis, Insights and Forecast - by Deployment
- 10.2.1. On-Premise EDIS
- 10.2.2. Software-As-A-Services (SaaS)
- 10.3. Market Analysis, Insights and Forecast - by Software Type
- 10.3.1. Enterprise Solutions
- 10.3.2. Best of Breed (B.O.B.) Solutions
- 10.4. Market Analysis, Insights and Forecast - by End User
- 10.4.1. Small Hospitals
- 10.4.2. Medium-Sized Hospitals
- 10.4.3. Large Hospitals
- 10.1. Market Analysis, Insights and Forecast - by Application
- 11. North America Emergency Department Information System Industry Analysis, Insights and Forecast, 2019-2031
- 11.1. Market Analysis, Insights and Forecast - By Country/Sub-region
- 11.1.1 United States
- 11.1.2 Canada
- 11.1.3 Mexico
- 12. Europe Emergency Department Information System Industry Analysis, Insights and Forecast, 2019-2031
- 12.1. Market Analysis, Insights and Forecast - By Country/Sub-region
- 12.1.1 Germany
- 12.1.2 United Kingdom
- 12.1.3 France
- 12.1.4 Italy
- 12.1.5 Spain
- 12.1.6 Rest of Europe
- 13. Asia Pacific Emergency Department Information System Industry Analysis, Insights and Forecast, 2019-2031
- 13.1. Market Analysis, Insights and Forecast - By Country/Sub-region
- 13.1.1 China
- 13.1.2 Japan
- 13.1.3 India
- 13.1.4 Australia
- 13.1.5 South Korea
- 13.1.6 Rest of Asia Pacific
- 14. Middle East and Africa Emergency Department Information System Industry Analysis, Insights and Forecast, 2019-2031
- 14.1. Market Analysis, Insights and Forecast - By Country/Sub-region
- 14.1.1 GCC
- 14.1.2 South Africa
- 14.1.3 Rest of Middle East and Africa
- 15. South America Emergency Department Information System Industry Analysis, Insights and Forecast, 2019-2031
- 15.1. Market Analysis, Insights and Forecast - By Country/Sub-region
- 15.1.1 Brazil
- 15.1.2 Argentina
- 15.1.3 Rest of South America
- 16. Competitive Analysis
- 16.1. Global Market Share Analysis 2024
- 16.2. Company Profiles
- 16.2.1 Epic Systems
- 16.2.1.1. Overview
- 16.2.1.2. Products
- 16.2.1.3. SWOT Analysis
- 16.2.1.4. Recent Developments
- 16.2.1.5. Financials (Based on Availability)
- 16.2.2 Mckesson Corporation
- 16.2.2.1. Overview
- 16.2.2.2. Products
- 16.2.2.3. SWOT Analysis
- 16.2.2.4. Recent Developments
- 16.2.2.5. Financials (Based on Availability)
- 16.2.3 EPOWERdoc Inc
- 16.2.3.1. Overview
- 16.2.3.2. Products
- 16.2.3.3. SWOT Analysis
- 16.2.3.4. Recent Developments
- 16.2.3.5. Financials (Based on Availability)
- 16.2.4 MEDHOST Inc
- 16.2.4.1. Overview
- 16.2.4.2. Products
- 16.2.4.3. SWOT Analysis
- 16.2.4.4. Recent Developments
- 16.2.4.5. Financials (Based on Availability)
- 16.2.5 Unitedhealth Group Inc
- 16.2.5.1. Overview
- 16.2.5.2. Products
- 16.2.5.3. SWOT Analysis
- 16.2.5.4. Recent Developments
- 16.2.5.5. Financials (Based on Availability)
- 16.2.6 Cerner Corporation
- 16.2.6.1. Overview
- 16.2.6.2. Products
- 16.2.6.3. SWOT Analysis
- 16.2.6.4. Recent Developments
- 16.2.6.5. Financials (Based on Availability)
- 16.2.7 Medical Information Technology Inc
- 16.2.7.1. Overview
- 16.2.7.2. Products
- 16.2.7.3. SWOT Analysis
- 16.2.7.4. Recent Developments
- 16.2.7.5. Financials (Based on Availability)
- 16.2.8 Logibec Canada
- 16.2.8.1. Overview
- 16.2.8.2. Products
- 16.2.8.3. SWOT Analysis
- 16.2.8.4. Recent Developments
- 16.2.8.5. Financials (Based on Availability)
- 16.2.9 Allscripts Healthcare Solutions Inc
- 16.2.9.1. Overview
- 16.2.9.2. Products
- 16.2.9.3. SWOT Analysis
- 16.2.9.4. Recent Developments
- 16.2.9.5. Financials (Based on Availability)
- 16.2.10 T-Systems Inc
- 16.2.10.1. Overview
- 16.2.10.2. Products
- 16.2.10.3. SWOT Analysis
- 16.2.10.4. Recent Developments
- 16.2.10.5. Financials (Based on Availability)
- 16.2.11 Evident
- 16.2.11.1. Overview
- 16.2.11.2. Products
- 16.2.11.3. SWOT Analysis
- 16.2.11.4. Recent Developments
- 16.2.11.5. Financials (Based on Availability)
- 16.2.12 Medsphere Systems Corporation
- 16.2.12.1. Overview
- 16.2.12.2. Products
- 16.2.12.3. SWOT Analysis
- 16.2.12.4. Recent Developments
- 16.2.12.5. Financials (Based on Availability)
- 16.2.1 Epic Systems
List of Figures
- Figure 1: Global Emergency Department Information System Industry Revenue Breakdown (Million, %) by Region 2024 & 2032
- Figure 2: Global Emergency Department Information System Industry Volume Breakdown (K Unit, %) by Region 2024 & 2032
- Figure 3: North America Emergency Department Information System Industry Revenue (Million), by Country 2024 & 2032
- Figure 4: North America Emergency Department Information System Industry Volume (K Unit), by Country 2024 & 2032
- Figure 5: North America Emergency Department Information System Industry Revenue Share (%), by Country 2024 & 2032
- Figure 6: North America Emergency Department Information System Industry Volume Share (%), by Country 2024 & 2032
- Figure 7: Europe Emergency Department Information System Industry Revenue (Million), by Country 2024 & 2032
- Figure 8: Europe Emergency Department Information System Industry Volume (K Unit), by Country 2024 & 2032
- Figure 9: Europe Emergency Department Information System Industry Revenue Share (%), by Country 2024 & 2032
- Figure 10: Europe Emergency Department Information System Industry Volume Share (%), by Country 2024 & 2032
- Figure 11: Asia Pacific Emergency Department Information System Industry Revenue (Million), by Country 2024 & 2032
- Figure 12: Asia Pacific Emergency Department Information System Industry Volume (K Unit), by Country 2024 & 2032
- Figure 13: Asia Pacific Emergency Department Information System Industry Revenue Share (%), by Country 2024 & 2032
- Figure 14: Asia Pacific Emergency Department Information System Industry Volume Share (%), by Country 2024 & 2032
- Figure 15: Middle East and Africa Emergency Department Information System Industry Revenue (Million), by Country 2024 & 2032
- Figure 16: Middle East and Africa Emergency Department Information System Industry Volume (K Unit), by Country 2024 & 2032
- Figure 17: Middle East and Africa Emergency Department Information System Industry Revenue Share (%), by Country 2024 & 2032
- Figure 18: Middle East and Africa Emergency Department Information System Industry Volume Share (%), by Country 2024 & 2032
- Figure 19: South America Emergency Department Information System Industry Revenue (Million), by Country 2024 & 2032
- Figure 20: South America Emergency Department Information System Industry Volume (K Unit), by Country 2024 & 2032
- Figure 21: South America Emergency Department Information System Industry Revenue Share (%), by Country 2024 & 2032
- Figure 22: South America Emergency Department Information System Industry Volume Share (%), by Country 2024 & 2032
- Figure 23: North America Emergency Department Information System Industry Revenue (Million), by Application 2024 & 2032
- Figure 24: North America Emergency Department Information System Industry Volume (K Unit), by Application 2024 & 2032
- Figure 25: North America Emergency Department Information System Industry Revenue Share (%), by Application 2024 & 2032
- Figure 26: North America Emergency Department Information System Industry Volume Share (%), by Application 2024 & 2032
- Figure 27: North America Emergency Department Information System Industry Revenue (Million), by Deployment 2024 & 2032
- Figure 28: North America Emergency Department Information System Industry Volume (K Unit), by Deployment 2024 & 2032
- Figure 29: North America Emergency Department Information System Industry Revenue Share (%), by Deployment 2024 & 2032
- Figure 30: North America Emergency Department Information System Industry Volume Share (%), by Deployment 2024 & 2032
- Figure 31: North America Emergency Department Information System Industry Revenue (Million), by Software Type 2024 & 2032
- Figure 32: North America Emergency Department Information System Industry Volume (K Unit), by Software Type 2024 & 2032
- Figure 33: North America Emergency Department Information System Industry Revenue Share (%), by Software Type 2024 & 2032
- Figure 34: North America Emergency Department Information System Industry Volume Share (%), by Software Type 2024 & 2032
- Figure 35: North America Emergency Department Information System Industry Revenue (Million), by End User 2024 & 2032
- Figure 36: North America Emergency Department Information System Industry Volume (K Unit), by End User 2024 & 2032
- Figure 37: North America Emergency Department Information System Industry Revenue Share (%), by End User 2024 & 2032
- Figure 38: North America Emergency Department Information System Industry Volume Share (%), by End User 2024 & 2032
- Figure 39: North America Emergency Department Information System Industry Revenue (Million), by Country 2024 & 2032
- Figure 40: North America Emergency Department Information System Industry Volume (K Unit), by Country 2024 & 2032
- Figure 41: North America Emergency Department Information System Industry Revenue Share (%), by Country 2024 & 2032
- Figure 42: North America Emergency Department Information System Industry Volume Share (%), by Country 2024 & 2032
- Figure 43: Europe Emergency Department Information System Industry Revenue (Million), by Application 2024 & 2032
- Figure 44: Europe Emergency Department Information System Industry Volume (K Unit), by Application 2024 & 2032
- Figure 45: Europe Emergency Department Information System Industry Revenue Share (%), by Application 2024 & 2032
- Figure 46: Europe Emergency Department Information System Industry Volume Share (%), by Application 2024 & 2032
- Figure 47: Europe Emergency Department Information System Industry Revenue (Million), by Deployment 2024 & 2032
- Figure 48: Europe Emergency Department Information System Industry Volume (K Unit), by Deployment 2024 & 2032
- Figure 49: Europe Emergency Department Information System Industry Revenue Share (%), by Deployment 2024 & 2032
- Figure 50: Europe Emergency Department Information System Industry Volume Share (%), by Deployment 2024 & 2032
- Figure 51: Europe Emergency Department Information System Industry Revenue (Million), by Software Type 2024 & 2032
- Figure 52: Europe Emergency Department Information System Industry Volume (K Unit), by Software Type 2024 & 2032
- Figure 53: Europe Emergency Department Information System Industry Revenue Share (%), by Software Type 2024 & 2032
- Figure 54: Europe Emergency Department Information System Industry Volume Share (%), by Software Type 2024 & 2032
- Figure 55: Europe Emergency Department Information System Industry Revenue (Million), by End User 2024 & 2032
- Figure 56: Europe Emergency Department Information System Industry Volume (K Unit), by End User 2024 & 2032
- Figure 57: Europe Emergency Department Information System Industry Revenue Share (%), by End User 2024 & 2032
- Figure 58: Europe Emergency Department Information System Industry Volume Share (%), by End User 2024 & 2032
- Figure 59: Europe Emergency Department Information System Industry Revenue (Million), by Country 2024 & 2032
- Figure 60: Europe Emergency Department Information System Industry Volume (K Unit), by Country 2024 & 2032
- Figure 61: Europe Emergency Department Information System Industry Revenue Share (%), by Country 2024 & 2032
- Figure 62: Europe Emergency Department Information System Industry Volume Share (%), by Country 2024 & 2032
- Figure 63: Asia Pacific Emergency Department Information System Industry Revenue (Million), by Application 2024 & 2032
- Figure 64: Asia Pacific Emergency Department Information System Industry Volume (K Unit), by Application 2024 & 2032
- Figure 65: Asia Pacific Emergency Department Information System Industry Revenue Share (%), by Application 2024 & 2032
- Figure 66: Asia Pacific Emergency Department Information System Industry Volume Share (%), by Application 2024 & 2032
- Figure 67: Asia Pacific Emergency Department Information System Industry Revenue (Million), by Deployment 2024 & 2032
- Figure 68: Asia Pacific Emergency Department Information System Industry Volume (K Unit), by Deployment 2024 & 2032
- Figure 69: Asia Pacific Emergency Department Information System Industry Revenue Share (%), by Deployment 2024 & 2032
- Figure 70: Asia Pacific Emergency Department Information System Industry Volume Share (%), by Deployment 2024 & 2032
- Figure 71: Asia Pacific Emergency Department Information System Industry Revenue (Million), by Software Type 2024 & 2032
- Figure 72: Asia Pacific Emergency Department Information System Industry Volume (K Unit), by Software Type 2024 & 2032
- Figure 73: Asia Pacific Emergency Department Information System Industry Revenue Share (%), by Software Type 2024 & 2032
- Figure 74: Asia Pacific Emergency Department Information System Industry Volume Share (%), by Software Type 2024 & 2032
- Figure 75: Asia Pacific Emergency Department Information System Industry Revenue (Million), by End User 2024 & 2032
- Figure 76: Asia Pacific Emergency Department Information System Industry Volume (K Unit), by End User 2024 & 2032
- Figure 77: Asia Pacific Emergency Department Information System Industry Revenue Share (%), by End User 2024 & 2032
- Figure 78: Asia Pacific Emergency Department Information System Industry Volume Share (%), by End User 2024 & 2032
- Figure 79: Asia Pacific Emergency Department Information System Industry Revenue (Million), by Country 2024 & 2032
- Figure 80: Asia Pacific Emergency Department Information System Industry Volume (K Unit), by Country 2024 & 2032
- Figure 81: Asia Pacific Emergency Department Information System Industry Revenue Share (%), by Country 2024 & 2032
- Figure 82: Asia Pacific Emergency Department Information System Industry Volume Share (%), by Country 2024 & 2032
- Figure 83: Middle East and Africa Emergency Department Information System Industry Revenue (Million), by Application 2024 & 2032
- Figure 84: Middle East and Africa Emergency Department Information System Industry Volume (K Unit), by Application 2024 & 2032
- Figure 85: Middle East and Africa Emergency Department Information System Industry Revenue Share (%), by Application 2024 & 2032
- Figure 86: Middle East and Africa Emergency Department Information System Industry Volume Share (%), by Application 2024 & 2032
- Figure 87: Middle East and Africa Emergency Department Information System Industry Revenue (Million), by Deployment 2024 & 2032
- Figure 88: Middle East and Africa Emergency Department Information System Industry Volume (K Unit), by Deployment 2024 & 2032
- Figure 89: Middle East and Africa Emergency Department Information System Industry Revenue Share (%), by Deployment 2024 & 2032
- Figure 90: Middle East and Africa Emergency Department Information System Industry Volume Share (%), by Deployment 2024 & 2032
- Figure 91: Middle East and Africa Emergency Department Information System Industry Revenue (Million), by Software Type 2024 & 2032
- Figure 92: Middle East and Africa Emergency Department Information System Industry Volume (K Unit), by Software Type 2024 & 2032
- Figure 93: Middle East and Africa Emergency Department Information System Industry Revenue Share (%), by Software Type 2024 & 2032
- Figure 94: Middle East and Africa Emergency Department Information System Industry Volume Share (%), by Software Type 2024 & 2032
- Figure 95: Middle East and Africa Emergency Department Information System Industry Revenue (Million), by End User 2024 & 2032
- Figure 96: Middle East and Africa Emergency Department Information System Industry Volume (K Unit), by End User 2024 & 2032
- Figure 97: Middle East and Africa Emergency Department Information System Industry Revenue Share (%), by End User 2024 & 2032
- Figure 98: Middle East and Africa Emergency Department Information System Industry Volume Share (%), by End User 2024 & 2032
- Figure 99: Middle East and Africa Emergency Department Information System Industry Revenue (Million), by Country 2024 & 2032
- Figure 100: Middle East and Africa Emergency Department Information System Industry Volume (K Unit), by Country 2024 & 2032
- Figure 101: Middle East and Africa Emergency Department Information System Industry Revenue Share (%), by Country 2024 & 2032
- Figure 102: Middle East and Africa Emergency Department Information System Industry Volume Share (%), by Country 2024 & 2032
- Figure 103: South America Emergency Department Information System Industry Revenue (Million), by Application 2024 & 2032
- Figure 104: South America Emergency Department Information System Industry Volume (K Unit), by Application 2024 & 2032
- Figure 105: South America Emergency Department Information System Industry Revenue Share (%), by Application 2024 & 2032
- Figure 106: South America Emergency Department Information System Industry Volume Share (%), by Application 2024 & 2032
- Figure 107: South America Emergency Department Information System Industry Revenue (Million), by Deployment 2024 & 2032
- Figure 108: South America Emergency Department Information System Industry Volume (K Unit), by Deployment 2024 & 2032
- Figure 109: South America Emergency Department Information System Industry Revenue Share (%), by Deployment 2024 & 2032
- Figure 110: South America Emergency Department Information System Industry Volume Share (%), by Deployment 2024 & 2032
- Figure 111: South America Emergency Department Information System Industry Revenue (Million), by Software Type 2024 & 2032
- Figure 112: South America Emergency Department Information System Industry Volume (K Unit), by Software Type 2024 & 2032
- Figure 113: South America Emergency Department Information System Industry Revenue Share (%), by Software Type 2024 & 2032
- Figure 114: South America Emergency Department Information System Industry Volume Share (%), by Software Type 2024 & 2032
- Figure 115: South America Emergency Department Information System Industry Revenue (Million), by End User 2024 & 2032
- Figure 116: South America Emergency Department Information System Industry Volume (K Unit), by End User 2024 & 2032
- Figure 117: South America Emergency Department Information System Industry Revenue Share (%), by End User 2024 & 2032
- Figure 118: South America Emergency Department Information System Industry Volume Share (%), by End User 2024 & 2032
- Figure 119: South America Emergency Department Information System Industry Revenue (Million), by Country 2024 & 2032
- Figure 120: South America Emergency Department Information System Industry Volume (K Unit), by Country 2024 & 2032
- Figure 121: South America Emergency Department Information System Industry Revenue Share (%), by Country 2024 & 2032
- Figure 122: South America Emergency Department Information System Industry Volume Share (%), by Country 2024 & 2032
List of Tables
- Table 1: Global Emergency Department Information System Industry Revenue Million Forecast, by Region 2019 & 2032
- Table 2: Global Emergency Department Information System Industry Volume K Unit Forecast, by Region 2019 & 2032
- Table 3: Global Emergency Department Information System Industry Revenue Million Forecast, by Application 2019 & 2032
- Table 4: Global Emergency Department Information System Industry Volume K Unit Forecast, by Application 2019 & 2032
- Table 5: Global Emergency Department Information System Industry Revenue Million Forecast, by Deployment 2019 & 2032
- Table 6: Global Emergency Department Information System Industry Volume K Unit Forecast, by Deployment 2019 & 2032
- Table 7: Global Emergency Department Information System Industry Revenue Million Forecast, by Software Type 2019 & 2032
- Table 8: Global Emergency Department Information System Industry Volume K Unit Forecast, by Software Type 2019 & 2032
- Table 9: Global Emergency Department Information System Industry Revenue Million Forecast, by End User 2019 & 2032
- Table 10: Global Emergency Department Information System Industry Volume K Unit Forecast, by End User 2019 & 2032
- Table 11: Global Emergency Department Information System Industry Revenue Million Forecast, by Region 2019 & 2032
- Table 12: Global Emergency Department Information System Industry Volume K Unit Forecast, by Region 2019 & 2032
- Table 13: Global Emergency Department Information System Industry Revenue Million Forecast, by Country 2019 & 2032
- Table 14: Global Emergency Department Information System Industry Volume K Unit Forecast, by Country 2019 & 2032
- Table 15: United States Emergency Department Information System Industry Revenue (Million) Forecast, by Application 2019 & 2032
- Table 16: United States Emergency Department Information System Industry Volume (K Unit) Forecast, by Application 2019 & 2032
- Table 17: Canada Emergency Department Information System Industry Revenue (Million) Forecast, by Application 2019 & 2032
- Table 18: Canada Emergency Department Information System Industry Volume (K Unit) Forecast, by Application 2019 & 2032
- Table 19: Mexico Emergency Department Information System Industry Revenue (Million) Forecast, by Application 2019 & 2032
- Table 20: Mexico Emergency Department Information System Industry Volume (K Unit) Forecast, by Application 2019 & 2032
- Table 21: Global Emergency Department Information System Industry Revenue Million Forecast, by Country 2019 & 2032
- Table 22: Global Emergency Department Information System Industry Volume K Unit Forecast, by Country 2019 & 2032
- Table 23: Germany Emergency Department Information System Industry Revenue (Million) Forecast, by Application 2019 & 2032
- Table 24: Germany Emergency Department Information System Industry Volume (K Unit) Forecast, by Application 2019 & 2032
- Table 25: United Kingdom Emergency Department Information System Industry Revenue (Million) Forecast, by Application 2019 & 2032
- Table 26: United Kingdom Emergency Department Information System Industry Volume (K Unit) Forecast, by Application 2019 & 2032
- Table 27: France Emergency Department Information System Industry Revenue (Million) Forecast, by Application 2019 & 2032
- Table 28: France Emergency Department Information System Industry Volume (K Unit) Forecast, by Application 2019 & 2032
- Table 29: Italy Emergency Department Information System Industry Revenue (Million) Forecast, by Application 2019 & 2032
- Table 30: Italy Emergency Department Information System Industry Volume (K Unit) Forecast, by Application 2019 & 2032
- Table 31: Spain Emergency Department Information System Industry Revenue (Million) Forecast, by Application 2019 & 2032
- Table 32: Spain Emergency Department Information System Industry Volume (K Unit) Forecast, by Application 2019 & 2032
- Table 33: Rest of Europe Emergency Department Information System Industry Revenue (Million) Forecast, by Application 2019 & 2032
- Table 34: Rest of Europe Emergency Department Information System Industry Volume (K Unit) Forecast, by Application 2019 & 2032
- Table 35: Global Emergency Department Information System Industry Revenue Million Forecast, by Country 2019 & 2032
- Table 36: Global Emergency Department Information System Industry Volume K Unit Forecast, by Country 2019 & 2032
- Table 37: China Emergency Department Information System Industry Revenue (Million) Forecast, by Application 2019 & 2032
- Table 38: China Emergency Department Information System Industry Volume (K Unit) Forecast, by Application 2019 & 2032
- Table 39: Japan Emergency Department Information System Industry Revenue (Million) Forecast, by Application 2019 & 2032
- Table 40: Japan Emergency Department Information System Industry Volume (K Unit) Forecast, by Application 2019 & 2032
- Table 41: India Emergency Department Information System Industry Revenue (Million) Forecast, by Application 2019 & 2032
- Table 42: India Emergency Department Information System Industry Volume (K Unit) Forecast, by Application 2019 & 2032
- Table 43: Australia Emergency Department Information System Industry Revenue (Million) Forecast, by Application 2019 & 2032
- Table 44: Australia Emergency Department Information System Industry Volume (K Unit) Forecast, by Application 2019 & 2032
- Table 45: South Korea Emergency Department Information System Industry Revenue (Million) Forecast, by Application 2019 & 2032
- Table 46: South Korea Emergency Department Information System Industry Volume (K Unit) Forecast, by Application 2019 & 2032
- Table 47: Rest of Asia Pacific Emergency Department Information System Industry Revenue (Million) Forecast, by Application 2019 & 2032
- Table 48: Rest of Asia Pacific Emergency Department Information System Industry Volume (K Unit) Forecast, by Application 2019 & 2032
- Table 49: Global Emergency Department Information System Industry Revenue Million Forecast, by Country 2019 & 2032
- Table 50: Global Emergency Department Information System Industry Volume K Unit Forecast, by Country 2019 & 2032
- Table 51: GCC Emergency Department Information System Industry Revenue (Million) Forecast, by Application 2019 & 2032
- Table 52: GCC Emergency Department Information System Industry Volume (K Unit) Forecast, by Application 2019 & 2032
- Table 53: South Africa Emergency Department Information System Industry Revenue (Million) Forecast, by Application 2019 & 2032
- Table 54: South Africa Emergency Department Information System Industry Volume (K Unit) Forecast, by Application 2019 & 2032
- Table 55: Rest of Middle East and Africa Emergency Department Information System Industry Revenue (Million) Forecast, by Application 2019 & 2032
- Table 56: Rest of Middle East and Africa Emergency Department Information System Industry Volume (K Unit) Forecast, by Application 2019 & 2032
- Table 57: Global Emergency Department Information System Industry Revenue Million Forecast, by Country 2019 & 2032
- Table 58: Global Emergency Department Information System Industry Volume K Unit Forecast, by Country 2019 & 2032
- Table 59: Brazil Emergency Department Information System Industry Revenue (Million) Forecast, by Application 2019 & 2032
- Table 60: Brazil Emergency Department Information System Industry Volume (K Unit) Forecast, by Application 2019 & 2032
- Table 61: Argentina Emergency Department Information System Industry Revenue (Million) Forecast, by Application 2019 & 2032
- Table 62: Argentina Emergency Department Information System Industry Volume (K Unit) Forecast, by Application 2019 & 2032
- Table 63: Rest of South America Emergency Department Information System Industry Revenue (Million) Forecast, by Application 2019 & 2032
- Table 64: Rest of South America Emergency Department Information System Industry Volume (K Unit) Forecast, by Application 2019 & 2032
- Table 65: Global Emergency Department Information System Industry Revenue Million Forecast, by Application 2019 & 2032
- Table 66: Global Emergency Department Information System Industry Volume K Unit Forecast, by Application 2019 & 2032
- Table 67: Global Emergency Department Information System Industry Revenue Million Forecast, by Deployment 2019 & 2032
- Table 68: Global Emergency Department Information System Industry Volume K Unit Forecast, by Deployment 2019 & 2032
- Table 69: Global Emergency Department Information System Industry Revenue Million Forecast, by Software Type 2019 & 2032
- Table 70: Global Emergency Department Information System Industry Volume K Unit Forecast, by Software Type 2019 & 2032
- Table 71: Global Emergency Department Information System Industry Revenue Million Forecast, by End User 2019 & 2032
- Table 72: Global Emergency Department Information System Industry Volume K Unit Forecast, by End User 2019 & 2032
- Table 73: Global Emergency Department Information System Industry Revenue Million Forecast, by Country 2019 & 2032
- Table 74: Global Emergency Department Information System Industry Volume K Unit Forecast, by Country 2019 & 2032
- Table 75: United States Emergency Department Information System Industry Revenue (Million) Forecast, by Application 2019 & 2032
- Table 76: United States Emergency Department Information System Industry Volume (K Unit) Forecast, by Application 2019 & 2032
- Table 77: Canada Emergency Department Information System Industry Revenue (Million) Forecast, by Application 2019 & 2032
- Table 78: Canada Emergency Department Information System Industry Volume (K Unit) Forecast, by Application 2019 & 2032
- Table 79: Mexico Emergency Department Information System Industry Revenue (Million) Forecast, by Application 2019 & 2032
- Table 80: Mexico Emergency Department Information System Industry Volume (K Unit) Forecast, by Application 2019 & 2032
- Table 81: Global Emergency Department Information System Industry Revenue Million Forecast, by Application 2019 & 2032
- Table 82: Global Emergency Department Information System Industry Volume K Unit Forecast, by Application 2019 & 2032
- Table 83: Global Emergency Department Information System Industry Revenue Million Forecast, by Deployment 2019 & 2032
- Table 84: Global Emergency Department Information System Industry Volume K Unit Forecast, by Deployment 2019 & 2032
- Table 85: Global Emergency Department Information System Industry Revenue Million Forecast, by Software Type 2019 & 2032
- Table 86: Global Emergency Department Information System Industry Volume K Unit Forecast, by Software Type 2019 & 2032
- Table 87: Global Emergency Department Information System Industry Revenue Million Forecast, by End User 2019 & 2032
- Table 88: Global Emergency Department Information System Industry Volume K Unit Forecast, by End User 2019 & 2032
- Table 89: Global Emergency Department Information System Industry Revenue Million Forecast, by Country 2019 & 2032
- Table 90: Global Emergency Department Information System Industry Volume K Unit Forecast, by Country 2019 & 2032
- Table 91: Germany Emergency Department Information System Industry Revenue (Million) Forecast, by Application 2019 & 2032
- Table 92: Germany Emergency Department Information System Industry Volume (K Unit) Forecast, by Application 2019 & 2032
- Table 93: United Kingdom Emergency Department Information System Industry Revenue (Million) Forecast, by Application 2019 & 2032
- Table 94: United Kingdom Emergency Department Information System Industry Volume (K Unit) Forecast, by Application 2019 & 2032
- Table 95: France Emergency Department Information System Industry Revenue (Million) Forecast, by Application 2019 & 2032
- Table 96: France Emergency Department Information System Industry Volume (K Unit) Forecast, by Application 2019 & 2032
- Table 97: Italy Emergency Department Information System Industry Revenue (Million) Forecast, by Application 2019 & 2032
- Table 98: Italy Emergency Department Information System Industry Volume (K Unit) Forecast, by Application 2019 & 2032
- Table 99: Spain Emergency Department Information System Industry Revenue (Million) Forecast, by Application 2019 & 2032
- Table 100: Spain Emergency Department Information System Industry Volume (K Unit) Forecast, by Application 2019 & 2032
- Table 101: Rest of Europe Emergency Department Information System Industry Revenue (Million) Forecast, by Application 2019 & 2032
- Table 102: Rest of Europe Emergency Department Information System Industry Volume (K Unit) Forecast, by Application 2019 & 2032
- Table 103: Global Emergency Department Information System Industry Revenue Million Forecast, by Application 2019 & 2032
- Table 104: Global Emergency Department Information System Industry Volume K Unit Forecast, by Application 2019 & 2032
- Table 105: Global Emergency Department Information System Industry Revenue Million Forecast, by Deployment 2019 & 2032
- Table 106: Global Emergency Department Information System Industry Volume K Unit Forecast, by Deployment 2019 & 2032
- Table 107: Global Emergency Department Information System Industry Revenue Million Forecast, by Software Type 2019 & 2032
- Table 108: Global Emergency Department Information System Industry Volume K Unit Forecast, by Software Type 2019 & 2032
- Table 109: Global Emergency Department Information System Industry Revenue Million Forecast, by End User 2019 & 2032
- Table 110: Global Emergency Department Information System Industry Volume K Unit Forecast, by End User 2019 & 2032
- Table 111: Global Emergency Department Information System Industry Revenue Million Forecast, by Country 2019 & 2032
- Table 112: Global Emergency Department Information System Industry Volume K Unit Forecast, by Country 2019 & 2032
- Table 113: China Emergency Department Information System Industry Revenue (Million) Forecast, by Application 2019 & 2032
- Table 114: China Emergency Department Information System Industry Volume (K Unit) Forecast, by Application 2019 & 2032
- Table 115: Japan Emergency Department Information System Industry Revenue (Million) Forecast, by Application 2019 & 2032
- Table 116: Japan Emergency Department Information System Industry Volume (K Unit) Forecast, by Application 2019 & 2032
- Table 117: India Emergency Department Information System Industry Revenue (Million) Forecast, by Application 2019 & 2032
- Table 118: India Emergency Department Information System Industry Volume (K Unit) Forecast, by Application 2019 & 2032
- Table 119: Australia Emergency Department Information System Industry Revenue (Million) Forecast, by Application 2019 & 2032
- Table 120: Australia Emergency Department Information System Industry Volume (K Unit) Forecast, by Application 2019 & 2032
- Table 121: South Korea Emergency Department Information System Industry Revenue (Million) Forecast, by Application 2019 & 2032
- Table 122: South Korea Emergency Department Information System Industry Volume (K Unit) Forecast, by Application 2019 & 2032
- Table 123: Rest of Asia Pacific Emergency Department Information System Industry Revenue (Million) Forecast, by Application 2019 & 2032
- Table 124: Rest of Asia Pacific Emergency Department Information System Industry Volume (K Unit) Forecast, by Application 2019 & 2032
- Table 125: Global Emergency Department Information System Industry Revenue Million Forecast, by Application 2019 & 2032
- Table 126: Global Emergency Department Information System Industry Volume K Unit Forecast, by Application 2019 & 2032
- Table 127: Global Emergency Department Information System Industry Revenue Million Forecast, by Deployment 2019 & 2032
- Table 128: Global Emergency Department Information System Industry Volume K Unit Forecast, by Deployment 2019 & 2032
- Table 129: Global Emergency Department Information System Industry Revenue Million Forecast, by Software Type 2019 & 2032
- Table 130: Global Emergency Department Information System Industry Volume K Unit Forecast, by Software Type 2019 & 2032
- Table 131: Global Emergency Department Information System Industry Revenue Million Forecast, by End User 2019 & 2032
- Table 132: Global Emergency Department Information System Industry Volume K Unit Forecast, by End User 2019 & 2032
- Table 133: Global Emergency Department Information System Industry Revenue Million Forecast, by Country 2019 & 2032
- Table 134: Global Emergency Department Information System Industry Volume K Unit Forecast, by Country 2019 & 2032
- Table 135: GCC Emergency Department Information System Industry Revenue (Million) Forecast, by Application 2019 & 2032
- Table 136: GCC Emergency Department Information System Industry Volume (K Unit) Forecast, by Application 2019 & 2032
- Table 137: South Africa Emergency Department Information System Industry Revenue (Million) Forecast, by Application 2019 & 2032
- Table 138: South Africa Emergency Department Information System Industry Volume (K Unit) Forecast, by Application 2019 & 2032
- Table 139: Rest of Middle East and Africa Emergency Department Information System Industry Revenue (Million) Forecast, by Application 2019 & 2032
- Table 140: Rest of Middle East and Africa Emergency Department Information System Industry Volume (K Unit) Forecast, by Application 2019 & 2032
- Table 141: Global Emergency Department Information System Industry Revenue Million Forecast, by Application 2019 & 2032
- Table 142: Global Emergency Department Information System Industry Volume K Unit Forecast, by Application 2019 & 2032
- Table 143: Global Emergency Department Information System Industry Revenue Million Forecast, by Deployment 2019 & 2032
- Table 144: Global Emergency Department Information System Industry Volume K Unit Forecast, by Deployment 2019 & 2032
- Table 145: Global Emergency Department Information System Industry Revenue Million Forecast, by Software Type 2019 & 2032
- Table 146: Global Emergency Department Information System Industry Volume K Unit Forecast, by Software Type 2019 & 2032
- Table 147: Global Emergency Department Information System Industry Revenue Million Forecast, by End User 2019 & 2032
- Table 148: Global Emergency Department Information System Industry Volume K Unit Forecast, by End User 2019 & 2032
- Table 149: Global Emergency Department Information System Industry Revenue Million Forecast, by Country 2019 & 2032
- Table 150: Global Emergency Department Information System Industry Volume K Unit Forecast, by Country 2019 & 2032
- Table 151: Brazil Emergency Department Information System Industry Revenue (Million) Forecast, by Application 2019 & 2032
- Table 152: Brazil Emergency Department Information System Industry Volume (K Unit) Forecast, by Application 2019 & 2032
- Table 153: Argentina Emergency Department Information System Industry Revenue (Million) Forecast, by Application 2019 & 2032
- Table 154: Argentina Emergency Department Information System Industry Volume (K Unit) Forecast, by Application 2019 & 2032
- Table 155: Rest of South America Emergency Department Information System Industry Revenue (Million) Forecast, by Application 2019 & 2032
- Table 156: Rest of South America Emergency Department Information System Industry Volume (K Unit) Forecast, by Application 2019 & 2032
Frequently Asked Questions
1. What is the projected Compound Annual Growth Rate (CAGR) of the Emergency Department Information System Industry?
The projected CAGR is approximately 14.37%.
2. Which companies are prominent players in the Emergency Department Information System Industry?
Key companies in the market include Epic Systems, Mckesson Corporation, EPOWERdoc Inc, MEDHOST Inc, Unitedhealth Group Inc, Cerner Corporation, Medical Information Technology Inc, Logibec Canada, Allscripts Healthcare Solutions Inc, T-Systems Inc, Evident, Medsphere Systems Corporation.
3. What are the main segments of the Emergency Department Information System Industry?
The market segments include Application, Deployment, Software Type, End User.
4. Can you provide details about the market size?
The market size is estimated to be USD 1.03 Million as of 2022.
5. What are some drivers contributing to market growth?
Rise in the Geriatric Population; Increasing Use Of Data-Driven Technologies; Increase in Number of Insured Population.
6. What are the notable trends driving market growth?
Best of Breed (B.O.B.) Solutions are Anticipated to be the Dominant Segment in Software Type During the Forecast Period.
7. Are there any restraints impacting market growth?
Adverse Quality and Safety Implications Of EDIS; Lack of Skilled Healthcare IT Professionals.
8. Can you provide examples of recent developments in the market?
In March 2022, HeartBeam, Inc. signed a Business Associate Agreement (BAA) and a Clinical Trial Agreement (CTA) with Phoebe Putney Health System to conduct a pilot study designed to evaluate HeartBeam's Emergency Department (ED) Myocardial Infarction (MI) software product.
9. What pricing options are available for accessing the report?
Pricing options include single-user, multi-user, and enterprise licenses priced at USD 4750, USD 5250, and USD 8750 respectively.
10. Is the market size provided in terms of value or volume?
The market size is provided in terms of value, measured in Million and volume, measured in K Unit.
11. Are there any specific market keywords associated with the report?
Yes, the market keyword associated with the report is "Emergency Department Information System Industry," which aids in identifying and referencing the specific market segment covered.
12. How do I determine which pricing option suits my needs best?
The pricing options vary based on user requirements and access needs. Individual users may opt for single-user licenses, while businesses requiring broader access may choose multi-user or enterprise licenses for cost-effective access to the report.
13. Are there any additional resources or data provided in the Emergency Department Information System Industry report?
While the report offers comprehensive insights, it's advisable to review the specific contents or supplementary materials provided to ascertain if additional resources or data are available.
14. How can I stay updated on further developments or reports in the Emergency Department Information System Industry?
To stay informed about further developments, trends, and reports in the Emergency Department Information System Industry, consider subscribing to industry newsletters, following relevant companies and organizations, or regularly checking reputable industry news sources and publications.
Methodology
Step 1 - Identification of Relevant Samples Size from Population Database


Step 2 - Approaches for Defining Global Market Size (Value, Volume* & Price*)

Note*: In applicable scenarios
Step 3 - Data Sources
Primary Research
- Web Analytics
- Survey Reports
- Research Institute
- Latest Research Reports
- Opinion Leaders
Secondary Research
- Annual Reports
- White Paper
- Latest Press Release
- Industry Association
- Paid Database
- Investor Presentations

Step 4 - Data Triangulation
Involves using different sources of information in order to increase the validity of a study
These sources are likely to be stakeholders in a program - participants, other researchers, program staff, other community members, and so on.
Then we put all data in single framework & apply various statistical tools to find out the dynamic on the market.
During the analysis stage, feedback from the stakeholder groups would be compared to determine areas of agreement as well as areas of divergence


