
Key Insights
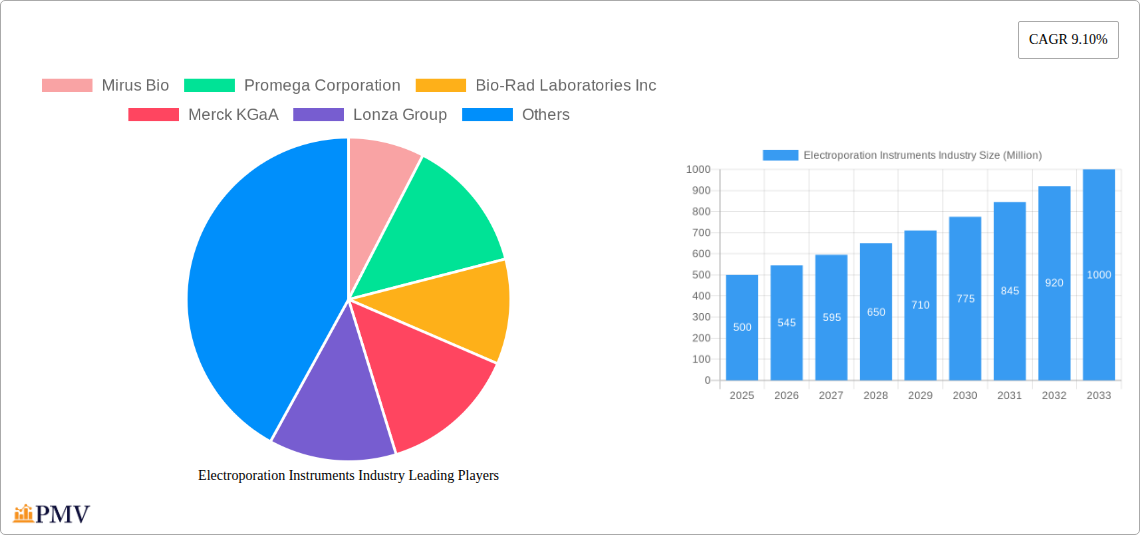
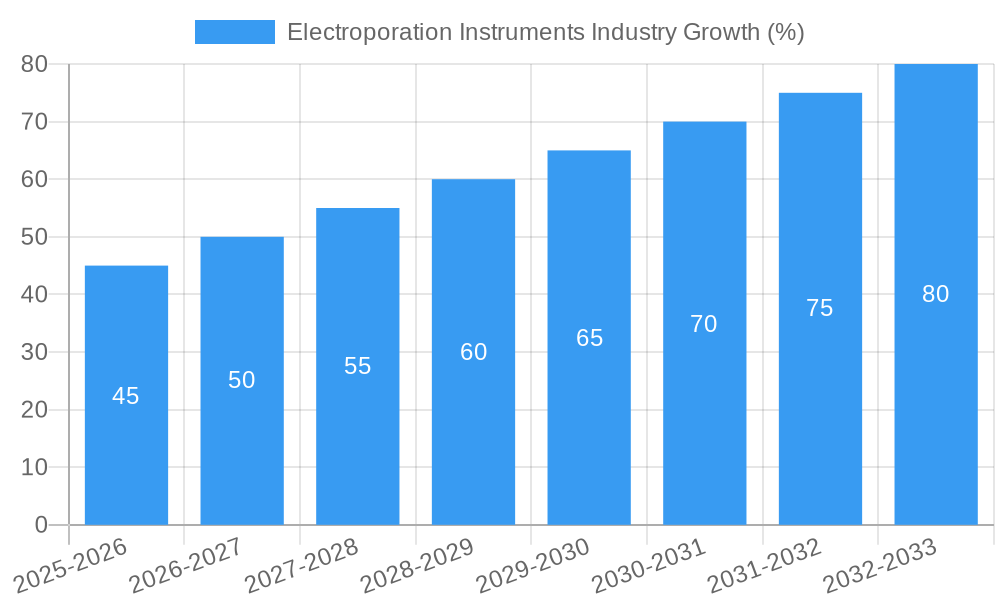
The global electroporation instruments market is experiencing robust growth, driven by the increasing adoption of electroporation techniques in various life science applications. The market's Compound Annual Growth Rate (CAGR) of 9.10% from 2019 to 2024 suggests a significant expansion, which is expected to continue through 2033. Key drivers include the rising demand for efficient gene and drug delivery systems in biomedical research, the burgeoning therapeutic delivery market, and the increasing focus on cell-based therapies. Furthermore, advancements in electroporation technology, such as the development of more precise and efficient instruments, are contributing to market expansion. The reagent-based method segment currently holds a larger market share due to its cost-effectiveness and ease of use, while the instrument-based method segment is poised for significant growth due to the increasing demand for high-throughput and automated systems. Biomedical research remains the dominant application area, owing to the widespread use of electroporation in gene editing, cell transfection, and other crucial research processes. However, the therapeutic delivery segment is showing strong potential for growth, fueled by the increasing development of innovative therapies involving gene therapy and personalized medicine. Major players like Mirus Bio, Promega Corporation, and Thermo Fisher Scientific are contributing to market growth through continuous innovation and product development. Geographic expansion, particularly in emerging markets in the Asia-Pacific region, presents a significant opportunity for future growth.
The market segmentation by method (reagent-based, instrument-based, other) and application (biomedical research, therapeutic delivery, protein production) provides a granular understanding of market dynamics. The competitive landscape is characterized by the presence of both established players and emerging companies, leading to healthy competition and continuous innovation. Despite the positive growth trajectory, certain restraints, such as the high cost of advanced electroporation instruments and the potential for adverse effects associated with the technology, could pose challenges to market growth. Nevertheless, the ongoing technological advancements, the increasing demand for personalized medicine, and growing investments in biomedical research are expected to mitigate these challenges and ensure continued market expansion throughout the forecast period. We estimate the market size in 2025 to be approximately $500 million (this is an estimation based on the provided CAGR and assuming a reasonable starting market size in 2019), with further growth anticipated in the coming years.
Electroporation Instruments Industry: A Comprehensive Market Report (2019-2033)
This comprehensive report provides a detailed analysis of the global electroporation instruments industry, offering valuable insights into market structure, competitive dynamics, growth drivers, and future trends. Covering the period from 2019 to 2033, with 2025 as the base year and a forecast period of 2025-2033, this report is an indispensable resource for industry professionals, investors, and researchers. The report segments the market by method (Reagent-based, Instrument-based, Other), application (Biomedical Research, Therapeutic Delivery, Protein Production), and key players including Mirus Bio, Promega Corporation, Bio-Rad Laboratories Inc, Merck KGaA, Lonza Group, Altogen Biosystems, Polyplus-transfection SA, SignaGen Laboratories, Qiagen NV, and Thermo Fisher Scientific. The total market size in 2025 is estimated at xx Million.
Electroporation Instruments Industry Market Structure & Competitive Dynamics
The electroporation instruments market exhibits a moderately concentrated structure, with several multinational corporations holding significant market share. The industry is characterized by intense competition, driven by continuous product innovation, strategic partnerships, and mergers and acquisitions (M&A). Key players compete based on technological advancements, product portfolio breadth, and global reach. Market share is dynamic, with established players facing challenges from emerging companies offering innovative solutions. Over the historical period (2019-2024), M&A activity has been significant, with deal values totaling approximately xx Million, primarily focused on expanding product portfolios and geographical reach. Regulatory frameworks, particularly those related to biomedical research and therapeutic applications, significantly impact market growth and competitiveness. The substitution effect from alternative gene delivery methods is a notable factor, influencing market dynamics. End-user trends, particularly the increasing adoption of electroporation in cell and gene therapy, are major growth drivers.
- Market Concentration: Moderately concentrated, with top 10 players holding approximately xx% of market share in 2025.
- Innovation Ecosystem: Active, with continuous development of new reagents, instruments, and applications.
- Regulatory Frameworks: Stringent, impacting product development and market access.
- Product Substitutes: Alternative gene delivery methods pose a competitive threat.
- M&A Activity: Significant, driving market consolidation and expansion.
Electroporation Instruments Industry Industry Trends & Insights
The global electroporation instruments market is experiencing robust growth, driven by several factors. The increasing adoption of cell and gene therapies, fueled by advancements in personalized medicine and targeted drug delivery, is a primary growth driver. Technological advancements, such as the development of more efficient and precise electroporation instruments, are further accelerating market expansion. The rising prevalence of chronic diseases necessitates innovative therapeutic approaches, boosting demand for electroporation-based solutions. The market is witnessing a shift towards high-throughput systems to meet the increasing demand in research and manufacturing. This trend is also pushing for automation in the process and further technological advancements. The compound annual growth rate (CAGR) for the period 2025-2033 is projected to be xx%, with the market penetration expected to reach xx% by 2033. Competitive dynamics, including product differentiation and strategic alliances, significantly influence market growth and direction.
Dominant Markets & Segments in Electroporation Instruments Industry
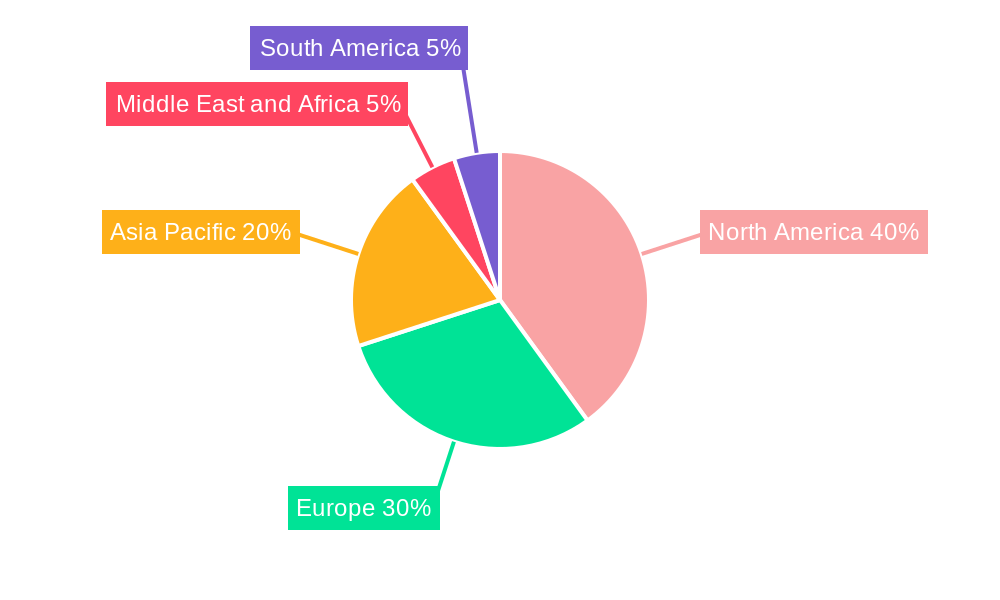
The North American region dominates the global electroporation instruments market, driven by robust investments in biomedical research and a strong regulatory framework supporting the development and commercialization of innovative technologies. Within the segments, the instrument-based method holds the largest market share due to its increased efficiency and precision compared to reagent-based methods. The biomedical research application segment is currently the largest market segment, however, the therapeutic delivery application is projected to experience the highest growth rate during the forecast period due to the growing cell and gene therapy market.
- Leading Region: North America
- Key Drivers: High R&D spending, well-established healthcare infrastructure, strong regulatory support.
- Dominant Method: Instrument-based Method
- Key Drivers: Increased efficiency, precision, and automation capabilities.
- Largest Application: Biomedical Research
- Key Drivers: Extensive research activities in cell biology, genomics, and drug discovery.
Electroporation Instruments Industry Product Innovations
Recent innovations focus on miniaturization, increased throughput, improved precision, and automation of electroporation instruments. New reagent formulations aim to enhance transfection efficiency and reduce cytotoxicity. The integration of advanced technologies such as microfluidics and artificial intelligence is further enhancing the capabilities of electroporation systems. These innovations address the growing need for high-throughput screening in drug discovery and personalized medicine, increasing market adoption.
Report Segmentation & Scope
This report segments the electroporation instruments market by method (Reagent-based, Instrument-based, Other), and application (Biomedical Research, Therapeutic Delivery, Protein Production). The reagent-based method segment is projected to grow at a CAGR of xx% during the forecast period. The instrument-based method segment is expected to dominate the market, driven by the growing adoption of automated and high-throughput systems. Other methods, such as microinjection, are niche segments with limited market share. The biomedical research segment is expected to continue its dominance, fueled by increased R&D investment. The therapeutic delivery and protein production segments are projected to show significant growth due to rising demand for advanced therapies and biopharmaceuticals. The competitive dynamics within each segment are characterized by strong competition among established players and emerging innovative companies.
Key Drivers of Electroporation Instruments Industry Growth
Several factors are driving the growth of the electroporation instruments industry. Technological advancements, particularly in microfluidics and automation, are leading to more efficient and precise instruments. The increasing prevalence of chronic diseases is driving demand for innovative therapeutic solutions, boosting the adoption of electroporation-based therapies. Favorable regulatory environments in key markets are encouraging investment and market expansion. Government initiatives promoting cell and gene therapy research and development further contribute to market growth.
Challenges in the Electroporation Instruments Industry Sector
The electroporation instruments industry faces several challenges. Stringent regulatory requirements for medical devices and therapeutic applications pose significant hurdles for product approval and market access. Supply chain disruptions, particularly in the procurement of specialized components, can impact production and availability. Intense competition from established players and new entrants creates pricing pressures and limits profit margins. These factors collectively influence market expansion and competitiveness.
Leading Players in the Electroporation Instruments Industry Market
- Mirus Bio
- Promega Corporation
- Bio-Rad Laboratories Inc
- Merck KGaA
- Lonza Group
- Altogen Biosystems
- Polyplus-transfection SA
- SignaGen Laboratories
- Qiagen NV
- Thermo Fisher Scientific
Key Developments in Electroporation Instruments Industry Sector
- September 2022: Polyplus launched the in vivo-jetRNA+ transfection reagent for in vivo mRNA delivery, expanding its mRNA support portfolio and strengthening its position in the cell and gene therapy market.
- February 2022: Mirus Bio launched TransIT-VirusGEN SELECT Transfection Kits for large-scale viral vector production, catering to the growing demand for cell and gene therapy applications.
Strategic Electroporation Instruments Industry Market Outlook
The future of the electroporation instruments industry is bright, with significant growth potential driven by ongoing technological advancements, rising demand for cell and gene therapies, and increasing investments in biomedical research. Strategic opportunities exist in developing innovative electroporation techniques for improved efficiency and reduced cytotoxicity, expanding into emerging markets, and forming strategic collaborations to accelerate market penetration. Further automation and integration with AI are predicted to revolutionize electroporation applications in the coming years.
Electroporation Instruments Industry Segmentation
-
1. Method
- 1.1. Reagent-based Method
- 1.2. Instrument-based Method
- 1.3. Other Methods
-
2. Application
- 2.1. Biomedical Research
- 2.2. Therapeutic Delivery
- 2.3. Protein Production
Electroporation Instruments Industry Segmentation By Geography
-
1. North America
- 1.1. United States
- 1.2. Canada
- 1.3. Mexico
-
2. Europe
- 2.1. Germany
- 2.2. United Kingdom
- 2.3. France
- 2.4. Italy
- 2.5. Spain
- 2.6. Rest of Europe
-
3. Asia Pacific
- 3.1. China
- 3.2. Japan
- 3.3. India
- 3.4. Australia
- 3.5. South Korea
- 3.6. Rest of Asia Pacific
-
4. Middle East and Africa
- 4.1. GCC
- 4.2. South Africa
- 4.3. Rest of Middle East and Africa
-
5. South America
- 5.1. Brazil
- 5.2. Argentina
- 5.3. Rest of South America
Electroporation Instruments Industry REPORT HIGHLIGHTS
| Aspects | Details |
|---|---|
| Study Period | 2019-2033 |
| Base Year | 2024 |
| Estimated Year | 2025 |
| Forecast Period | 2025-2033 |
| Historical Period | 2019-2024 |
| Growth Rate | CAGR of 9.10% from 2019-2033 |
| Segmentation |
|
Table of Contents
- 1. Introduction
- 1.1. Research Scope
- 1.2. Market Segmentation
- 1.3. Research Methodology
- 1.4. Definitions and Assumptions
- 2. Executive Summary
- 2.1. Introduction
- 3. Market Dynamics
- 3.1. Introduction
- 3.2. Market Drivers
- 3.2.1. Rising Incidences of Chronic Diseases; Increase in Research & Development in the Field of Cell Based Therapies
- 3.3. Market Restrains
- 3.3.1. High Cost of Transfection Technology Instruments
- 3.4. Market Trends
- 3.4.1. Reagent-based Method is Showing Significant Growth in the Transfection Technologies Market
- 4. Market Factor Analysis
- 4.1. Porters Five Forces
- 4.2. Supply/Value Chain
- 4.3. PESTEL analysis
- 4.4. Market Entropy
- 4.5. Patent/Trademark Analysis
- 5. Global Electroporation Instruments Industry Analysis, Insights and Forecast, 2019-2031
- 5.1. Market Analysis, Insights and Forecast - by Method
- 5.1.1. Reagent-based Method
- 5.1.2. Instrument-based Method
- 5.1.3. Other Methods
- 5.2. Market Analysis, Insights and Forecast - by Application
- 5.2.1. Biomedical Research
- 5.2.2. Therapeutic Delivery
- 5.2.3. Protein Production
- 5.3. Market Analysis, Insights and Forecast - by Region
- 5.3.1. North America
- 5.3.2. Europe
- 5.3.3. Asia Pacific
- 5.3.4. Middle East and Africa
- 5.3.5. South America
- 5.1. Market Analysis, Insights and Forecast - by Method
- 6. North America Electroporation Instruments Industry Analysis, Insights and Forecast, 2019-2031
- 6.1. Market Analysis, Insights and Forecast - by Method
- 6.1.1. Reagent-based Method
- 6.1.2. Instrument-based Method
- 6.1.3. Other Methods
- 6.2. Market Analysis, Insights and Forecast - by Application
- 6.2.1. Biomedical Research
- 6.2.2. Therapeutic Delivery
- 6.2.3. Protein Production
- 6.1. Market Analysis, Insights and Forecast - by Method
- 7. Europe Electroporation Instruments Industry Analysis, Insights and Forecast, 2019-2031
- 7.1. Market Analysis, Insights and Forecast - by Method
- 7.1.1. Reagent-based Method
- 7.1.2. Instrument-based Method
- 7.1.3. Other Methods
- 7.2. Market Analysis, Insights and Forecast - by Application
- 7.2.1. Biomedical Research
- 7.2.2. Therapeutic Delivery
- 7.2.3. Protein Production
- 7.1. Market Analysis, Insights and Forecast - by Method
- 8. Asia Pacific Electroporation Instruments Industry Analysis, Insights and Forecast, 2019-2031
- 8.1. Market Analysis, Insights and Forecast - by Method
- 8.1.1. Reagent-based Method
- 8.1.2. Instrument-based Method
- 8.1.3. Other Methods
- 8.2. Market Analysis, Insights and Forecast - by Application
- 8.2.1. Biomedical Research
- 8.2.2. Therapeutic Delivery
- 8.2.3. Protein Production
- 8.1. Market Analysis, Insights and Forecast - by Method
- 9. Middle East and Africa Electroporation Instruments Industry Analysis, Insights and Forecast, 2019-2031
- 9.1. Market Analysis, Insights and Forecast - by Method
- 9.1.1. Reagent-based Method
- 9.1.2. Instrument-based Method
- 9.1.3. Other Methods
- 9.2. Market Analysis, Insights and Forecast - by Application
- 9.2.1. Biomedical Research
- 9.2.2. Therapeutic Delivery
- 9.2.3. Protein Production
- 9.1. Market Analysis, Insights and Forecast - by Method
- 10. South America Electroporation Instruments Industry Analysis, Insights and Forecast, 2019-2031
- 10.1. Market Analysis, Insights and Forecast - by Method
- 10.1.1. Reagent-based Method
- 10.1.2. Instrument-based Method
- 10.1.3. Other Methods
- 10.2. Market Analysis, Insights and Forecast - by Application
- 10.2.1. Biomedical Research
- 10.2.2. Therapeutic Delivery
- 10.2.3. Protein Production
- 10.1. Market Analysis, Insights and Forecast - by Method
- 11. North America Electroporation Instruments Industry Analysis, Insights and Forecast, 2019-2031
- 11.1. Market Analysis, Insights and Forecast - By Country/Sub-region
- 11.1.1. undefined
- 12. Europe Electroporation Instruments Industry Analysis, Insights and Forecast, 2019-2031
- 12.1. Market Analysis, Insights and Forecast - By Country/Sub-region
- 12.1.1. undefined
- 13. Asia Pacific Electroporation Instruments Industry Analysis, Insights and Forecast, 2019-2031
- 13.1. Market Analysis, Insights and Forecast - By Country/Sub-region
- 13.1.1. undefined
- 14. Middle East and Africa Electroporation Instruments Industry Analysis, Insights and Forecast, 2019-2031
- 14.1. Market Analysis, Insights and Forecast - By Country/Sub-region
- 14.1.1. undefined
- 15. South America Electroporation Instruments Industry Analysis, Insights and Forecast, 2019-2031
- 15.1. Market Analysis, Insights and Forecast - By Country/Sub-region
- 15.1.1. undefined
- 16. Competitive Analysis
- 16.1. Global Market Share Analysis 2024
- 16.2. Company Profiles
- 16.2.1 Mirus Bio
- 16.2.1.1. Overview
- 16.2.1.2. Products
- 16.2.1.3. SWOT Analysis
- 16.2.1.4. Recent Developments
- 16.2.1.5. Financials (Based on Availability)
- 16.2.2 Promega Corporation
- 16.2.2.1. Overview
- 16.2.2.2. Products
- 16.2.2.3. SWOT Analysis
- 16.2.2.4. Recent Developments
- 16.2.2.5. Financials (Based on Availability)
- 16.2.3 Bio-Rad Laboratories Inc
- 16.2.3.1. Overview
- 16.2.3.2. Products
- 16.2.3.3. SWOT Analysis
- 16.2.3.4. Recent Developments
- 16.2.3.5. Financials (Based on Availability)
- 16.2.4 Merck KGaA
- 16.2.4.1. Overview
- 16.2.4.2. Products
- 16.2.4.3. SWOT Analysis
- 16.2.4.4. Recent Developments
- 16.2.4.5. Financials (Based on Availability)
- 16.2.5 Lonza Group
- 16.2.5.1. Overview
- 16.2.5.2. Products
- 16.2.5.3. SWOT Analysis
- 16.2.5.4. Recent Developments
- 16.2.5.5. Financials (Based on Availability)
- 16.2.6 Altogen Biosystems
- 16.2.6.1. Overview
- 16.2.6.2. Products
- 16.2.6.3. SWOT Analysis
- 16.2.6.4. Recent Developments
- 16.2.6.5. Financials (Based on Availability)
- 16.2.7 Polyplus-transfection SA
- 16.2.7.1. Overview
- 16.2.7.2. Products
- 16.2.7.3. SWOT Analysis
- 16.2.7.4. Recent Developments
- 16.2.7.5. Financials (Based on Availability)
- 16.2.8 SignaGen Laboratories
- 16.2.8.1. Overview
- 16.2.8.2. Products
- 16.2.8.3. SWOT Analysis
- 16.2.8.4. Recent Developments
- 16.2.8.5. Financials (Based on Availability)
- 16.2.9 Qiagen NV
- 16.2.9.1. Overview
- 16.2.9.2. Products
- 16.2.9.3. SWOT Analysis
- 16.2.9.4. Recent Developments
- 16.2.9.5. Financials (Based on Availability)
- 16.2.10 Thermo Fisher Scientific
- 16.2.10.1. Overview
- 16.2.10.2. Products
- 16.2.10.3. SWOT Analysis
- 16.2.10.4. Recent Developments
- 16.2.10.5. Financials (Based on Availability)
- 16.2.1 Mirus Bio
List of Figures
- Figure 1: Global Electroporation Instruments Industry Revenue Breakdown (Million, %) by Region 2024 & 2032
- Figure 2: Global Electroporation Instruments Industry Volume Breakdown (K Unit, %) by Region 2024 & 2032
- Figure 3: North America Electroporation Instruments Industry Revenue (Million), by Country 2024 & 2032
- Figure 4: North America Electroporation Instruments Industry Volume (K Unit), by Country 2024 & 2032
- Figure 5: North America Electroporation Instruments Industry Revenue Share (%), by Country 2024 & 2032
- Figure 6: North America Electroporation Instruments Industry Volume Share (%), by Country 2024 & 2032
- Figure 7: Europe Electroporation Instruments Industry Revenue (Million), by Country 2024 & 2032
- Figure 8: Europe Electroporation Instruments Industry Volume (K Unit), by Country 2024 & 2032
- Figure 9: Europe Electroporation Instruments Industry Revenue Share (%), by Country 2024 & 2032
- Figure 10: Europe Electroporation Instruments Industry Volume Share (%), by Country 2024 & 2032
- Figure 11: Asia Pacific Electroporation Instruments Industry Revenue (Million), by Country 2024 & 2032
- Figure 12: Asia Pacific Electroporation Instruments Industry Volume (K Unit), by Country 2024 & 2032
- Figure 13: Asia Pacific Electroporation Instruments Industry Revenue Share (%), by Country 2024 & 2032
- Figure 14: Asia Pacific Electroporation Instruments Industry Volume Share (%), by Country 2024 & 2032
- Figure 15: Middle East and Africa Electroporation Instruments Industry Revenue (Million), by Country 2024 & 2032
- Figure 16: Middle East and Africa Electroporation Instruments Industry Volume (K Unit), by Country 2024 & 2032
- Figure 17: Middle East and Africa Electroporation Instruments Industry Revenue Share (%), by Country 2024 & 2032
- Figure 18: Middle East and Africa Electroporation Instruments Industry Volume Share (%), by Country 2024 & 2032
- Figure 19: South America Electroporation Instruments Industry Revenue (Million), by Country 2024 & 2032
- Figure 20: South America Electroporation Instruments Industry Volume (K Unit), by Country 2024 & 2032
- Figure 21: South America Electroporation Instruments Industry Revenue Share (%), by Country 2024 & 2032
- Figure 22: South America Electroporation Instruments Industry Volume Share (%), by Country 2024 & 2032
- Figure 23: North America Electroporation Instruments Industry Revenue (Million), by Method 2024 & 2032
- Figure 24: North America Electroporation Instruments Industry Volume (K Unit), by Method 2024 & 2032
- Figure 25: North America Electroporation Instruments Industry Revenue Share (%), by Method 2024 & 2032
- Figure 26: North America Electroporation Instruments Industry Volume Share (%), by Method 2024 & 2032
- Figure 27: North America Electroporation Instruments Industry Revenue (Million), by Application 2024 & 2032
- Figure 28: North America Electroporation Instruments Industry Volume (K Unit), by Application 2024 & 2032
- Figure 29: North America Electroporation Instruments Industry Revenue Share (%), by Application 2024 & 2032
- Figure 30: North America Electroporation Instruments Industry Volume Share (%), by Application 2024 & 2032
- Figure 31: North America Electroporation Instruments Industry Revenue (Million), by Country 2024 & 2032
- Figure 32: North America Electroporation Instruments Industry Volume (K Unit), by Country 2024 & 2032
- Figure 33: North America Electroporation Instruments Industry Revenue Share (%), by Country 2024 & 2032
- Figure 34: North America Electroporation Instruments Industry Volume Share (%), by Country 2024 & 2032
- Figure 35: Europe Electroporation Instruments Industry Revenue (Million), by Method 2024 & 2032
- Figure 36: Europe Electroporation Instruments Industry Volume (K Unit), by Method 2024 & 2032
- Figure 37: Europe Electroporation Instruments Industry Revenue Share (%), by Method 2024 & 2032
- Figure 38: Europe Electroporation Instruments Industry Volume Share (%), by Method 2024 & 2032
- Figure 39: Europe Electroporation Instruments Industry Revenue (Million), by Application 2024 & 2032
- Figure 40: Europe Electroporation Instruments Industry Volume (K Unit), by Application 2024 & 2032
- Figure 41: Europe Electroporation Instruments Industry Revenue Share (%), by Application 2024 & 2032
- Figure 42: Europe Electroporation Instruments Industry Volume Share (%), by Application 2024 & 2032
- Figure 43: Europe Electroporation Instruments Industry Revenue (Million), by Country 2024 & 2032
- Figure 44: Europe Electroporation Instruments Industry Volume (K Unit), by Country 2024 & 2032
- Figure 45: Europe Electroporation Instruments Industry Revenue Share (%), by Country 2024 & 2032
- Figure 46: Europe Electroporation Instruments Industry Volume Share (%), by Country 2024 & 2032
- Figure 47: Asia Pacific Electroporation Instruments Industry Revenue (Million), by Method 2024 & 2032
- Figure 48: Asia Pacific Electroporation Instruments Industry Volume (K Unit), by Method 2024 & 2032
- Figure 49: Asia Pacific Electroporation Instruments Industry Revenue Share (%), by Method 2024 & 2032
- Figure 50: Asia Pacific Electroporation Instruments Industry Volume Share (%), by Method 2024 & 2032
- Figure 51: Asia Pacific Electroporation Instruments Industry Revenue (Million), by Application 2024 & 2032
- Figure 52: Asia Pacific Electroporation Instruments Industry Volume (K Unit), by Application 2024 & 2032
- Figure 53: Asia Pacific Electroporation Instruments Industry Revenue Share (%), by Application 2024 & 2032
- Figure 54: Asia Pacific Electroporation Instruments Industry Volume Share (%), by Application 2024 & 2032
- Figure 55: Asia Pacific Electroporation Instruments Industry Revenue (Million), by Country 2024 & 2032
- Figure 56: Asia Pacific Electroporation Instruments Industry Volume (K Unit), by Country 2024 & 2032
- Figure 57: Asia Pacific Electroporation Instruments Industry Revenue Share (%), by Country 2024 & 2032
- Figure 58: Asia Pacific Electroporation Instruments Industry Volume Share (%), by Country 2024 & 2032
- Figure 59: Middle East and Africa Electroporation Instruments Industry Revenue (Million), by Method 2024 & 2032
- Figure 60: Middle East and Africa Electroporation Instruments Industry Volume (K Unit), by Method 2024 & 2032
- Figure 61: Middle East and Africa Electroporation Instruments Industry Revenue Share (%), by Method 2024 & 2032
- Figure 62: Middle East and Africa Electroporation Instruments Industry Volume Share (%), by Method 2024 & 2032
- Figure 63: Middle East and Africa Electroporation Instruments Industry Revenue (Million), by Application 2024 & 2032
- Figure 64: Middle East and Africa Electroporation Instruments Industry Volume (K Unit), by Application 2024 & 2032
- Figure 65: Middle East and Africa Electroporation Instruments Industry Revenue Share (%), by Application 2024 & 2032
- Figure 66: Middle East and Africa Electroporation Instruments Industry Volume Share (%), by Application 2024 & 2032
- Figure 67: Middle East and Africa Electroporation Instruments Industry Revenue (Million), by Country 2024 & 2032
- Figure 68: Middle East and Africa Electroporation Instruments Industry Volume (K Unit), by Country 2024 & 2032
- Figure 69: Middle East and Africa Electroporation Instruments Industry Revenue Share (%), by Country 2024 & 2032
- Figure 70: Middle East and Africa Electroporation Instruments Industry Volume Share (%), by Country 2024 & 2032
- Figure 71: South America Electroporation Instruments Industry Revenue (Million), by Method 2024 & 2032
- Figure 72: South America Electroporation Instruments Industry Volume (K Unit), by Method 2024 & 2032
- Figure 73: South America Electroporation Instruments Industry Revenue Share (%), by Method 2024 & 2032
- Figure 74: South America Electroporation Instruments Industry Volume Share (%), by Method 2024 & 2032
- Figure 75: South America Electroporation Instruments Industry Revenue (Million), by Application 2024 & 2032
- Figure 76: South America Electroporation Instruments Industry Volume (K Unit), by Application 2024 & 2032
- Figure 77: South America Electroporation Instruments Industry Revenue Share (%), by Application 2024 & 2032
- Figure 78: South America Electroporation Instruments Industry Volume Share (%), by Application 2024 & 2032
- Figure 79: South America Electroporation Instruments Industry Revenue (Million), by Country 2024 & 2032
- Figure 80: South America Electroporation Instruments Industry Volume (K Unit), by Country 2024 & 2032
- Figure 81: South America Electroporation Instruments Industry Revenue Share (%), by Country 2024 & 2032
- Figure 82: South America Electroporation Instruments Industry Volume Share (%), by Country 2024 & 2032
List of Tables
- Table 1: Global Electroporation Instruments Industry Revenue Million Forecast, by Region 2019 & 2032
- Table 2: Global Electroporation Instruments Industry Volume K Unit Forecast, by Region 2019 & 2032
- Table 3: Global Electroporation Instruments Industry Revenue Million Forecast, by Method 2019 & 2032
- Table 4: Global Electroporation Instruments Industry Volume K Unit Forecast, by Method 2019 & 2032
- Table 5: Global Electroporation Instruments Industry Revenue Million Forecast, by Application 2019 & 2032
- Table 6: Global Electroporation Instruments Industry Volume K Unit Forecast, by Application 2019 & 2032
- Table 7: Global Electroporation Instruments Industry Revenue Million Forecast, by Region 2019 & 2032
- Table 8: Global Electroporation Instruments Industry Volume K Unit Forecast, by Region 2019 & 2032
- Table 9: Global Electroporation Instruments Industry Revenue Million Forecast, by Country 2019 & 2032
- Table 10: Global Electroporation Instruments Industry Volume K Unit Forecast, by Country 2019 & 2032
- Table 11: Global Electroporation Instruments Industry Revenue Million Forecast, by Country 2019 & 2032
- Table 12: Global Electroporation Instruments Industry Volume K Unit Forecast, by Country 2019 & 2032
- Table 13: Global Electroporation Instruments Industry Revenue Million Forecast, by Country 2019 & 2032
- Table 14: Global Electroporation Instruments Industry Volume K Unit Forecast, by Country 2019 & 2032
- Table 15: Global Electroporation Instruments Industry Revenue Million Forecast, by Country 2019 & 2032
- Table 16: Global Electroporation Instruments Industry Volume K Unit Forecast, by Country 2019 & 2032
- Table 17: Global Electroporation Instruments Industry Revenue Million Forecast, by Country 2019 & 2032
- Table 18: Global Electroporation Instruments Industry Volume K Unit Forecast, by Country 2019 & 2032
- Table 19: Global Electroporation Instruments Industry Revenue Million Forecast, by Method 2019 & 2032
- Table 20: Global Electroporation Instruments Industry Volume K Unit Forecast, by Method 2019 & 2032
- Table 21: Global Electroporation Instruments Industry Revenue Million Forecast, by Application 2019 & 2032
- Table 22: Global Electroporation Instruments Industry Volume K Unit Forecast, by Application 2019 & 2032
- Table 23: Global Electroporation Instruments Industry Revenue Million Forecast, by Country 2019 & 2032
- Table 24: Global Electroporation Instruments Industry Volume K Unit Forecast, by Country 2019 & 2032
- Table 25: United States Electroporation Instruments Industry Revenue (Million) Forecast, by Application 2019 & 2032
- Table 26: United States Electroporation Instruments Industry Volume (K Unit) Forecast, by Application 2019 & 2032
- Table 27: Canada Electroporation Instruments Industry Revenue (Million) Forecast, by Application 2019 & 2032
- Table 28: Canada Electroporation Instruments Industry Volume (K Unit) Forecast, by Application 2019 & 2032
- Table 29: Mexico Electroporation Instruments Industry Revenue (Million) Forecast, by Application 2019 & 2032
- Table 30: Mexico Electroporation Instruments Industry Volume (K Unit) Forecast, by Application 2019 & 2032
- Table 31: Global Electroporation Instruments Industry Revenue Million Forecast, by Method 2019 & 2032
- Table 32: Global Electroporation Instruments Industry Volume K Unit Forecast, by Method 2019 & 2032
- Table 33: Global Electroporation Instruments Industry Revenue Million Forecast, by Application 2019 & 2032
- Table 34: Global Electroporation Instruments Industry Volume K Unit Forecast, by Application 2019 & 2032
- Table 35: Global Electroporation Instruments Industry Revenue Million Forecast, by Country 2019 & 2032
- Table 36: Global Electroporation Instruments Industry Volume K Unit Forecast, by Country 2019 & 2032
- Table 37: Germany Electroporation Instruments Industry Revenue (Million) Forecast, by Application 2019 & 2032
- Table 38: Germany Electroporation Instruments Industry Volume (K Unit) Forecast, by Application 2019 & 2032
- Table 39: United Kingdom Electroporation Instruments Industry Revenue (Million) Forecast, by Application 2019 & 2032
- Table 40: United Kingdom Electroporation Instruments Industry Volume (K Unit) Forecast, by Application 2019 & 2032
- Table 41: France Electroporation Instruments Industry Revenue (Million) Forecast, by Application 2019 & 2032
- Table 42: France Electroporation Instruments Industry Volume (K Unit) Forecast, by Application 2019 & 2032
- Table 43: Italy Electroporation Instruments Industry Revenue (Million) Forecast, by Application 2019 & 2032
- Table 44: Italy Electroporation Instruments Industry Volume (K Unit) Forecast, by Application 2019 & 2032
- Table 45: Spain Electroporation Instruments Industry Revenue (Million) Forecast, by Application 2019 & 2032
- Table 46: Spain Electroporation Instruments Industry Volume (K Unit) Forecast, by Application 2019 & 2032
- Table 47: Rest of Europe Electroporation Instruments Industry Revenue (Million) Forecast, by Application 2019 & 2032
- Table 48: Rest of Europe Electroporation Instruments Industry Volume (K Unit) Forecast, by Application 2019 & 2032
- Table 49: Global Electroporation Instruments Industry Revenue Million Forecast, by Method 2019 & 2032
- Table 50: Global Electroporation Instruments Industry Volume K Unit Forecast, by Method 2019 & 2032
- Table 51: Global Electroporation Instruments Industry Revenue Million Forecast, by Application 2019 & 2032
- Table 52: Global Electroporation Instruments Industry Volume K Unit Forecast, by Application 2019 & 2032
- Table 53: Global Electroporation Instruments Industry Revenue Million Forecast, by Country 2019 & 2032
- Table 54: Global Electroporation Instruments Industry Volume K Unit Forecast, by Country 2019 & 2032
- Table 55: China Electroporation Instruments Industry Revenue (Million) Forecast, by Application 2019 & 2032
- Table 56: China Electroporation Instruments Industry Volume (K Unit) Forecast, by Application 2019 & 2032
- Table 57: Japan Electroporation Instruments Industry Revenue (Million) Forecast, by Application 2019 & 2032
- Table 58: Japan Electroporation Instruments Industry Volume (K Unit) Forecast, by Application 2019 & 2032
- Table 59: India Electroporation Instruments Industry Revenue (Million) Forecast, by Application 2019 & 2032
- Table 60: India Electroporation Instruments Industry Volume (K Unit) Forecast, by Application 2019 & 2032
- Table 61: Australia Electroporation Instruments Industry Revenue (Million) Forecast, by Application 2019 & 2032
- Table 62: Australia Electroporation Instruments Industry Volume (K Unit) Forecast, by Application 2019 & 2032
- Table 63: South Korea Electroporation Instruments Industry Revenue (Million) Forecast, by Application 2019 & 2032
- Table 64: South Korea Electroporation Instruments Industry Volume (K Unit) Forecast, by Application 2019 & 2032
- Table 65: Rest of Asia Pacific Electroporation Instruments Industry Revenue (Million) Forecast, by Application 2019 & 2032
- Table 66: Rest of Asia Pacific Electroporation Instruments Industry Volume (K Unit) Forecast, by Application 2019 & 2032
- Table 67: Global Electroporation Instruments Industry Revenue Million Forecast, by Method 2019 & 2032
- Table 68: Global Electroporation Instruments Industry Volume K Unit Forecast, by Method 2019 & 2032
- Table 69: Global Electroporation Instruments Industry Revenue Million Forecast, by Application 2019 & 2032
- Table 70: Global Electroporation Instruments Industry Volume K Unit Forecast, by Application 2019 & 2032
- Table 71: Global Electroporation Instruments Industry Revenue Million Forecast, by Country 2019 & 2032
- Table 72: Global Electroporation Instruments Industry Volume K Unit Forecast, by Country 2019 & 2032
- Table 73: GCC Electroporation Instruments Industry Revenue (Million) Forecast, by Application 2019 & 2032
- Table 74: GCC Electroporation Instruments Industry Volume (K Unit) Forecast, by Application 2019 & 2032
- Table 75: South Africa Electroporation Instruments Industry Revenue (Million) Forecast, by Application 2019 & 2032
- Table 76: South Africa Electroporation Instruments Industry Volume (K Unit) Forecast, by Application 2019 & 2032
- Table 77: Rest of Middle East and Africa Electroporation Instruments Industry Revenue (Million) Forecast, by Application 2019 & 2032
- Table 78: Rest of Middle East and Africa Electroporation Instruments Industry Volume (K Unit) Forecast, by Application 2019 & 2032
- Table 79: Global Electroporation Instruments Industry Revenue Million Forecast, by Method 2019 & 2032
- Table 80: Global Electroporation Instruments Industry Volume K Unit Forecast, by Method 2019 & 2032
- Table 81: Global Electroporation Instruments Industry Revenue Million Forecast, by Application 2019 & 2032
- Table 82: Global Electroporation Instruments Industry Volume K Unit Forecast, by Application 2019 & 2032
- Table 83: Global Electroporation Instruments Industry Revenue Million Forecast, by Country 2019 & 2032
- Table 84: Global Electroporation Instruments Industry Volume K Unit Forecast, by Country 2019 & 2032
- Table 85: Brazil Electroporation Instruments Industry Revenue (Million) Forecast, by Application 2019 & 2032
- Table 86: Brazil Electroporation Instruments Industry Volume (K Unit) Forecast, by Application 2019 & 2032
- Table 87: Argentina Electroporation Instruments Industry Revenue (Million) Forecast, by Application 2019 & 2032
- Table 88: Argentina Electroporation Instruments Industry Volume (K Unit) Forecast, by Application 2019 & 2032
- Table 89: Rest of South America Electroporation Instruments Industry Revenue (Million) Forecast, by Application 2019 & 2032
- Table 90: Rest of South America Electroporation Instruments Industry Volume (K Unit) Forecast, by Application 2019 & 2032
Frequently Asked Questions
1. What is the projected Compound Annual Growth Rate (CAGR) of the Electroporation Instruments Industry?
The projected CAGR is approximately 9.10%.
2. Which companies are prominent players in the Electroporation Instruments Industry?
Key companies in the market include Mirus Bio, Promega Corporation, Bio-Rad Laboratories Inc, Merck KGaA, Lonza Group, Altogen Biosystems, Polyplus-transfection SA, SignaGen Laboratories, Qiagen NV, Thermo Fisher Scientific.
3. What are the main segments of the Electroporation Instruments Industry?
The market segments include Method, Application.
4. Can you provide details about the market size?
The market size is estimated to be USD XX Million as of 2022.
5. What are some drivers contributing to market growth?
Rising Incidences of Chronic Diseases; Increase in Research & Development in the Field of Cell Based Therapies.
6. What are the notable trends driving market growth?
Reagent-based Method is Showing Significant Growth in the Transfection Technologies Market.
7. Are there any restraints impacting market growth?
High Cost of Transfection Technology Instruments.
8. Can you provide examples of recent developments in the market?
September 2022: Polyplus, a leading upstream solutions provider for advanced biologic and cell and gene therapy production from research to commercial grade, continues to build out the mRNA support portfolio. The team has launched the in vivo-jetRNA+ transfection reagent for in vivo mRNA delivery using a preformed liposome.
9. What pricing options are available for accessing the report?
Pricing options include single-user, multi-user, and enterprise licenses priced at USD 4750, USD 5250, and USD 8750 respectively.
10. Is the market size provided in terms of value or volume?
The market size is provided in terms of value, measured in Million and volume, measured in K Unit.
11. Are there any specific market keywords associated with the report?
Yes, the market keyword associated with the report is "Electroporation Instruments Industry," which aids in identifying and referencing the specific market segment covered.
12. How do I determine which pricing option suits my needs best?
The pricing options vary based on user requirements and access needs. Individual users may opt for single-user licenses, while businesses requiring broader access may choose multi-user or enterprise licenses for cost-effective access to the report.
13. Are there any additional resources or data provided in the Electroporation Instruments Industry report?
While the report offers comprehensive insights, it's advisable to review the specific contents or supplementary materials provided to ascertain if additional resources or data are available.
14. How can I stay updated on further developments or reports in the Electroporation Instruments Industry?
To stay informed about further developments, trends, and reports in the Electroporation Instruments Industry, consider subscribing to industry newsletters, following relevant companies and organizations, or regularly checking reputable industry news sources and publications.
Methodology
Step 1 - Identification of Relevant Samples Size from Population Database


Step 2 - Approaches for Defining Global Market Size (Value, Volume* & Price*)

Note*: In applicable scenarios
Step 3 - Data Sources
Primary Research
- Web Analytics
- Survey Reports
- Research Institute
- Latest Research Reports
- Opinion Leaders
Secondary Research
- Annual Reports
- White Paper
- Latest Press Release
- Industry Association
- Paid Database
- Investor Presentations

Step 4 - Data Triangulation
Involves using different sources of information in order to increase the validity of a study
These sources are likely to be stakeholders in a program - participants, other researchers, program staff, other community members, and so on.
Then we put all data in single framework & apply various statistical tools to find out the dynamic on the market.
During the analysis stage, feedback from the stakeholder groups would be compared to determine areas of agreement as well as areas of divergence


