
Key Insights
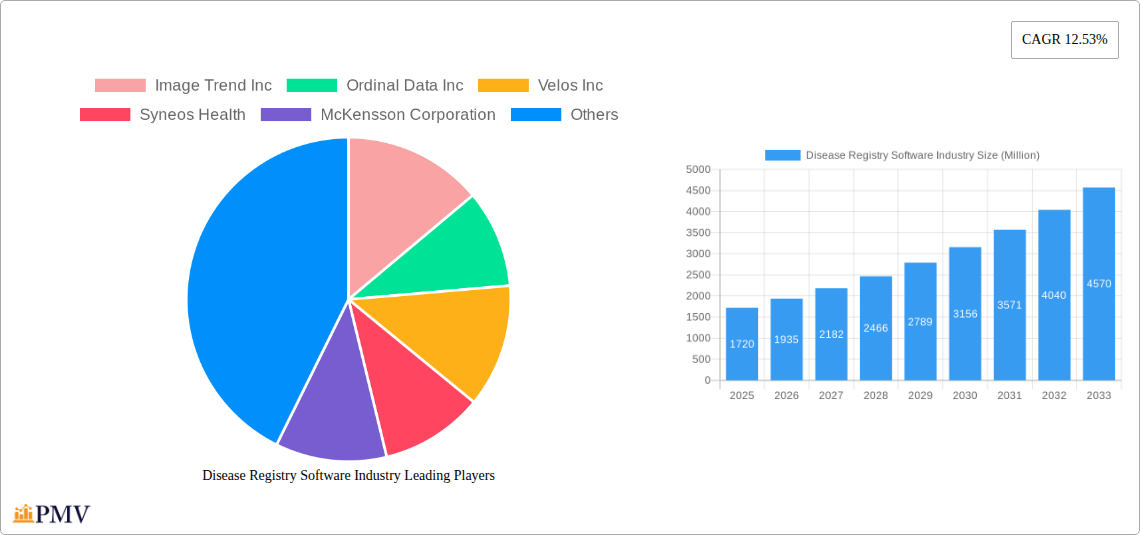
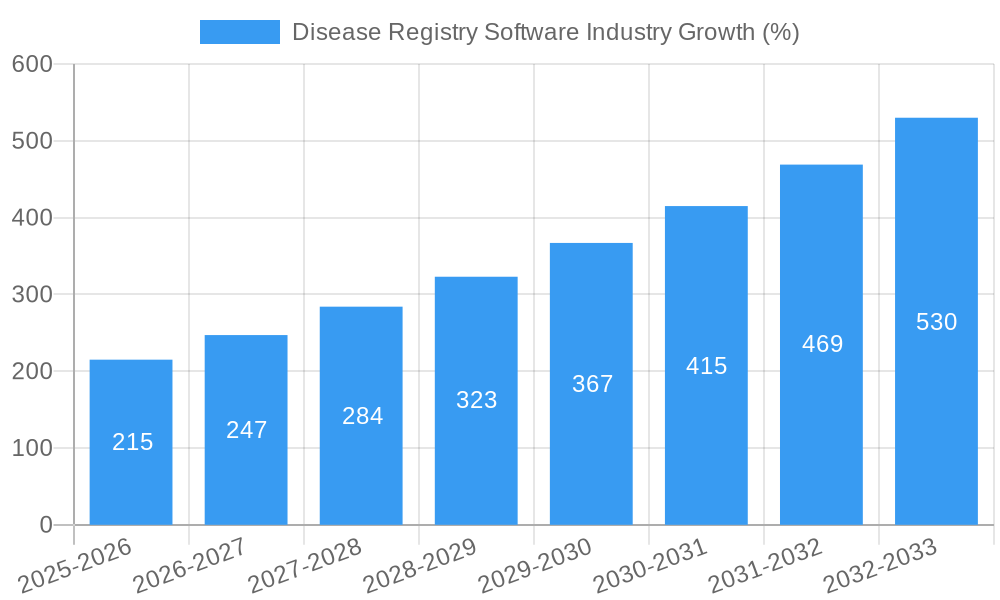
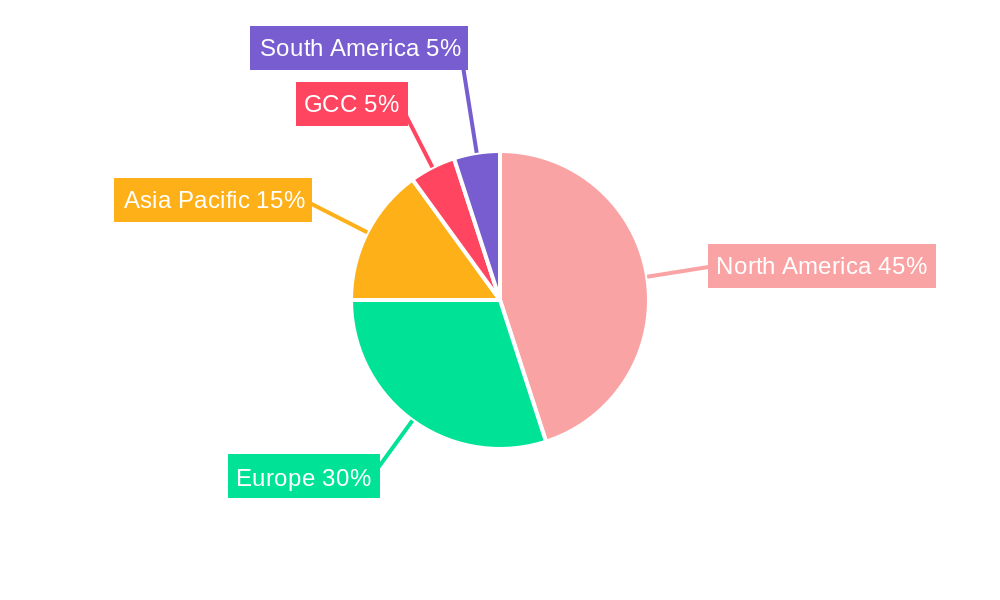
The global Disease Registry Software market, valued at $1.72 billion in 2025, is projected to experience robust growth, driven by a compound annual growth rate (CAGR) of 12.53% from 2025 to 2033. This expansion is fueled by several key factors. The increasing prevalence of chronic diseases globally necessitates efficient data management and analysis for effective public health interventions. Disease registries play a crucial role in epidemiological research, enabling scientists and healthcare professionals to track disease trends, identify risk factors, and evaluate the effectiveness of treatment strategies. Furthermore, the rising adoption of electronic health records (EHRs) and the increasing demand for integrated healthcare solutions are creating significant opportunities for disease registry software providers. Government initiatives promoting data-driven healthcare decision-making and the growing need for real-world evidence generation in pharmaceutical and biotechnology research further contribute to market growth. The market is segmented by registry type (disease, health service, product), software type (stand-alone, integrated), and end-user (hospitals, government, pharmaceutical companies, etc.), offering diverse opportunities for vendors. Competition is expected to intensify as established players and emerging tech companies strive to offer innovative solutions tailored to specific needs. The North American region currently holds a significant market share, driven by advanced healthcare infrastructure and high adoption rates of advanced technologies. However, Asia-Pacific is projected to witness substantial growth due to rising healthcare expenditure and increasing investments in digital health infrastructure.
Market restraints include the high cost of implementation and maintenance of disease registry software, concerns regarding data security and privacy, and the need for skilled personnel to manage and interpret the complex data generated. Nevertheless, the long-term benefits of improved healthcare outcomes, enhanced research capabilities, and optimized resource allocation are expected to outweigh these challenges. The market is likely to witness increasing integration with artificial intelligence (AI) and machine learning (ML) technologies, enabling advanced analytics and predictive modeling for better disease management. Stand-alone software solutions are currently prevalent, but integrated solutions are gaining traction due to their ability to seamlessly integrate with existing EHR systems and other healthcare IT infrastructure. The growth of cloud-based solutions further contributes to market expansion, providing scalable and cost-effective options for various stakeholders.
This comprehensive report provides a detailed analysis of the Disease Registry Software industry, offering invaluable insights for stakeholders seeking to understand market dynamics, competitive landscapes, and future growth opportunities. The report covers the period from 2019 to 2033, with 2025 as the base and estimated year, and a forecast period of 2025-2033. The global market size is estimated to reach xx Million by 2033, exhibiting a CAGR of xx% during the forecast period.
Disease Registry Software Industry Market Structure & Competitive Dynamics
This section analyzes the competitive intensity and structure of the Disease Registry Software market. We examine market concentration, analyzing market share held by key players such as Image Trend Inc, Ordinal Data Inc, Velos Inc, Syneos Health, McKesson Corporation, Cerner Corporation, IQVIA, Dacima Software Inc, Global Vision Technologies Inc, FIGmd Inc, IBM, and ArborMetrix. The report quantifies market share for each company and analyzes their competitive strategies. The current market appears moderately concentrated, with a few dominant players and several smaller niche players. Innovation ecosystems are analyzed, including the role of research institutions and startups in driving technological advancements. The regulatory landscape affecting the development and deployment of disease registry software, including HIPAA and GDPR compliance requirements, is scrutinized. The report also assesses the prevalence of product substitutes and evaluates their impact on market share. Finally, an analysis of M&A activity within the sector is provided, including the deal value and strategic implications of significant mergers and acquisitions during the historical period (2019-2024). The total M&A deal value during this period is estimated to be xx Million.
- Market Concentration: Moderately concentrated, with a few dominant players.
- Key Players' Market Share: (Specific percentages will be detailed in the full report)
- M&A Activity: xx Million in deal value during 2019-2024 (Specific deals and values will be detailed in the full report).
- Regulatory Frameworks: HIPAA, GDPR, and other relevant regulations impacting market dynamics.
- Product Substitutes: Analysis of alternative solutions and their market impact.
Disease Registry Software Industry Industry Trends & Insights
This section delves into the key trends shaping the Disease Registry Software market, providing a thorough understanding of market growth drivers, technological disruptions, evolving consumer preferences, and competitive dynamics. We analyze the factors contributing to the market's CAGR, including increasing demand for improved patient care, growing adoption of electronic health records (EHRs), rising prevalence of chronic diseases, and increasing government funding for healthcare initiatives. Technological disruptions, such as the advent of cloud-based solutions, AI-powered analytics, and the rise of big data, are thoroughly examined. The report further analyzes consumer preferences, emphasizing the demand for user-friendly, interoperable, and secure software solutions. The competitive dynamics are analyzed through a lens of innovation, pricing strategies, and market penetration by various industry players. Market penetration is estimated at xx% in 2025.
Dominant Markets & Segments in Disease Registry Software Industry
This section identifies the leading regions, countries, and market segments within the Disease Registry Software industry. A detailed dominance analysis is provided for each segment. This includes:
Type of Registry:
- Disease Registries: This segment dominates due to the increasing need for effective disease management and research. Key drivers include the high prevalence of chronic diseases and the rising demand for better treatment outcomes.
- Health Service Registries: This segment is experiencing steady growth driven by the need for better healthcare resource allocation and public health surveillance.
- Product Registries: This segment shows promising growth driven by the increasing number of medical products entering the market and the need for efficient product tracking and safety monitoring.
Type of Software:
- Stand-alone Software: This segment holds a significant market share due to its flexibility and ease of implementation.
- Integrated Software: The demand for integrated solutions is growing due to the need for seamless data exchange and interoperability with existing healthcare IT systems.
End User:
- Hospitals: Hospitals are the largest end-users, driving demand due to their need to manage patient data efficiently and improve the quality of care.
- Government Organizations and Third Party Administrators (TPAs): Government agencies and TPAs are key players driving the adoption of disease registry software for public health surveillance and efficient administration of healthcare programs.
- Pharmaceutical, Biotechnology, and Medical Device Companies: This segment utilizes the software for clinical research, drug development, and post-market surveillance.
- Other End Users: This segment includes research institutions, academic centers and others.
Geographic Dominance: (Specific regions and countries with detailed analysis will be presented in the full report). Key drivers for dominant markets will include factors like economic policies promoting healthcare IT adoption, robust healthcare infrastructure, and strong regulatory support.
Disease Registry Software Industry Product Innovations
The disease registry software market is witnessing rapid product innovations, driven by technological advancements in areas such as artificial intelligence (AI), machine learning (ML), and cloud computing. New products are characterized by improved user interfaces, enhanced data analytics capabilities, better interoperability with other healthcare IT systems, and stronger data security features. These innovations are enhancing the efficiency and effectiveness of disease surveillance, clinical research, and public health initiatives. The competitive advantage lies in offering advanced features like predictive modeling, real-time data visualization, and seamless integration with existing clinical workflows.
Report Segmentation & Scope
This report segments the Disease Registry Software market based on type of registry (Disease Registries, Health Service Registries, Product Registries), type of software (Stand-alone Software, Integrated Software), and end-user (Hospitals, Government Organizations and TPAs, Pharmaceutical, Biotechnology, and Medical Device Companies, Other End Users). Each segment's growth projections, market size, and competitive dynamics are analyzed separately.
Key Drivers of Disease Registry Software Industry Growth
Several factors drive the growth of the Disease Registry Software market. These include the rising prevalence of chronic diseases necessitating efficient patient management, increasing government initiatives promoting healthcare IT adoption and data-driven healthcare decision-making, advancements in technology such as AI and cloud computing enabling better data analytics and interoperability, and the increasing demand for evidence-based medicine promoting the use of robust data registries. Further driving growth is the improved data security and privacy measures.
Challenges in the Disease Registry Software Industry Sector
The industry faces several challenges, including the high cost of implementation and maintenance of disease registry software, the need for skilled IT professionals, and the complexity of data integration with existing healthcare systems. Regulatory hurdles and data privacy concerns can also pose significant obstacles to market growth. The evolving landscape of cyber security threats also adds to these challenges.
Leading Players in the Disease Registry Software Industry Market
- Image Trend Inc
- Ordinal Data Inc
- Velos Inc
- Syneos Health
- McKesson Corporation
- Cerner Corporation
- IQVIA
- Dacima Software Inc
- Global Vision Technologies Inc
- FIGmd Inc
- IBM
- ArborMetrix
Key Developments in Disease Registry Software Industry Sector
- April 2022: Quantori, LLC launched a Registry Science Practice focusing on the creation of registry programs for patients, clinicians, and researchers. This signifies a growing emphasis on specialized services within the industry.
- January 2022: Seqster partnered with the National Pancreas Foundation (NPF) to create the nation's largest dynamic pancreatic patient disease database. This collaboration highlights the potential for large-scale data aggregation and its impact on research.
Strategic Disease Registry Software Industry Market Outlook
The Disease Registry Software market is poised for significant growth over the forecast period. Opportunities exist in developing innovative solutions that leverage AI and machine learning for predictive analytics and personalized medicine. Strategic partnerships and collaborations among software providers, healthcare institutions, and research organizations will further accelerate market expansion. Focus on improving data security and interoperability will be crucial for sustained growth. The integration of blockchain technology for enhanced data security and transparency presents significant future opportunities.
Disease Registry Software Industry Segmentation
-
1. Type of Registry
- 1.1. Disease Registries
- 1.2. Health Service Registries
- 1.3. Product Registries
-
2. Type of Software
- 2.1. Stand-alone Software
- 2.2. Integrated Software
-
3. End User
- 3.1. Hospitals
- 3.2. Governme
- 3.3. Pharmace
- 3.4. Other End Users
Disease Registry Software Industry Segmentation By Geography
-
1. North America
- 1.1. United States
- 1.2. Canada
- 1.3. Mexico
-
2. Europe
- 2.1. Germany
- 2.2. United Kingdom
- 2.3. France
- 2.4. Italy
- 2.5. Spain
- 2.6. Rest of Europe
-
3. Asia Pacific
- 3.1. China
- 3.2. Japan
- 3.3. India
- 3.4. Australia
- 3.5. South korea
- 3.6. Rest of Asia Pacific
- 4. Middle East
-
5. GCC
- 5.1. South Africa
- 5.2. Rest of Middle East
-
6. South America
- 6.1. Brazil
- 6.2. Argentina
- 6.3. Rest of South America
Disease Registry Software Industry REPORT HIGHLIGHTS
| Aspects | Details |
|---|---|
| Study Period | 2019-2033 |
| Base Year | 2024 |
| Estimated Year | 2025 |
| Forecast Period | 2025-2033 |
| Historical Period | 2019-2024 |
| Growth Rate | CAGR of 12.53% from 2019-2033 |
| Segmentation |
|
Table of Contents
- 1. Introduction
- 1.1. Research Scope
- 1.2. Market Segmentation
- 1.3. Research Methodology
- 1.4. Definitions and Assumptions
- 2. Executive Summary
- 2.1. Introduction
- 3. Market Dynamics
- 3.1. Introduction
- 3.2. Market Drivers
- 3.2.1. Implementation of Government Initiatives to Build Patient Registries; Rising Adoption of Electronic Health Records (EHR); Increasing Use of Patient Registry Data for Post-marketing Surveillance
- 3.3. Market Restrains
- 3.3.1. Privacy and Data Security-related Concerns; Lack of Trained and Skilled Resources
- 3.4. Market Trends
- 3.4.1. Integrated Software Segment is is Expected to Hold a Major Market Share in the Patient Registry Software Market
- 4. Market Factor Analysis
- 4.1. Porters Five Forces
- 4.2. Supply/Value Chain
- 4.3. PESTEL analysis
- 4.4. Market Entropy
- 4.5. Patent/Trademark Analysis
- 5. Global Disease Registry Software Industry Analysis, Insights and Forecast, 2019-2031
- 5.1. Market Analysis, Insights and Forecast - by Type of Registry
- 5.1.1. Disease Registries
- 5.1.2. Health Service Registries
- 5.1.3. Product Registries
- 5.2. Market Analysis, Insights and Forecast - by Type of Software
- 5.2.1. Stand-alone Software
- 5.2.2. Integrated Software
- 5.3. Market Analysis, Insights and Forecast - by End User
- 5.3.1. Hospitals
- 5.3.2. Governme
- 5.3.3. Pharmace
- 5.3.4. Other End Users
- 5.4. Market Analysis, Insights and Forecast - by Region
- 5.4.1. North America
- 5.4.2. Europe
- 5.4.3. Asia Pacific
- 5.4.4. Middle East
- 5.4.5. GCC
- 5.4.6. South America
- 5.1. Market Analysis, Insights and Forecast - by Type of Registry
- 6. North America Disease Registry Software Industry Analysis, Insights and Forecast, 2019-2031
- 6.1. Market Analysis, Insights and Forecast - by Type of Registry
- 6.1.1. Disease Registries
- 6.1.2. Health Service Registries
- 6.1.3. Product Registries
- 6.2. Market Analysis, Insights and Forecast - by Type of Software
- 6.2.1. Stand-alone Software
- 6.2.2. Integrated Software
- 6.3. Market Analysis, Insights and Forecast - by End User
- 6.3.1. Hospitals
- 6.3.2. Governme
- 6.3.3. Pharmace
- 6.3.4. Other End Users
- 6.1. Market Analysis, Insights and Forecast - by Type of Registry
- 7. Europe Disease Registry Software Industry Analysis, Insights and Forecast, 2019-2031
- 7.1. Market Analysis, Insights and Forecast - by Type of Registry
- 7.1.1. Disease Registries
- 7.1.2. Health Service Registries
- 7.1.3. Product Registries
- 7.2. Market Analysis, Insights and Forecast - by Type of Software
- 7.2.1. Stand-alone Software
- 7.2.2. Integrated Software
- 7.3. Market Analysis, Insights and Forecast - by End User
- 7.3.1. Hospitals
- 7.3.2. Governme
- 7.3.3. Pharmace
- 7.3.4. Other End Users
- 7.1. Market Analysis, Insights and Forecast - by Type of Registry
- 8. Asia Pacific Disease Registry Software Industry Analysis, Insights and Forecast, 2019-2031
- 8.1. Market Analysis, Insights and Forecast - by Type of Registry
- 8.1.1. Disease Registries
- 8.1.2. Health Service Registries
- 8.1.3. Product Registries
- 8.2. Market Analysis, Insights and Forecast - by Type of Software
- 8.2.1. Stand-alone Software
- 8.2.2. Integrated Software
- 8.3. Market Analysis, Insights and Forecast - by End User
- 8.3.1. Hospitals
- 8.3.2. Governme
- 8.3.3. Pharmace
- 8.3.4. Other End Users
- 8.1. Market Analysis, Insights and Forecast - by Type of Registry
- 9. Middle East Disease Registry Software Industry Analysis, Insights and Forecast, 2019-2031
- 9.1. Market Analysis, Insights and Forecast - by Type of Registry
- 9.1.1. Disease Registries
- 9.1.2. Health Service Registries
- 9.1.3. Product Registries
- 9.2. Market Analysis, Insights and Forecast - by Type of Software
- 9.2.1. Stand-alone Software
- 9.2.2. Integrated Software
- 9.3. Market Analysis, Insights and Forecast - by End User
- 9.3.1. Hospitals
- 9.3.2. Governme
- 9.3.3. Pharmace
- 9.3.4. Other End Users
- 9.1. Market Analysis, Insights and Forecast - by Type of Registry
- 10. GCC Disease Registry Software Industry Analysis, Insights and Forecast, 2019-2031
- 10.1. Market Analysis, Insights and Forecast - by Type of Registry
- 10.1.1. Disease Registries
- 10.1.2. Health Service Registries
- 10.1.3. Product Registries
- 10.2. Market Analysis, Insights and Forecast - by Type of Software
- 10.2.1. Stand-alone Software
- 10.2.2. Integrated Software
- 10.3. Market Analysis, Insights and Forecast - by End User
- 10.3.1. Hospitals
- 10.3.2. Governme
- 10.3.3. Pharmace
- 10.3.4. Other End Users
- 10.1. Market Analysis, Insights and Forecast - by Type of Registry
- 11. South America Disease Registry Software Industry Analysis, Insights and Forecast, 2019-2031
- 11.1. Market Analysis, Insights and Forecast - by Type of Registry
- 11.1.1. Disease Registries
- 11.1.2. Health Service Registries
- 11.1.3. Product Registries
- 11.2. Market Analysis, Insights and Forecast - by Type of Software
- 11.2.1. Stand-alone Software
- 11.2.2. Integrated Software
- 11.3. Market Analysis, Insights and Forecast - by End User
- 11.3.1. Hospitals
- 11.3.2. Governme
- 11.3.3. Pharmace
- 11.3.4. Other End Users
- 11.1. Market Analysis, Insights and Forecast - by Type of Registry
- 12. North America Disease Registry Software Industry Analysis, Insights and Forecast, 2019-2031
- 12.1. Market Analysis, Insights and Forecast - By Country/Sub-region
- 12.1.1 United States
- 12.1.2 Canada
- 12.1.3 Mexico
- 13. Europe Disease Registry Software Industry Analysis, Insights and Forecast, 2019-2031
- 13.1. Market Analysis, Insights and Forecast - By Country/Sub-region
- 13.1.1 Germany
- 13.1.2 United Kingdom
- 13.1.3 France
- 13.1.4 Italy
- 13.1.5 Spain
- 13.1.6 Rest of Europe
- 14. Asia Pacific Disease Registry Software Industry Analysis, Insights and Forecast, 2019-2031
- 14.1. Market Analysis, Insights and Forecast - By Country/Sub-region
- 14.1.1 China
- 14.1.2 Japan
- 14.1.3 India
- 14.1.4 Australia
- 14.1.5 South korea
- 14.1.6 Rest of Asia Pacific
- 15. GCC Disease Registry Software Industry Analysis, Insights and Forecast, 2019-2031
- 15.1. Market Analysis, Insights and Forecast - By Country/Sub-region
- 15.1.1 South Africa
- 15.1.2 Rest of Middle East
- 16. South America Disease Registry Software Industry Analysis, Insights and Forecast, 2019-2031
- 16.1. Market Analysis, Insights and Forecast - By Country/Sub-region
- 16.1.1 Brazil
- 16.1.2 Argentina
- 16.1.3 Rest of South America
- 17. Competitive Analysis
- 17.1. Global Market Share Analysis 2024
- 17.2. Company Profiles
- 17.2.1 Image Trend Inc
- 17.2.1.1. Overview
- 17.2.1.2. Products
- 17.2.1.3. SWOT Analysis
- 17.2.1.4. Recent Developments
- 17.2.1.5. Financials (Based on Availability)
- 17.2.2 Ordinal Data Inc
- 17.2.2.1. Overview
- 17.2.2.2. Products
- 17.2.2.3. SWOT Analysis
- 17.2.2.4. Recent Developments
- 17.2.2.5. Financials (Based on Availability)
- 17.2.3 Velos Inc
- 17.2.3.1. Overview
- 17.2.3.2. Products
- 17.2.3.3. SWOT Analysis
- 17.2.3.4. Recent Developments
- 17.2.3.5. Financials (Based on Availability)
- 17.2.4 Syneos Health
- 17.2.4.1. Overview
- 17.2.4.2. Products
- 17.2.4.3. SWOT Analysis
- 17.2.4.4. Recent Developments
- 17.2.4.5. Financials (Based on Availability)
- 17.2.5 McKensson Corporation
- 17.2.5.1. Overview
- 17.2.5.2. Products
- 17.2.5.3. SWOT Analysis
- 17.2.5.4. Recent Developments
- 17.2.5.5. Financials (Based on Availability)
- 17.2.6 Cerner Corporation
- 17.2.6.1. Overview
- 17.2.6.2. Products
- 17.2.6.3. SWOT Analysis
- 17.2.6.4. Recent Developments
- 17.2.6.5. Financials (Based on Availability)
- 17.2.7 IQVIA
- 17.2.7.1. Overview
- 17.2.7.2. Products
- 17.2.7.3. SWOT Analysis
- 17.2.7.4. Recent Developments
- 17.2.7.5. Financials (Based on Availability)
- 17.2.8 Dacima Software Inc
- 17.2.8.1. Overview
- 17.2.8.2. Products
- 17.2.8.3. SWOT Analysis
- 17.2.8.4. Recent Developments
- 17.2.8.5. Financials (Based on Availability)
- 17.2.9 Global Vision Technologies Inc
- 17.2.9.1. Overview
- 17.2.9.2. Products
- 17.2.9.3. SWOT Analysis
- 17.2.9.4. Recent Developments
- 17.2.9.5. Financials (Based on Availability)
- 17.2.10 FIGmd Inc
- 17.2.10.1. Overview
- 17.2.10.2. Products
- 17.2.10.3. SWOT Analysis
- 17.2.10.4. Recent Developments
- 17.2.10.5. Financials (Based on Availability)
- 17.2.11 IBM
- 17.2.11.1. Overview
- 17.2.11.2. Products
- 17.2.11.3. SWOT Analysis
- 17.2.11.4. Recent Developments
- 17.2.11.5. Financials (Based on Availability)
- 17.2.12 ArborMetrix
- 17.2.12.1. Overview
- 17.2.12.2. Products
- 17.2.12.3. SWOT Analysis
- 17.2.12.4. Recent Developments
- 17.2.12.5. Financials (Based on Availability)
- 17.2.1 Image Trend Inc
List of Figures
- Figure 1: Global Disease Registry Software Industry Revenue Breakdown (Million, %) by Region 2024 & 2032
- Figure 2: North America Disease Registry Software Industry Revenue (Million), by Country 2024 & 2032
- Figure 3: North America Disease Registry Software Industry Revenue Share (%), by Country 2024 & 2032
- Figure 4: Europe Disease Registry Software Industry Revenue (Million), by Country 2024 & 2032
- Figure 5: Europe Disease Registry Software Industry Revenue Share (%), by Country 2024 & 2032
- Figure 6: Asia Pacific Disease Registry Software Industry Revenue (Million), by Country 2024 & 2032
- Figure 7: Asia Pacific Disease Registry Software Industry Revenue Share (%), by Country 2024 & 2032
- Figure 8: GCC Disease Registry Software Industry Revenue (Million), by Country 2024 & 2032
- Figure 9: GCC Disease Registry Software Industry Revenue Share (%), by Country 2024 & 2032
- Figure 10: South America Disease Registry Software Industry Revenue (Million), by Country 2024 & 2032
- Figure 11: South America Disease Registry Software Industry Revenue Share (%), by Country 2024 & 2032
- Figure 12: North America Disease Registry Software Industry Revenue (Million), by Type of Registry 2024 & 2032
- Figure 13: North America Disease Registry Software Industry Revenue Share (%), by Type of Registry 2024 & 2032
- Figure 14: North America Disease Registry Software Industry Revenue (Million), by Type of Software 2024 & 2032
- Figure 15: North America Disease Registry Software Industry Revenue Share (%), by Type of Software 2024 & 2032
- Figure 16: North America Disease Registry Software Industry Revenue (Million), by End User 2024 & 2032
- Figure 17: North America Disease Registry Software Industry Revenue Share (%), by End User 2024 & 2032
- Figure 18: North America Disease Registry Software Industry Revenue (Million), by Country 2024 & 2032
- Figure 19: North America Disease Registry Software Industry Revenue Share (%), by Country 2024 & 2032
- Figure 20: Europe Disease Registry Software Industry Revenue (Million), by Type of Registry 2024 & 2032
- Figure 21: Europe Disease Registry Software Industry Revenue Share (%), by Type of Registry 2024 & 2032
- Figure 22: Europe Disease Registry Software Industry Revenue (Million), by Type of Software 2024 & 2032
- Figure 23: Europe Disease Registry Software Industry Revenue Share (%), by Type of Software 2024 & 2032
- Figure 24: Europe Disease Registry Software Industry Revenue (Million), by End User 2024 & 2032
- Figure 25: Europe Disease Registry Software Industry Revenue Share (%), by End User 2024 & 2032
- Figure 26: Europe Disease Registry Software Industry Revenue (Million), by Country 2024 & 2032
- Figure 27: Europe Disease Registry Software Industry Revenue Share (%), by Country 2024 & 2032
- Figure 28: Asia Pacific Disease Registry Software Industry Revenue (Million), by Type of Registry 2024 & 2032
- Figure 29: Asia Pacific Disease Registry Software Industry Revenue Share (%), by Type of Registry 2024 & 2032
- Figure 30: Asia Pacific Disease Registry Software Industry Revenue (Million), by Type of Software 2024 & 2032
- Figure 31: Asia Pacific Disease Registry Software Industry Revenue Share (%), by Type of Software 2024 & 2032
- Figure 32: Asia Pacific Disease Registry Software Industry Revenue (Million), by End User 2024 & 2032
- Figure 33: Asia Pacific Disease Registry Software Industry Revenue Share (%), by End User 2024 & 2032
- Figure 34: Asia Pacific Disease Registry Software Industry Revenue (Million), by Country 2024 & 2032
- Figure 35: Asia Pacific Disease Registry Software Industry Revenue Share (%), by Country 2024 & 2032
- Figure 36: Middle East Disease Registry Software Industry Revenue (Million), by Type of Registry 2024 & 2032
- Figure 37: Middle East Disease Registry Software Industry Revenue Share (%), by Type of Registry 2024 & 2032
- Figure 38: Middle East Disease Registry Software Industry Revenue (Million), by Type of Software 2024 & 2032
- Figure 39: Middle East Disease Registry Software Industry Revenue Share (%), by Type of Software 2024 & 2032
- Figure 40: Middle East Disease Registry Software Industry Revenue (Million), by End User 2024 & 2032
- Figure 41: Middle East Disease Registry Software Industry Revenue Share (%), by End User 2024 & 2032
- Figure 42: Middle East Disease Registry Software Industry Revenue (Million), by Country 2024 & 2032
- Figure 43: Middle East Disease Registry Software Industry Revenue Share (%), by Country 2024 & 2032
- Figure 44: GCC Disease Registry Software Industry Revenue (Million), by Type of Registry 2024 & 2032
- Figure 45: GCC Disease Registry Software Industry Revenue Share (%), by Type of Registry 2024 & 2032
- Figure 46: GCC Disease Registry Software Industry Revenue (Million), by Type of Software 2024 & 2032
- Figure 47: GCC Disease Registry Software Industry Revenue Share (%), by Type of Software 2024 & 2032
- Figure 48: GCC Disease Registry Software Industry Revenue (Million), by End User 2024 & 2032
- Figure 49: GCC Disease Registry Software Industry Revenue Share (%), by End User 2024 & 2032
- Figure 50: GCC Disease Registry Software Industry Revenue (Million), by Country 2024 & 2032
- Figure 51: GCC Disease Registry Software Industry Revenue Share (%), by Country 2024 & 2032
- Figure 52: South America Disease Registry Software Industry Revenue (Million), by Type of Registry 2024 & 2032
- Figure 53: South America Disease Registry Software Industry Revenue Share (%), by Type of Registry 2024 & 2032
- Figure 54: South America Disease Registry Software Industry Revenue (Million), by Type of Software 2024 & 2032
- Figure 55: South America Disease Registry Software Industry Revenue Share (%), by Type of Software 2024 & 2032
- Figure 56: South America Disease Registry Software Industry Revenue (Million), by End User 2024 & 2032
- Figure 57: South America Disease Registry Software Industry Revenue Share (%), by End User 2024 & 2032
- Figure 58: South America Disease Registry Software Industry Revenue (Million), by Country 2024 & 2032
- Figure 59: South America Disease Registry Software Industry Revenue Share (%), by Country 2024 & 2032
List of Tables
- Table 1: Global Disease Registry Software Industry Revenue Million Forecast, by Region 2019 & 2032
- Table 2: Global Disease Registry Software Industry Revenue Million Forecast, by Type of Registry 2019 & 2032
- Table 3: Global Disease Registry Software Industry Revenue Million Forecast, by Type of Software 2019 & 2032
- Table 4: Global Disease Registry Software Industry Revenue Million Forecast, by End User 2019 & 2032
- Table 5: Global Disease Registry Software Industry Revenue Million Forecast, by Region 2019 & 2032
- Table 6: Global Disease Registry Software Industry Revenue Million Forecast, by Country 2019 & 2032
- Table 7: United States Disease Registry Software Industry Revenue (Million) Forecast, by Application 2019 & 2032
- Table 8: Canada Disease Registry Software Industry Revenue (Million) Forecast, by Application 2019 & 2032
- Table 9: Mexico Disease Registry Software Industry Revenue (Million) Forecast, by Application 2019 & 2032
- Table 10: Global Disease Registry Software Industry Revenue Million Forecast, by Country 2019 & 2032
- Table 11: Germany Disease Registry Software Industry Revenue (Million) Forecast, by Application 2019 & 2032
- Table 12: United Kingdom Disease Registry Software Industry Revenue (Million) Forecast, by Application 2019 & 2032
- Table 13: France Disease Registry Software Industry Revenue (Million) Forecast, by Application 2019 & 2032
- Table 14: Italy Disease Registry Software Industry Revenue (Million) Forecast, by Application 2019 & 2032
- Table 15: Spain Disease Registry Software Industry Revenue (Million) Forecast, by Application 2019 & 2032
- Table 16: Rest of Europe Disease Registry Software Industry Revenue (Million) Forecast, by Application 2019 & 2032
- Table 17: Global Disease Registry Software Industry Revenue Million Forecast, by Country 2019 & 2032
- Table 18: China Disease Registry Software Industry Revenue (Million) Forecast, by Application 2019 & 2032
- Table 19: Japan Disease Registry Software Industry Revenue (Million) Forecast, by Application 2019 & 2032
- Table 20: India Disease Registry Software Industry Revenue (Million) Forecast, by Application 2019 & 2032
- Table 21: Australia Disease Registry Software Industry Revenue (Million) Forecast, by Application 2019 & 2032
- Table 22: South korea Disease Registry Software Industry Revenue (Million) Forecast, by Application 2019 & 2032
- Table 23: Rest of Asia Pacific Disease Registry Software Industry Revenue (Million) Forecast, by Application 2019 & 2032
- Table 24: Global Disease Registry Software Industry Revenue Million Forecast, by Country 2019 & 2032
- Table 25: South Africa Disease Registry Software Industry Revenue (Million) Forecast, by Application 2019 & 2032
- Table 26: Rest of Middle East Disease Registry Software Industry Revenue (Million) Forecast, by Application 2019 & 2032
- Table 27: Global Disease Registry Software Industry Revenue Million Forecast, by Country 2019 & 2032
- Table 28: Brazil Disease Registry Software Industry Revenue (Million) Forecast, by Application 2019 & 2032
- Table 29: Argentina Disease Registry Software Industry Revenue (Million) Forecast, by Application 2019 & 2032
- Table 30: Rest of South America Disease Registry Software Industry Revenue (Million) Forecast, by Application 2019 & 2032
- Table 31: Global Disease Registry Software Industry Revenue Million Forecast, by Type of Registry 2019 & 2032
- Table 32: Global Disease Registry Software Industry Revenue Million Forecast, by Type of Software 2019 & 2032
- Table 33: Global Disease Registry Software Industry Revenue Million Forecast, by End User 2019 & 2032
- Table 34: Global Disease Registry Software Industry Revenue Million Forecast, by Country 2019 & 2032
- Table 35: United States Disease Registry Software Industry Revenue (Million) Forecast, by Application 2019 & 2032
- Table 36: Canada Disease Registry Software Industry Revenue (Million) Forecast, by Application 2019 & 2032
- Table 37: Mexico Disease Registry Software Industry Revenue (Million) Forecast, by Application 2019 & 2032
- Table 38: Global Disease Registry Software Industry Revenue Million Forecast, by Type of Registry 2019 & 2032
- Table 39: Global Disease Registry Software Industry Revenue Million Forecast, by Type of Software 2019 & 2032
- Table 40: Global Disease Registry Software Industry Revenue Million Forecast, by End User 2019 & 2032
- Table 41: Global Disease Registry Software Industry Revenue Million Forecast, by Country 2019 & 2032
- Table 42: Germany Disease Registry Software Industry Revenue (Million) Forecast, by Application 2019 & 2032
- Table 43: United Kingdom Disease Registry Software Industry Revenue (Million) Forecast, by Application 2019 & 2032
- Table 44: France Disease Registry Software Industry Revenue (Million) Forecast, by Application 2019 & 2032
- Table 45: Italy Disease Registry Software Industry Revenue (Million) Forecast, by Application 2019 & 2032
- Table 46: Spain Disease Registry Software Industry Revenue (Million) Forecast, by Application 2019 & 2032
- Table 47: Rest of Europe Disease Registry Software Industry Revenue (Million) Forecast, by Application 2019 & 2032
- Table 48: Global Disease Registry Software Industry Revenue Million Forecast, by Type of Registry 2019 & 2032
- Table 49: Global Disease Registry Software Industry Revenue Million Forecast, by Type of Software 2019 & 2032
- Table 50: Global Disease Registry Software Industry Revenue Million Forecast, by End User 2019 & 2032
- Table 51: Global Disease Registry Software Industry Revenue Million Forecast, by Country 2019 & 2032
- Table 52: China Disease Registry Software Industry Revenue (Million) Forecast, by Application 2019 & 2032
- Table 53: Japan Disease Registry Software Industry Revenue (Million) Forecast, by Application 2019 & 2032
- Table 54: India Disease Registry Software Industry Revenue (Million) Forecast, by Application 2019 & 2032
- Table 55: Australia Disease Registry Software Industry Revenue (Million) Forecast, by Application 2019 & 2032
- Table 56: South korea Disease Registry Software Industry Revenue (Million) Forecast, by Application 2019 & 2032
- Table 57: Rest of Asia Pacific Disease Registry Software Industry Revenue (Million) Forecast, by Application 2019 & 2032
- Table 58: Global Disease Registry Software Industry Revenue Million Forecast, by Type of Registry 2019 & 2032
- Table 59: Global Disease Registry Software Industry Revenue Million Forecast, by Type of Software 2019 & 2032
- Table 60: Global Disease Registry Software Industry Revenue Million Forecast, by End User 2019 & 2032
- Table 61: Global Disease Registry Software Industry Revenue Million Forecast, by Country 2019 & 2032
- Table 62: Global Disease Registry Software Industry Revenue Million Forecast, by Type of Registry 2019 & 2032
- Table 63: Global Disease Registry Software Industry Revenue Million Forecast, by Type of Software 2019 & 2032
- Table 64: Global Disease Registry Software Industry Revenue Million Forecast, by End User 2019 & 2032
- Table 65: Global Disease Registry Software Industry Revenue Million Forecast, by Country 2019 & 2032
- Table 66: South Africa Disease Registry Software Industry Revenue (Million) Forecast, by Application 2019 & 2032
- Table 67: Rest of Middle East Disease Registry Software Industry Revenue (Million) Forecast, by Application 2019 & 2032
- Table 68: Global Disease Registry Software Industry Revenue Million Forecast, by Type of Registry 2019 & 2032
- Table 69: Global Disease Registry Software Industry Revenue Million Forecast, by Type of Software 2019 & 2032
- Table 70: Global Disease Registry Software Industry Revenue Million Forecast, by End User 2019 & 2032
- Table 71: Global Disease Registry Software Industry Revenue Million Forecast, by Country 2019 & 2032
- Table 72: Brazil Disease Registry Software Industry Revenue (Million) Forecast, by Application 2019 & 2032
- Table 73: Argentina Disease Registry Software Industry Revenue (Million) Forecast, by Application 2019 & 2032
- Table 74: Rest of South America Disease Registry Software Industry Revenue (Million) Forecast, by Application 2019 & 2032
Frequently Asked Questions
1. What is the projected Compound Annual Growth Rate (CAGR) of the Disease Registry Software Industry?
The projected CAGR is approximately 12.53%.
2. Which companies are prominent players in the Disease Registry Software Industry?
Key companies in the market include Image Trend Inc, Ordinal Data Inc, Velos Inc, Syneos Health, McKensson Corporation, Cerner Corporation, IQVIA, Dacima Software Inc, Global Vision Technologies Inc, FIGmd Inc, IBM, ArborMetrix.
3. What are the main segments of the Disease Registry Software Industry?
The market segments include Type of Registry, Type of Software, End User.
4. Can you provide details about the market size?
The market size is estimated to be USD 1.72 Million as of 2022.
5. What are some drivers contributing to market growth?
Implementation of Government Initiatives to Build Patient Registries; Rising Adoption of Electronic Health Records (EHR); Increasing Use of Patient Registry Data for Post-marketing Surveillance.
6. What are the notable trends driving market growth?
Integrated Software Segment is is Expected to Hold a Major Market Share in the Patient Registry Software Market.
7. Are there any restraints impacting market growth?
Privacy and Data Security-related Concerns; Lack of Trained and Skilled Resources.
8. Can you provide examples of recent developments in the market?
In April 2022, Quantori, LLC launched a Registry Science Practice focusing on the creation of registry programs for patients, clinicians, and researchers.
9. What pricing options are available for accessing the report?
Pricing options include single-user, multi-user, and enterprise licenses priced at USD 4750, USD 5250, and USD 8750 respectively.
10. Is the market size provided in terms of value or volume?
The market size is provided in terms of value, measured in Million.
11. Are there any specific market keywords associated with the report?
Yes, the market keyword associated with the report is "Disease Registry Software Industry," which aids in identifying and referencing the specific market segment covered.
12. How do I determine which pricing option suits my needs best?
The pricing options vary based on user requirements and access needs. Individual users may opt for single-user licenses, while businesses requiring broader access may choose multi-user or enterprise licenses for cost-effective access to the report.
13. Are there any additional resources or data provided in the Disease Registry Software Industry report?
While the report offers comprehensive insights, it's advisable to review the specific contents or supplementary materials provided to ascertain if additional resources or data are available.
14. How can I stay updated on further developments or reports in the Disease Registry Software Industry?
To stay informed about further developments, trends, and reports in the Disease Registry Software Industry, consider subscribing to industry newsletters, following relevant companies and organizations, or regularly checking reputable industry news sources and publications.
Methodology
Step 1 - Identification of Relevant Samples Size from Population Database


Step 2 - Approaches for Defining Global Market Size (Value, Volume* & Price*)

Note*: In applicable scenarios
Step 3 - Data Sources
Primary Research
- Web Analytics
- Survey Reports
- Research Institute
- Latest Research Reports
- Opinion Leaders
Secondary Research
- Annual Reports
- White Paper
- Latest Press Release
- Industry Association
- Paid Database
- Investor Presentations

Step 4 - Data Triangulation
Involves using different sources of information in order to increase the validity of a study
These sources are likely to be stakeholders in a program - participants, other researchers, program staff, other community members, and so on.
Then we put all data in single framework & apply various statistical tools to find out the dynamic on the market.
During the analysis stage, feedback from the stakeholder groups would be compared to determine areas of agreement as well as areas of divergence


