
Key Insights
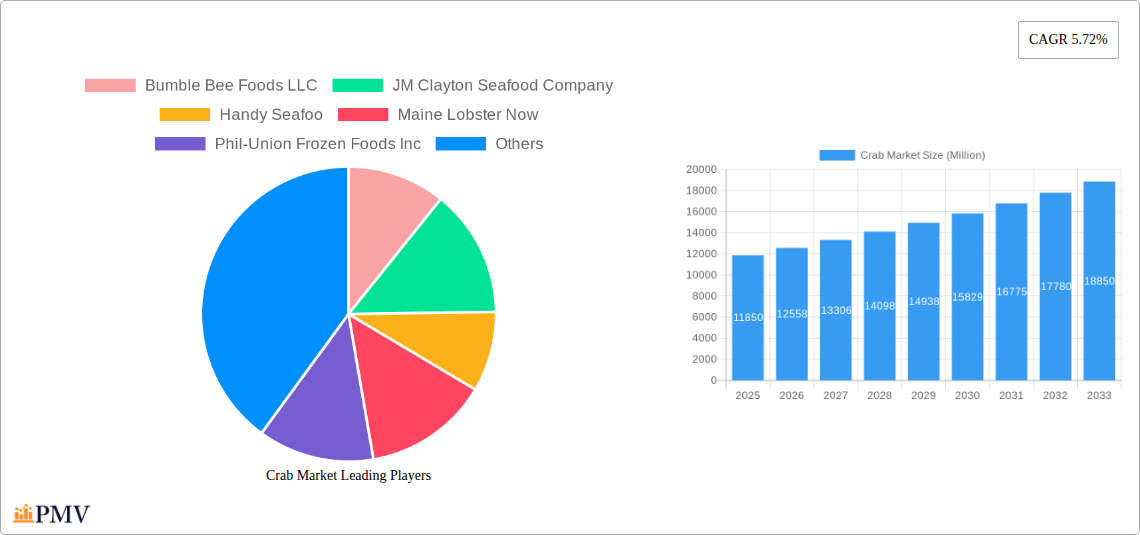
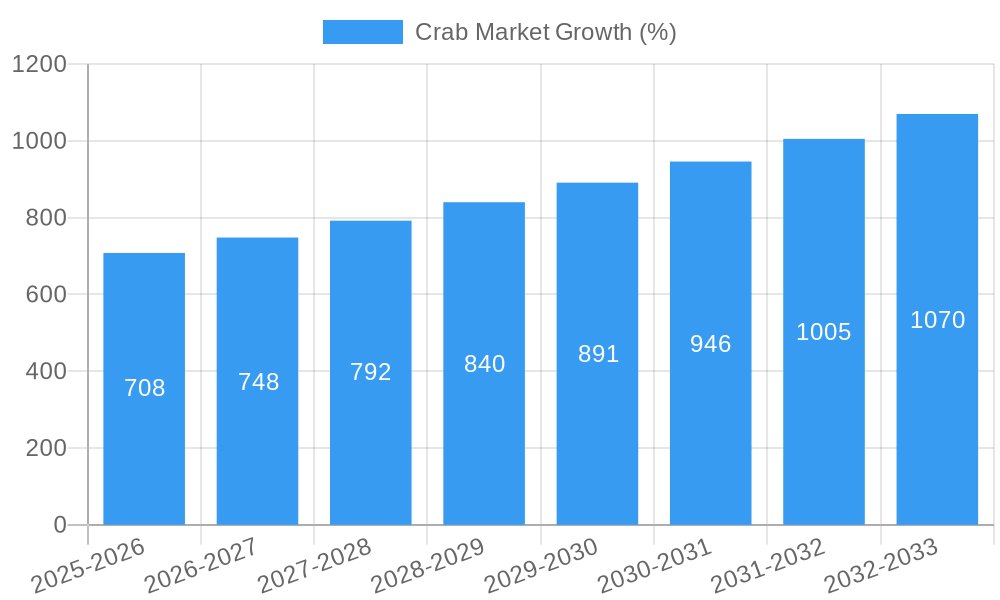
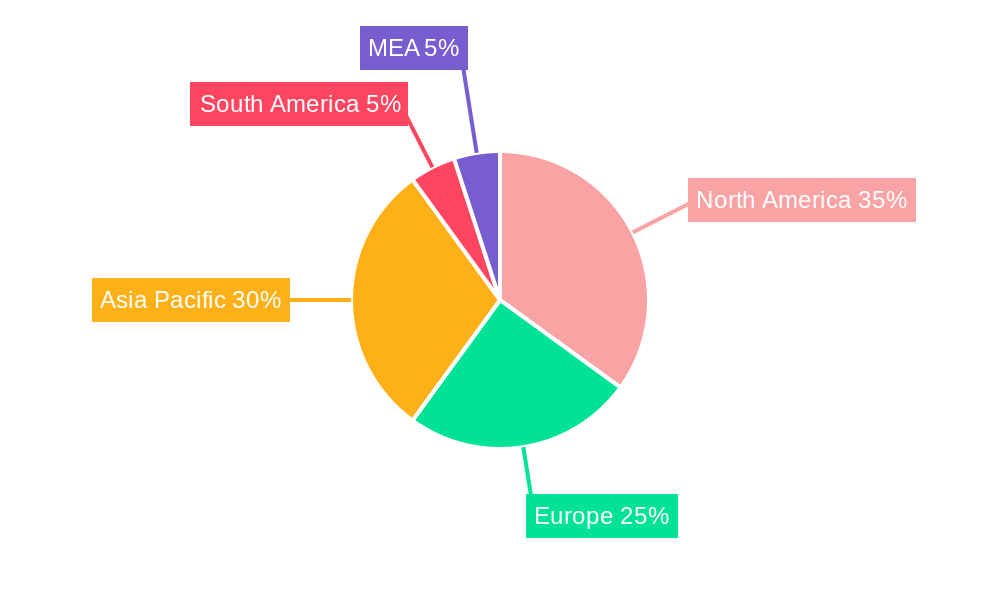
The global crab market, valued at $11.85 billion in 2025, is projected to experience robust growth, exhibiting a Compound Annual Growth Rate (CAGR) of 5.72% from 2025 to 2033. This expansion is driven by several key factors. Rising consumer demand for seafood, particularly crab, due to its nutritional value and culinary versatility, fuels market growth. The increasing popularity of crab in various cuisines globally, coupled with the rise of convenient ready-to-eat crab products like frozen and canned options, further contributes to market expansion. Growing urbanization and a rise in disposable incomes, particularly in developing economies, are also significantly impacting consumption patterns, leading to higher crab demand. Furthermore, the seafood industry's continuous innovation in processing and packaging techniques enhances product shelf life and availability, facilitating market penetration. However, challenges such as fluctuating crab populations due to overfishing and climate change, coupled with concerns about sustainability and traceability, pose potential restraints. These challenges underscore the need for responsible fishing practices and sustainable aquaculture initiatives to ensure long-term market health. Segmentation analysis reveals that frozen and canned crab forms dominate, while blue crab, Chinese mitten crab, and Gazami crab are the most popular types. North America and Asia Pacific are currently the leading regional markets, although growth potential exists in other regions with increasing seafood consumption.
The competitive landscape is characterized by a mix of established multinational corporations and regional players. Companies like Bumble Bee Foods LLC, JM Clayton Seafood Company, and others are actively involved in processing, distribution, and marketing of various crab products. Future growth will likely be influenced by effective marketing strategies highlighting sustainability and traceability, alongside continuous product innovation and expansion into emerging markets. A focus on meeting consumer demand for convenient, high-quality, and sustainably sourced crab products will be crucial for success in this dynamic market. Government regulations concerning sustainable fishing practices and the overall health of crab populations will also significantly impact market trajectory in the coming years. The forecast period suggests continued growth, driven by consistent consumer demand and effective industry responses to sustainability concerns.
Crab Market: A Comprehensive Analysis & Forecast (2019-2033)
This comprehensive report provides a detailed analysis of the global crab market, offering invaluable insights for industry stakeholders, investors, and strategic decision-makers. With a study period spanning 2019-2033, a base year of 2025, and a forecast period of 2025-2033, this report leverages extensive market research and data analysis to present a clear and actionable picture of this dynamic sector. The global crab market is projected to reach xx Million by 2033, exhibiting a CAGR of xx% during the forecast period.
Crab Market Market Structure & Competitive Dynamics
The global crab market exhibits a moderately concentrated structure, with key players holding significant market share. The market is characterized by intense competition, driven by both established players and emerging entrants. Innovation plays a crucial role, with companies investing heavily in sustainable sourcing, processing technologies, and product diversification. Regulatory frameworks, particularly those related to seafood safety and sustainability, significantly impact market dynamics. Product substitutes, such as other shellfish or protein sources, exert competitive pressure. End-user trends, particularly increasing demand for convenience and health-conscious seafood options, are shaping product development and marketing strategies. Mergers and acquisitions (M&A) activity has been significant, with deal values exceeding xx Million in recent years.
- Market Concentration: The top 5 players collectively hold approximately xx% of the global market share in 2025.
- Innovation Ecosystem: Significant investments in R&D are focused on improving processing efficiency, enhancing product quality, and developing sustainable fishing practices.
- Regulatory Landscape: Stringent regulations related to food safety and sustainable fishing practices are shaping market operations.
- M&A Activity: Between 2019 and 2024, a total of xx M&A deals were recorded, with an aggregate value of approximately xx Million. Notable examples include [mention specific examples, if available].
- Product Substitutes: Competition from other seafood and protein sources influences pricing and market penetration.
- End-User Trends: Growing demand for convenient, healthy, and sustainably sourced seafood is driving innovation and market growth.
Crab Market Industry Trends & Insights
The global crab market is experiencing robust growth, driven by a confluence of factors. Rising disposable incomes, particularly in developing economies, are fueling demand for premium seafood products. Growing awareness of the nutritional benefits of crab meat is also contributing to market expansion. Technological advancements in fishing and processing technologies are enhancing efficiency and product quality. However, challenges remain, including fluctuations in crab populations, environmental concerns, and supply chain disruptions. Consumer preferences are shifting towards sustainable and ethically sourced crab, placing pressure on companies to adopt responsible practices. The competitive landscape is intensifying, with both established and new players vying for market share. The market is projected to maintain a healthy growth trajectory, with a CAGR of xx% from 2025 to 2033. Market penetration of frozen crab products remains high, while canned crab products are witnessing steady growth due to their longer shelf life and convenience.
Dominant Markets & Segments in Crab Market
The Asia-Pacific region dominates the global crab market, driven by high consumption in countries like China, Japan, and South Korea. Within crab types, blue crab holds the largest market share, followed by Chinese mitten crab and Gazami crab. The frozen segment holds the largest market share due to its extended shelf life and convenience, followed by canned crab.
- Key Drivers for Asia-Pacific Dominance:
- High per capita consumption of seafood.
- Strong cultural preference for crab meat.
- Robust aquaculture industry.
- Increasing disposable incomes.
- Well-established distribution networks.
- Frozen Segment Dominance:
- Longer shelf life compared to other forms.
- Convenience for consumers and retailers.
- Well-established supply chains.
- Blue Crab Market Leadership:
- High consumer preference due to taste and texture.
- Wider availability compared to other crab types.
- Established supply chains.
Crab Market Product Innovations
Recent product innovations in the crab market focus on enhancing convenience, improving shelf life, and catering to diverse consumer preferences. This includes the development of ready-to-eat crab dishes, pre-portioned crab meat packs, and value-added crab products with unique flavor profiles. Technological advancements in processing and packaging contribute to improved product quality and reduce waste. These innovations are enhancing market competitiveness and expanding the range of applications for crab products.
Report Segmentation & Scope
The report segments the global crab market based on form (Frozen, Canned, Other Forms) and type (Blue Crab, Chinese Mitten Crab, Gazami Crab, Other Crab Types). Each segment is analyzed in detail, providing market size, growth projections, and competitive dynamics. For instance, the frozen segment is expected to exhibit a CAGR of xx% during the forecast period, driven by its convenience and extended shelf life. The blue crab segment is projected to maintain its dominant market share due to its high consumer preference. The report provides a comprehensive overview of each segment's dynamics, aiding strategic decision-making.
Key Drivers of Crab Market Growth
Several factors are driving the growth of the global crab market. Rising disposable incomes in emerging economies are boosting demand for premium seafood products, including crab. The growing awareness of the health benefits of crab meat, rich in protein and omega-3 fatty acids, is also contributing to market expansion. Technological advancements in fishing and processing techniques enhance efficiency and product quality. Furthermore, supportive government policies aimed at promoting sustainable fishing practices are creating a positive environment for market growth.
Challenges in the Crab Market Sector
The crab market faces several challenges, including fluctuations in crab populations due to environmental factors and overfishing. Supply chain disruptions, especially related to logistics and transportation, can impact product availability and pricing. Intense competition among existing players and new entrants necessitates continuous innovation and efficient cost management. Stricter regulatory frameworks related to sustainable fishing and food safety increase operating costs for businesses. These factors can create uncertainty and volatility within the market.
Leading Players in the Crab Market Market
- Bumble Bee Foods LLC
- JM Clayton Seafood Company
- Handy Seafoo
- Maine Lobster Now
- Phil-Union Frozen Foods Inc
- Siam Canadian Group Limited
- RGE Agridev Corporation
- Millennium Ocean Star Corporation
- Supreme Crab & Seafood Inc
Key Developments in Crab Market Sector
- 2022 Q3: [Insert a key development with quantifiable impact, e.g., "Launch of a new sustainable fishing initiative by X company, resulting in a 10% increase in certified sustainable crab supply."]
- 2023 Q1: [Insert a key development with quantifiable impact]
- 2024 Q4: [Insert a key development with quantifiable impact]
Strategic Crab Market Market Outlook
The global crab market presents significant growth potential over the forecast period. Continued innovation in product development, sustainable fishing practices, and efficient supply chain management will be crucial for success. Companies that effectively cater to evolving consumer preferences and adapt to changing regulatory landscapes will be well-positioned to capitalize on emerging opportunities. Strategic partnerships and collaborations can enhance market penetration and competitiveness. The market outlook is optimistic, with substantial growth expected across various segments and regions.
Crab Market Segmentation
- 1. Production Analysis
- 2. Consumption Analysis
- 3. Import Market Analysis (Value & Volume)
- 4. Export Market Analysis (Value & Volume)
- 5. Price Trend Analysis
Crab Market Segmentation By Geography
-
1. North America
- 1.1. United States
- 1.2. Canada
- 1.3. Mexico
-
2. South America
- 2.1. Brazil
- 2.2. Argentina
- 2.3. Rest of South America
-
3. Europe
- 3.1. United Kingdom
- 3.2. Germany
- 3.3. France
- 3.4. Italy
- 3.5. Spain
- 3.6. Russia
- 3.7. Benelux
- 3.8. Nordics
- 3.9. Rest of Europe
-
4. Middle East & Africa
- 4.1. Turkey
- 4.2. Israel
- 4.3. GCC
- 4.4. North Africa
- 4.5. South Africa
- 4.6. Rest of Middle East & Africa
-
5. Asia Pacific
- 5.1. China
- 5.2. India
- 5.3. Japan
- 5.4. South Korea
- 5.5. ASEAN
- 5.6. Oceania
- 5.7. Rest of Asia Pacific
Crab Market REPORT HIGHLIGHTS
| Aspects | Details |
|---|---|
| Study Period | 2019-2033 |
| Base Year | 2024 |
| Estimated Year | 2025 |
| Forecast Period | 2025-2033 |
| Historical Period | 2019-2024 |
| Growth Rate | CAGR of 5.72% from 2019-2033 |
| Segmentation |
|
Table of Contents
- 1. Introduction
- 1.1. Research Scope
- 1.2. Market Segmentation
- 1.3. Research Methodology
- 1.4. Definitions and Assumptions
- 2. Executive Summary
- 2.1. Introduction
- 3. Market Dynamics
- 3.1. Introduction
- 3.2. Market Drivers
- 3.2.1. Awareness of Landscaping Maintenance; Technological Advancements
- 3.3. Market Restrains
- 3.3.1. Shortage of Skilled Labor; Wastage of High Amount of Water For Irrigating Lawns
- 3.4. Market Trends
- 3.4.1. Increasing Awareness About the Health Benefits of Crabs
- 4. Market Factor Analysis
- 4.1. Porters Five Forces
- 4.2. Supply/Value Chain
- 4.3. PESTEL analysis
- 4.4. Market Entropy
- 4.5. Patent/Trademark Analysis
- 5. Global Crab Market Analysis, Insights and Forecast, 2019-2031
- 5.1. Market Analysis, Insights and Forecast - by Production Analysis
- 5.2. Market Analysis, Insights and Forecast - by Consumption Analysis
- 5.3. Market Analysis, Insights and Forecast - by Import Market Analysis (Value & Volume)
- 5.4. Market Analysis, Insights and Forecast - by Export Market Analysis (Value & Volume)
- 5.5. Market Analysis, Insights and Forecast - by Price Trend Analysis
- 5.6. Market Analysis, Insights and Forecast - by Region
- 5.6.1. North America
- 5.6.2. South America
- 5.6.3. Europe
- 5.6.4. Middle East & Africa
- 5.6.5. Asia Pacific
- 5.1. Market Analysis, Insights and Forecast - by Production Analysis
- 6. North America Crab Market Analysis, Insights and Forecast, 2019-2031
- 6.1. Market Analysis, Insights and Forecast - by Production Analysis
- 6.2. Market Analysis, Insights and Forecast - by Consumption Analysis
- 6.3. Market Analysis, Insights and Forecast - by Import Market Analysis (Value & Volume)
- 6.4. Market Analysis, Insights and Forecast - by Export Market Analysis (Value & Volume)
- 6.5. Market Analysis, Insights and Forecast - by Price Trend Analysis
- 6.1. Market Analysis, Insights and Forecast - by Production Analysis
- 7. South America Crab Market Analysis, Insights and Forecast, 2019-2031
- 7.1. Market Analysis, Insights and Forecast - by Production Analysis
- 7.2. Market Analysis, Insights and Forecast - by Consumption Analysis
- 7.3. Market Analysis, Insights and Forecast - by Import Market Analysis (Value & Volume)
- 7.4. Market Analysis, Insights and Forecast - by Export Market Analysis (Value & Volume)
- 7.5. Market Analysis, Insights and Forecast - by Price Trend Analysis
- 7.1. Market Analysis, Insights and Forecast - by Production Analysis
- 8. Europe Crab Market Analysis, Insights and Forecast, 2019-2031
- 8.1. Market Analysis, Insights and Forecast - by Production Analysis
- 8.2. Market Analysis, Insights and Forecast - by Consumption Analysis
- 8.3. Market Analysis, Insights and Forecast - by Import Market Analysis (Value & Volume)
- 8.4. Market Analysis, Insights and Forecast - by Export Market Analysis (Value & Volume)
- 8.5. Market Analysis, Insights and Forecast - by Price Trend Analysis
- 8.1. Market Analysis, Insights and Forecast - by Production Analysis
- 9. Middle East & Africa Crab Market Analysis, Insights and Forecast, 2019-2031
- 9.1. Market Analysis, Insights and Forecast - by Production Analysis
- 9.2. Market Analysis, Insights and Forecast - by Consumption Analysis
- 9.3. Market Analysis, Insights and Forecast - by Import Market Analysis (Value & Volume)
- 9.4. Market Analysis, Insights and Forecast - by Export Market Analysis (Value & Volume)
- 9.5. Market Analysis, Insights and Forecast - by Price Trend Analysis
- 9.1. Market Analysis, Insights and Forecast - by Production Analysis
- 10. Asia Pacific Crab Market Analysis, Insights and Forecast, 2019-2031
- 10.1. Market Analysis, Insights and Forecast - by Production Analysis
- 10.2. Market Analysis, Insights and Forecast - by Consumption Analysis
- 10.3. Market Analysis, Insights and Forecast - by Import Market Analysis (Value & Volume)
- 10.4. Market Analysis, Insights and Forecast - by Export Market Analysis (Value & Volume)
- 10.5. Market Analysis, Insights and Forecast - by Price Trend Analysis
- 10.1. Market Analysis, Insights and Forecast - by Production Analysis
- 11. North America Crab Market Analysis, Insights and Forecast, 2019-2031
- 11.1. Market Analysis, Insights and Forecast - By Country/Sub-region
- 11.1.1 United States
- 11.1.2 Canada
- 11.1.3 Mexico
- 12. Europe Crab Market Analysis, Insights and Forecast, 2019-2031
- 12.1. Market Analysis, Insights and Forecast - By Country/Sub-region
- 12.1.1 Germany
- 12.1.2 United Kingdom
- 12.1.3 France
- 12.1.4 Spain
- 12.1.5 Italy
- 12.1.6 Spain
- 12.1.7 Belgium
- 12.1.8 Netherland
- 12.1.9 Nordics
- 12.1.10 Rest of Europe
- 13. Asia Pacific Crab Market Analysis, Insights and Forecast, 2019-2031
- 13.1. Market Analysis, Insights and Forecast - By Country/Sub-region
- 13.1.1 China
- 13.1.2 Japan
- 13.1.3 India
- 13.1.4 South Korea
- 13.1.5 Southeast Asia
- 13.1.6 Australia
- 13.1.7 Indonesia
- 13.1.8 Phillipes
- 13.1.9 Singapore
- 13.1.10 Thailandc
- 13.1.11 Rest of Asia Pacific
- 14. South America Crab Market Analysis, Insights and Forecast, 2019-2031
- 14.1. Market Analysis, Insights and Forecast - By Country/Sub-region
- 14.1.1 Brazil
- 14.1.2 Argentina
- 14.1.3 Peru
- 14.1.4 Chile
- 14.1.5 Colombia
- 14.1.6 Ecuador
- 14.1.7 Venezuela
- 14.1.8 Rest of South America
- 15. North America Crab Market Analysis, Insights and Forecast, 2019-2031
- 15.1. Market Analysis, Insights and Forecast - By Country/Sub-region
- 15.1.1 United States
- 15.1.2 Canada
- 15.1.3 Mexico
- 16. MEA Crab Market Analysis, Insights and Forecast, 2019-2031
- 16.1. Market Analysis, Insights and Forecast - By Country/Sub-region
- 16.1.1 United Arab Emirates
- 16.1.2 Saudi Arabia
- 16.1.3 South Africa
- 16.1.4 Rest of Middle East and Africa
- 17. Competitive Analysis
- 17.1. Global Market Share Analysis 2024
- 17.2. Company Profiles
- 17.2.1 Bumble Bee Foods LLC
- 17.2.1.1. Overview
- 17.2.1.2. Products
- 17.2.1.3. SWOT Analysis
- 17.2.1.4. Recent Developments
- 17.2.1.5. Financials (Based on Availability)
- 17.2.2 JM Clayton Seafood Company
- 17.2.2.1. Overview
- 17.2.2.2. Products
- 17.2.2.3. SWOT Analysis
- 17.2.2.4. Recent Developments
- 17.2.2.5. Financials (Based on Availability)
- 17.2.3 Handy Seafoo
- 17.2.3.1. Overview
- 17.2.3.2. Products
- 17.2.3.3. SWOT Analysis
- 17.2.3.4. Recent Developments
- 17.2.3.5. Financials (Based on Availability)
- 17.2.4 Maine Lobster Now
- 17.2.4.1. Overview
- 17.2.4.2. Products
- 17.2.4.3. SWOT Analysis
- 17.2.4.4. Recent Developments
- 17.2.4.5. Financials (Based on Availability)
- 17.2.5 Phil-Union Frozen Foods Inc
- 17.2.5.1. Overview
- 17.2.5.2. Products
- 17.2.5.3. SWOT Analysis
- 17.2.5.4. Recent Developments
- 17.2.5.5. Financials (Based on Availability)
- 17.2.6 Siam Canadian Group Limited
- 17.2.6.1. Overview
- 17.2.6.2. Products
- 17.2.6.3. SWOT Analysis
- 17.2.6.4. Recent Developments
- 17.2.6.5. Financials (Based on Availability)
- 17.2.7 RGE Agridev Corporation
- 17.2.7.1. Overview
- 17.2.7.2. Products
- 17.2.7.3. SWOT Analysis
- 17.2.7.4. Recent Developments
- 17.2.7.5. Financials (Based on Availability)
- 17.2.8 Millennium Ocean Star Corporation
- 17.2.8.1. Overview
- 17.2.8.2. Products
- 17.2.8.3. SWOT Analysis
- 17.2.8.4. Recent Developments
- 17.2.8.5. Financials (Based on Availability)
- 17.2.9 Supreme Crab & Seafood Inc
- 17.2.9.1. Overview
- 17.2.9.2. Products
- 17.2.9.3. SWOT Analysis
- 17.2.9.4. Recent Developments
- 17.2.9.5. Financials (Based on Availability)
- 17.2.1 Bumble Bee Foods LLC
List of Figures
- Figure 1: Global Crab Market Revenue Breakdown (Million, %) by Region 2024 & 2032
- Figure 2: North America Crab Market Revenue (Million), by Country 2024 & 2032
- Figure 3: North America Crab Market Revenue Share (%), by Country 2024 & 2032
- Figure 4: Europe Crab Market Revenue (Million), by Country 2024 & 2032
- Figure 5: Europe Crab Market Revenue Share (%), by Country 2024 & 2032
- Figure 6: Asia Pacific Crab Market Revenue (Million), by Country 2024 & 2032
- Figure 7: Asia Pacific Crab Market Revenue Share (%), by Country 2024 & 2032
- Figure 8: South America Crab Market Revenue (Million), by Country 2024 & 2032
- Figure 9: South America Crab Market Revenue Share (%), by Country 2024 & 2032
- Figure 10: North America Crab Market Revenue (Million), by Country 2024 & 2032
- Figure 11: North America Crab Market Revenue Share (%), by Country 2024 & 2032
- Figure 12: MEA Crab Market Revenue (Million), by Country 2024 & 2032
- Figure 13: MEA Crab Market Revenue Share (%), by Country 2024 & 2032
- Figure 14: North America Crab Market Revenue (Million), by Production Analysis 2024 & 2032
- Figure 15: North America Crab Market Revenue Share (%), by Production Analysis 2024 & 2032
- Figure 16: North America Crab Market Revenue (Million), by Consumption Analysis 2024 & 2032
- Figure 17: North America Crab Market Revenue Share (%), by Consumption Analysis 2024 & 2032
- Figure 18: North America Crab Market Revenue (Million), by Import Market Analysis (Value & Volume) 2024 & 2032
- Figure 19: North America Crab Market Revenue Share (%), by Import Market Analysis (Value & Volume) 2024 & 2032
- Figure 20: North America Crab Market Revenue (Million), by Export Market Analysis (Value & Volume) 2024 & 2032
- Figure 21: North America Crab Market Revenue Share (%), by Export Market Analysis (Value & Volume) 2024 & 2032
- Figure 22: North America Crab Market Revenue (Million), by Price Trend Analysis 2024 & 2032
- Figure 23: North America Crab Market Revenue Share (%), by Price Trend Analysis 2024 & 2032
- Figure 24: North America Crab Market Revenue (Million), by Country 2024 & 2032
- Figure 25: North America Crab Market Revenue Share (%), by Country 2024 & 2032
- Figure 26: South America Crab Market Revenue (Million), by Production Analysis 2024 & 2032
- Figure 27: South America Crab Market Revenue Share (%), by Production Analysis 2024 & 2032
- Figure 28: South America Crab Market Revenue (Million), by Consumption Analysis 2024 & 2032
- Figure 29: South America Crab Market Revenue Share (%), by Consumption Analysis 2024 & 2032
- Figure 30: South America Crab Market Revenue (Million), by Import Market Analysis (Value & Volume) 2024 & 2032
- Figure 31: South America Crab Market Revenue Share (%), by Import Market Analysis (Value & Volume) 2024 & 2032
- Figure 32: South America Crab Market Revenue (Million), by Export Market Analysis (Value & Volume) 2024 & 2032
- Figure 33: South America Crab Market Revenue Share (%), by Export Market Analysis (Value & Volume) 2024 & 2032
- Figure 34: South America Crab Market Revenue (Million), by Price Trend Analysis 2024 & 2032
- Figure 35: South America Crab Market Revenue Share (%), by Price Trend Analysis 2024 & 2032
- Figure 36: South America Crab Market Revenue (Million), by Country 2024 & 2032
- Figure 37: South America Crab Market Revenue Share (%), by Country 2024 & 2032
- Figure 38: Europe Crab Market Revenue (Million), by Production Analysis 2024 & 2032
- Figure 39: Europe Crab Market Revenue Share (%), by Production Analysis 2024 & 2032
- Figure 40: Europe Crab Market Revenue (Million), by Consumption Analysis 2024 & 2032
- Figure 41: Europe Crab Market Revenue Share (%), by Consumption Analysis 2024 & 2032
- Figure 42: Europe Crab Market Revenue (Million), by Import Market Analysis (Value & Volume) 2024 & 2032
- Figure 43: Europe Crab Market Revenue Share (%), by Import Market Analysis (Value & Volume) 2024 & 2032
- Figure 44: Europe Crab Market Revenue (Million), by Export Market Analysis (Value & Volume) 2024 & 2032
- Figure 45: Europe Crab Market Revenue Share (%), by Export Market Analysis (Value & Volume) 2024 & 2032
- Figure 46: Europe Crab Market Revenue (Million), by Price Trend Analysis 2024 & 2032
- Figure 47: Europe Crab Market Revenue Share (%), by Price Trend Analysis 2024 & 2032
- Figure 48: Europe Crab Market Revenue (Million), by Country 2024 & 2032
- Figure 49: Europe Crab Market Revenue Share (%), by Country 2024 & 2032
- Figure 50: Middle East & Africa Crab Market Revenue (Million), by Production Analysis 2024 & 2032
- Figure 51: Middle East & Africa Crab Market Revenue Share (%), by Production Analysis 2024 & 2032
- Figure 52: Middle East & Africa Crab Market Revenue (Million), by Consumption Analysis 2024 & 2032
- Figure 53: Middle East & Africa Crab Market Revenue Share (%), by Consumption Analysis 2024 & 2032
- Figure 54: Middle East & Africa Crab Market Revenue (Million), by Import Market Analysis (Value & Volume) 2024 & 2032
- Figure 55: Middle East & Africa Crab Market Revenue Share (%), by Import Market Analysis (Value & Volume) 2024 & 2032
- Figure 56: Middle East & Africa Crab Market Revenue (Million), by Export Market Analysis (Value & Volume) 2024 & 2032
- Figure 57: Middle East & Africa Crab Market Revenue Share (%), by Export Market Analysis (Value & Volume) 2024 & 2032
- Figure 58: Middle East & Africa Crab Market Revenue (Million), by Price Trend Analysis 2024 & 2032
- Figure 59: Middle East & Africa Crab Market Revenue Share (%), by Price Trend Analysis 2024 & 2032
- Figure 60: Middle East & Africa Crab Market Revenue (Million), by Country 2024 & 2032
- Figure 61: Middle East & Africa Crab Market Revenue Share (%), by Country 2024 & 2032
- Figure 62: Asia Pacific Crab Market Revenue (Million), by Production Analysis 2024 & 2032
- Figure 63: Asia Pacific Crab Market Revenue Share (%), by Production Analysis 2024 & 2032
- Figure 64: Asia Pacific Crab Market Revenue (Million), by Consumption Analysis 2024 & 2032
- Figure 65: Asia Pacific Crab Market Revenue Share (%), by Consumption Analysis 2024 & 2032
- Figure 66: Asia Pacific Crab Market Revenue (Million), by Import Market Analysis (Value & Volume) 2024 & 2032
- Figure 67: Asia Pacific Crab Market Revenue Share (%), by Import Market Analysis (Value & Volume) 2024 & 2032
- Figure 68: Asia Pacific Crab Market Revenue (Million), by Export Market Analysis (Value & Volume) 2024 & 2032
- Figure 69: Asia Pacific Crab Market Revenue Share (%), by Export Market Analysis (Value & Volume) 2024 & 2032
- Figure 70: Asia Pacific Crab Market Revenue (Million), by Price Trend Analysis 2024 & 2032
- Figure 71: Asia Pacific Crab Market Revenue Share (%), by Price Trend Analysis 2024 & 2032
- Figure 72: Asia Pacific Crab Market Revenue (Million), by Country 2024 & 2032
- Figure 73: Asia Pacific Crab Market Revenue Share (%), by Country 2024 & 2032
List of Tables
- Table 1: Global Crab Market Revenue Million Forecast, by Region 2019 & 2032
- Table 2: Global Crab Market Revenue Million Forecast, by Production Analysis 2019 & 2032
- Table 3: Global Crab Market Revenue Million Forecast, by Consumption Analysis 2019 & 2032
- Table 4: Global Crab Market Revenue Million Forecast, by Import Market Analysis (Value & Volume) 2019 & 2032
- Table 5: Global Crab Market Revenue Million Forecast, by Export Market Analysis (Value & Volume) 2019 & 2032
- Table 6: Global Crab Market Revenue Million Forecast, by Price Trend Analysis 2019 & 2032
- Table 7: Global Crab Market Revenue Million Forecast, by Region 2019 & 2032
- Table 8: Global Crab Market Revenue Million Forecast, by Country 2019 & 2032
- Table 9: United States Crab Market Revenue (Million) Forecast, by Application 2019 & 2032
- Table 10: Canada Crab Market Revenue (Million) Forecast, by Application 2019 & 2032
- Table 11: Mexico Crab Market Revenue (Million) Forecast, by Application 2019 & 2032
- Table 12: Global Crab Market Revenue Million Forecast, by Country 2019 & 2032
- Table 13: Germany Crab Market Revenue (Million) Forecast, by Application 2019 & 2032
- Table 14: United Kingdom Crab Market Revenue (Million) Forecast, by Application 2019 & 2032
- Table 15: France Crab Market Revenue (Million) Forecast, by Application 2019 & 2032
- Table 16: Spain Crab Market Revenue (Million) Forecast, by Application 2019 & 2032
- Table 17: Italy Crab Market Revenue (Million) Forecast, by Application 2019 & 2032
- Table 18: Spain Crab Market Revenue (Million) Forecast, by Application 2019 & 2032
- Table 19: Belgium Crab Market Revenue (Million) Forecast, by Application 2019 & 2032
- Table 20: Netherland Crab Market Revenue (Million) Forecast, by Application 2019 & 2032
- Table 21: Nordics Crab Market Revenue (Million) Forecast, by Application 2019 & 2032
- Table 22: Rest of Europe Crab Market Revenue (Million) Forecast, by Application 2019 & 2032
- Table 23: Global Crab Market Revenue Million Forecast, by Country 2019 & 2032
- Table 24: China Crab Market Revenue (Million) Forecast, by Application 2019 & 2032
- Table 25: Japan Crab Market Revenue (Million) Forecast, by Application 2019 & 2032
- Table 26: India Crab Market Revenue (Million) Forecast, by Application 2019 & 2032
- Table 27: South Korea Crab Market Revenue (Million) Forecast, by Application 2019 & 2032
- Table 28: Southeast Asia Crab Market Revenue (Million) Forecast, by Application 2019 & 2032
- Table 29: Australia Crab Market Revenue (Million) Forecast, by Application 2019 & 2032
- Table 30: Indonesia Crab Market Revenue (Million) Forecast, by Application 2019 & 2032
- Table 31: Phillipes Crab Market Revenue (Million) Forecast, by Application 2019 & 2032
- Table 32: Singapore Crab Market Revenue (Million) Forecast, by Application 2019 & 2032
- Table 33: Thailandc Crab Market Revenue (Million) Forecast, by Application 2019 & 2032
- Table 34: Rest of Asia Pacific Crab Market Revenue (Million) Forecast, by Application 2019 & 2032
- Table 35: Global Crab Market Revenue Million Forecast, by Country 2019 & 2032
- Table 36: Brazil Crab Market Revenue (Million) Forecast, by Application 2019 & 2032
- Table 37: Argentina Crab Market Revenue (Million) Forecast, by Application 2019 & 2032
- Table 38: Peru Crab Market Revenue (Million) Forecast, by Application 2019 & 2032
- Table 39: Chile Crab Market Revenue (Million) Forecast, by Application 2019 & 2032
- Table 40: Colombia Crab Market Revenue (Million) Forecast, by Application 2019 & 2032
- Table 41: Ecuador Crab Market Revenue (Million) Forecast, by Application 2019 & 2032
- Table 42: Venezuela Crab Market Revenue (Million) Forecast, by Application 2019 & 2032
- Table 43: Rest of South America Crab Market Revenue (Million) Forecast, by Application 2019 & 2032
- Table 44: Global Crab Market Revenue Million Forecast, by Country 2019 & 2032
- Table 45: United States Crab Market Revenue (Million) Forecast, by Application 2019 & 2032
- Table 46: Canada Crab Market Revenue (Million) Forecast, by Application 2019 & 2032
- Table 47: Mexico Crab Market Revenue (Million) Forecast, by Application 2019 & 2032
- Table 48: Global Crab Market Revenue Million Forecast, by Country 2019 & 2032
- Table 49: United Arab Emirates Crab Market Revenue (Million) Forecast, by Application 2019 & 2032
- Table 50: Saudi Arabia Crab Market Revenue (Million) Forecast, by Application 2019 & 2032
- Table 51: South Africa Crab Market Revenue (Million) Forecast, by Application 2019 & 2032
- Table 52: Rest of Middle East and Africa Crab Market Revenue (Million) Forecast, by Application 2019 & 2032
- Table 53: Global Crab Market Revenue Million Forecast, by Production Analysis 2019 & 2032
- Table 54: Global Crab Market Revenue Million Forecast, by Consumption Analysis 2019 & 2032
- Table 55: Global Crab Market Revenue Million Forecast, by Import Market Analysis (Value & Volume) 2019 & 2032
- Table 56: Global Crab Market Revenue Million Forecast, by Export Market Analysis (Value & Volume) 2019 & 2032
- Table 57: Global Crab Market Revenue Million Forecast, by Price Trend Analysis 2019 & 2032
- Table 58: Global Crab Market Revenue Million Forecast, by Country 2019 & 2032
- Table 59: United States Crab Market Revenue (Million) Forecast, by Application 2019 & 2032
- Table 60: Canada Crab Market Revenue (Million) Forecast, by Application 2019 & 2032
- Table 61: Mexico Crab Market Revenue (Million) Forecast, by Application 2019 & 2032
- Table 62: Global Crab Market Revenue Million Forecast, by Production Analysis 2019 & 2032
- Table 63: Global Crab Market Revenue Million Forecast, by Consumption Analysis 2019 & 2032
- Table 64: Global Crab Market Revenue Million Forecast, by Import Market Analysis (Value & Volume) 2019 & 2032
- Table 65: Global Crab Market Revenue Million Forecast, by Export Market Analysis (Value & Volume) 2019 & 2032
- Table 66: Global Crab Market Revenue Million Forecast, by Price Trend Analysis 2019 & 2032
- Table 67: Global Crab Market Revenue Million Forecast, by Country 2019 & 2032
- Table 68: Brazil Crab Market Revenue (Million) Forecast, by Application 2019 & 2032
- Table 69: Argentina Crab Market Revenue (Million) Forecast, by Application 2019 & 2032
- Table 70: Rest of South America Crab Market Revenue (Million) Forecast, by Application 2019 & 2032
- Table 71: Global Crab Market Revenue Million Forecast, by Production Analysis 2019 & 2032
- Table 72: Global Crab Market Revenue Million Forecast, by Consumption Analysis 2019 & 2032
- Table 73: Global Crab Market Revenue Million Forecast, by Import Market Analysis (Value & Volume) 2019 & 2032
- Table 74: Global Crab Market Revenue Million Forecast, by Export Market Analysis (Value & Volume) 2019 & 2032
- Table 75: Global Crab Market Revenue Million Forecast, by Price Trend Analysis 2019 & 2032
- Table 76: Global Crab Market Revenue Million Forecast, by Country 2019 & 2032
- Table 77: United Kingdom Crab Market Revenue (Million) Forecast, by Application 2019 & 2032
- Table 78: Germany Crab Market Revenue (Million) Forecast, by Application 2019 & 2032
- Table 79: France Crab Market Revenue (Million) Forecast, by Application 2019 & 2032
- Table 80: Italy Crab Market Revenue (Million) Forecast, by Application 2019 & 2032
- Table 81: Spain Crab Market Revenue (Million) Forecast, by Application 2019 & 2032
- Table 82: Russia Crab Market Revenue (Million) Forecast, by Application 2019 & 2032
- Table 83: Benelux Crab Market Revenue (Million) Forecast, by Application 2019 & 2032
- Table 84: Nordics Crab Market Revenue (Million) Forecast, by Application 2019 & 2032
- Table 85: Rest of Europe Crab Market Revenue (Million) Forecast, by Application 2019 & 2032
- Table 86: Global Crab Market Revenue Million Forecast, by Production Analysis 2019 & 2032
- Table 87: Global Crab Market Revenue Million Forecast, by Consumption Analysis 2019 & 2032
- Table 88: Global Crab Market Revenue Million Forecast, by Import Market Analysis (Value & Volume) 2019 & 2032
- Table 89: Global Crab Market Revenue Million Forecast, by Export Market Analysis (Value & Volume) 2019 & 2032
- Table 90: Global Crab Market Revenue Million Forecast, by Price Trend Analysis 2019 & 2032
- Table 91: Global Crab Market Revenue Million Forecast, by Country 2019 & 2032
- Table 92: Turkey Crab Market Revenue (Million) Forecast, by Application 2019 & 2032
- Table 93: Israel Crab Market Revenue (Million) Forecast, by Application 2019 & 2032
- Table 94: GCC Crab Market Revenue (Million) Forecast, by Application 2019 & 2032
- Table 95: North Africa Crab Market Revenue (Million) Forecast, by Application 2019 & 2032
- Table 96: South Africa Crab Market Revenue (Million) Forecast, by Application 2019 & 2032
- Table 97: Rest of Middle East & Africa Crab Market Revenue (Million) Forecast, by Application 2019 & 2032
- Table 98: Global Crab Market Revenue Million Forecast, by Production Analysis 2019 & 2032
- Table 99: Global Crab Market Revenue Million Forecast, by Consumption Analysis 2019 & 2032
- Table 100: Global Crab Market Revenue Million Forecast, by Import Market Analysis (Value & Volume) 2019 & 2032
- Table 101: Global Crab Market Revenue Million Forecast, by Export Market Analysis (Value & Volume) 2019 & 2032
- Table 102: Global Crab Market Revenue Million Forecast, by Price Trend Analysis 2019 & 2032
- Table 103: Global Crab Market Revenue Million Forecast, by Country 2019 & 2032
- Table 104: China Crab Market Revenue (Million) Forecast, by Application 2019 & 2032
- Table 105: India Crab Market Revenue (Million) Forecast, by Application 2019 & 2032
- Table 106: Japan Crab Market Revenue (Million) Forecast, by Application 2019 & 2032
- Table 107: South Korea Crab Market Revenue (Million) Forecast, by Application 2019 & 2032
- Table 108: ASEAN Crab Market Revenue (Million) Forecast, by Application 2019 & 2032
- Table 109: Oceania Crab Market Revenue (Million) Forecast, by Application 2019 & 2032
- Table 110: Rest of Asia Pacific Crab Market Revenue (Million) Forecast, by Application 2019 & 2032
Frequently Asked Questions
1. What is the projected Compound Annual Growth Rate (CAGR) of the Crab Market?
The projected CAGR is approximately 5.72%.
2. Which companies are prominent players in the Crab Market?
Key companies in the market include Bumble Bee Foods LLC, JM Clayton Seafood Company, Handy Seafoo, Maine Lobster Now, Phil-Union Frozen Foods Inc, Siam Canadian Group Limited, RGE Agridev Corporation, Millennium Ocean Star Corporation, Supreme Crab & Seafood Inc.
3. What are the main segments of the Crab Market?
The market segments include Production Analysis, Consumption Analysis, Import Market Analysis (Value & Volume), Export Market Analysis (Value & Volume), Price Trend Analysis.
4. Can you provide details about the market size?
The market size is estimated to be USD 11.85 Million as of 2022.
5. What are some drivers contributing to market growth?
Awareness of Landscaping Maintenance; Technological Advancements.
6. What are the notable trends driving market growth?
Increasing Awareness About the Health Benefits of Crabs.
7. Are there any restraints impacting market growth?
Shortage of Skilled Labor; Wastage of High Amount of Water For Irrigating Lawns.
8. Can you provide examples of recent developments in the market?
N/A
9. What pricing options are available for accessing the report?
Pricing options include single-user, multi-user, and enterprise licenses priced at USD 4750, USD 5250, and USD 8750 respectively.
10. Is the market size provided in terms of value or volume?
The market size is provided in terms of value, measured in Million.
11. Are there any specific market keywords associated with the report?
Yes, the market keyword associated with the report is "Crab Market," which aids in identifying and referencing the specific market segment covered.
12. How do I determine which pricing option suits my needs best?
The pricing options vary based on user requirements and access needs. Individual users may opt for single-user licenses, while businesses requiring broader access may choose multi-user or enterprise licenses for cost-effective access to the report.
13. Are there any additional resources or data provided in the Crab Market report?
While the report offers comprehensive insights, it's advisable to review the specific contents or supplementary materials provided to ascertain if additional resources or data are available.
14. How can I stay updated on further developments or reports in the Crab Market?
To stay informed about further developments, trends, and reports in the Crab Market, consider subscribing to industry newsletters, following relevant companies and organizations, or regularly checking reputable industry news sources and publications.
Methodology
Step 1 - Identification of Relevant Samples Size from Population Database


Step 2 - Approaches for Defining Global Market Size (Value, Volume* & Price*)

Note*: In applicable scenarios
Step 3 - Data Sources
Primary Research
- Web Analytics
- Survey Reports
- Research Institute
- Latest Research Reports
- Opinion Leaders
Secondary Research
- Annual Reports
- White Paper
- Latest Press Release
- Industry Association
- Paid Database
- Investor Presentations

Step 4 - Data Triangulation
Involves using different sources of information in order to increase the validity of a study
These sources are likely to be stakeholders in a program - participants, other researchers, program staff, other community members, and so on.
Then we put all data in single framework & apply various statistical tools to find out the dynamic on the market.
During the analysis stage, feedback from the stakeholder groups would be compared to determine areas of agreement as well as areas of divergence


