
Key Insights
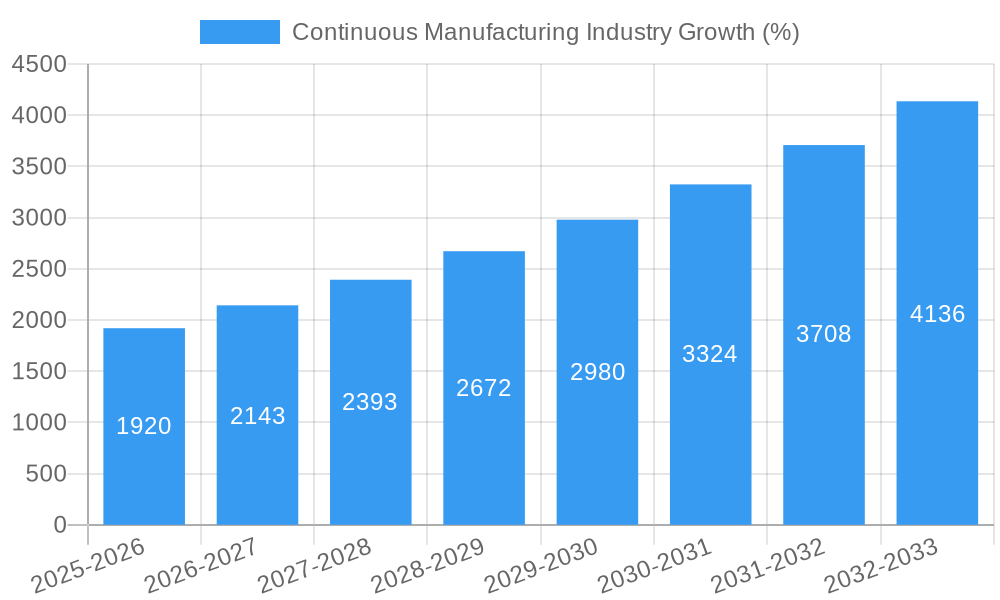
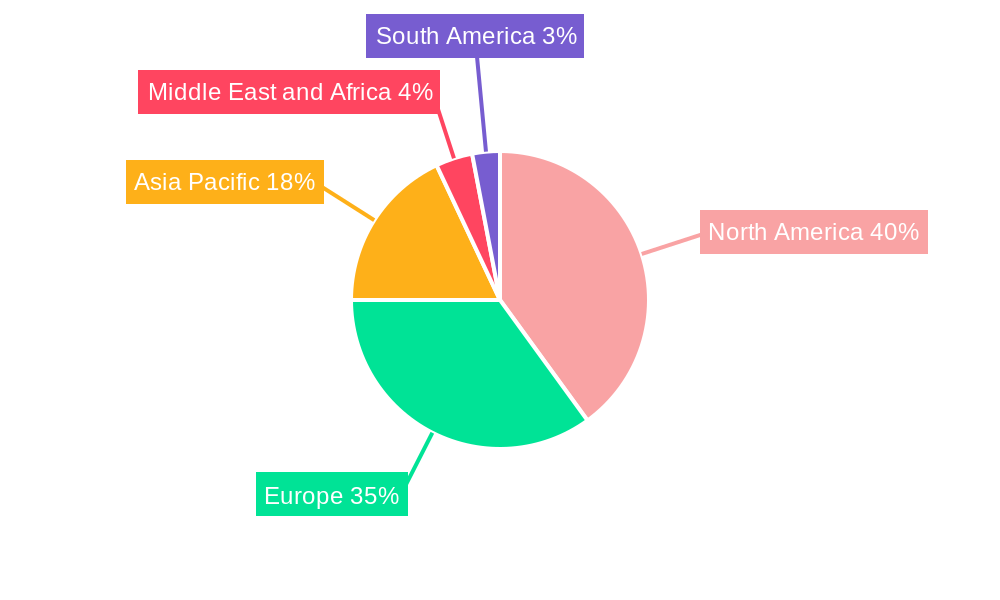
The continuous manufacturing industry is experiencing robust growth, driven by increasing demand for efficient and cost-effective pharmaceutical production. A Compound Annual Growth Rate (CAGR) of 12.80% from 2019-2024 indicates a significant upward trajectory, projected to continue in the coming years. Key drivers include the rising adoption of advanced technologies like integrated continuous manufacturing systems, a growing emphasis on improving product quality and reducing manufacturing variability, and the increasing prevalence of contract manufacturing organizations (CMOs) seeking to enhance their capabilities. The market is segmented by product type (integrated continuous, semi-continuous manufacturing), application (API manufacturing, end-product manufacturing), and end-user (contract manufacturers, pharmaceutical companies). While integrated continuous manufacturing holds the largest market share due to its superior efficiency and reduced waste, the semi-continuous segment is expected to witness substantial growth due to its cost-effectiveness in smaller-scale operations. The pharmaceutical industry’s focus on improving supply chain resilience, combined with regulatory pressures favoring continuous processes, further fuels this expansion. North America and Europe currently dominate the market share due to early adoption of continuous manufacturing technologies and a well-established pharmaceutical industry infrastructure. However, the Asia-Pacific region is poised for significant growth, driven by increasing investments in pharmaceutical manufacturing capabilities and a rising middle class demanding greater access to affordable medicines.
The restraints to market growth primarily revolve around the high initial investment costs associated with implementing continuous manufacturing systems, a need for skilled workforce to operate and maintain these advanced systems, and the inherent complexity in adapting existing manufacturing facilities to accommodate continuous processes. However, ongoing technological advancements, along with supportive government regulations and initiatives promoting the adoption of advanced manufacturing technologies, are expected to mitigate these challenges. Over the forecast period (2025-2033), the continuous manufacturing market is expected to benefit from sustained innovation, particularly in areas like process analytical technology (PAT) integration and the development of more flexible and adaptable continuous manufacturing platforms. This will lead to increased market penetration across various pharmaceutical segments and geographical regions, contributing to long-term sustainable growth.
Continuous Manufacturing Industry: A Comprehensive Market Report (2019-2033)
This detailed report provides a comprehensive analysis of the Continuous Manufacturing industry, offering valuable insights for stakeholders across the value chain. The study period spans from 2019 to 2033, with 2025 serving as both the base and estimated year. The report projects market growth from 2025 to 2033, building upon historical data from 2019 to 2024. The global market is expected to reach xx Million by 2033, exhibiting a CAGR of xx% during the forecast period.
Continuous Manufacturing Industry Market Structure & Competitive Dynamics
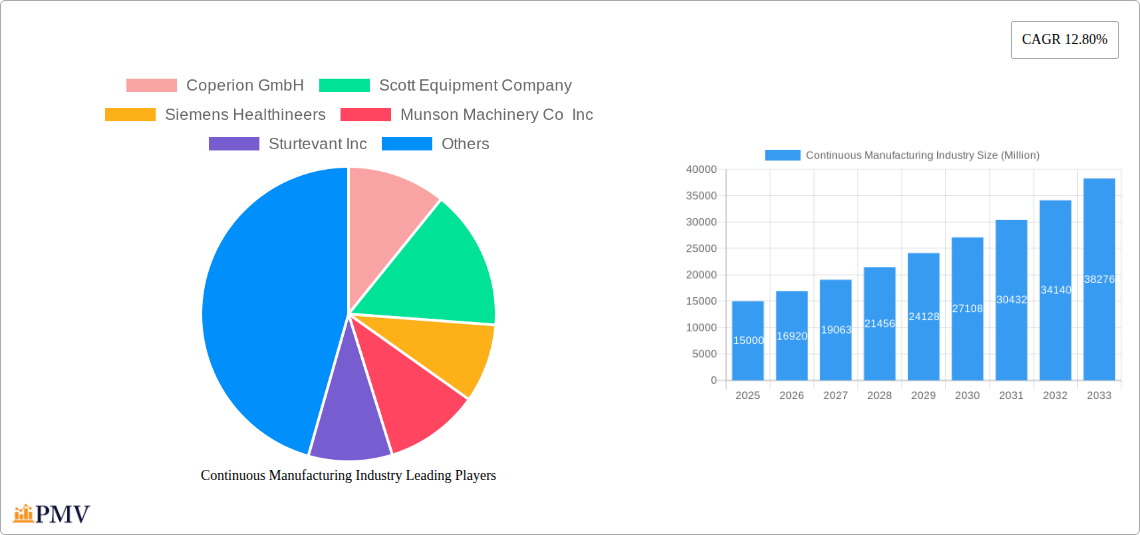
The Continuous Manufacturing industry is characterized by a moderately concentrated market structure, with several key players holding significant market share. Market concentration is expected to increase further as larger players continue to acquire smaller companies and consolidate their position. The competitive landscape is dynamic, with companies engaging in intense R&D activities to develop innovative technologies and gain a competitive edge. Innovation ecosystems are flourishing, supported by collaborations between pharmaceutical companies, contract manufacturers, and technology providers. Stringent regulatory frameworks, particularly within the pharmaceutical sector, influence the market dynamics significantly. Product substitutes are limited, primarily due to the specialized nature of Continuous Manufacturing processes. However, alternative manufacturing methods are constantly being improved. End-user trends favor the adoption of continuous manufacturing due to its improved efficiency, reduced waste, and enhanced product quality. M&A activity has been moderate but is expected to increase as companies seek expansion and technological advancements. While exact market share figures are proprietary data, companies like GEA Group AG, Coperion GmbH and Thermo Fisher Scientific are considered to hold leading positions. Recent M&A deals in the industry have involved values ranging from xx Million to xx Million, showcasing the industry's investment potential.
Continuous Manufacturing Industry Industry Trends & Insights
The Continuous Manufacturing industry is experiencing robust growth driven by several key factors. Increased demand for improved drug quality and efficiency is a major catalyst. Pharmaceutical companies are actively adopting continuous manufacturing to improve process control and reduce production costs. Technological advancements, including automation and process analytical technology (PAT), are further boosting adoption rates. Consumer preferences for high-quality, cost-effective medicines also underpin this trend. The market penetration of continuous manufacturing technologies is steadily increasing across various pharmaceutical segments, with a projected penetration rate of xx% by 2033. Competitive dynamics are intense, with companies investing heavily in R&D to develop novel solutions and expand their market share. The industry is witnessing a shift towards integrated continuous manufacturing solutions, offering end-to-end process control and improved efficiency. Market growth is projected at a CAGR of xx% during the forecast period.
Dominant Markets & Segments in Continuous Manufacturing Industry
The North American region is currently the dominant market for Continuous Manufacturing, driven by strong pharmaceutical industries and regulatory support. Within this region, the United States stands out as the largest national market.
- Product: Integrated Continuous Manufacturing is the fastest-growing segment, driven by its ability to streamline the entire manufacturing process.
- Application: API Manufacturing currently holds the largest market share, but End Product Manufacturing is showing strong growth, propelled by the demand for specialized products.
- End User: Pharmaceutical Companies are the dominant end-users, but Contract Manufacturers are playing an increasingly significant role, providing capacity and expertise to pharmaceutical companies.
Key drivers for regional dominance include robust economies, favorable regulatory environments, presence of leading pharmaceutical companies and advanced infrastructure. European and Asian markets are also exhibiting strong growth, driven by increasing government investments in pharmaceutical infrastructure and rising demand for efficient pharmaceutical manufacturing.
Continuous Manufacturing Industry Product Innovations
The Continuous Manufacturing industry is characterized by continuous product innovation, focusing on enhancing process efficiency, product quality, and safety. Recent advancements include the integration of artificial intelligence (AI) and machine learning (ML) for predictive maintenance and process optimization. These advancements are not only improving manufacturing efficiencies but also improving the regulatory compliance for the pharmaceutical industry. The market is also seeing an increasing adoption of modular and flexible manufacturing systems, allowing companies to adapt to changing demand and product specifications efficiently. These innovations are enhancing the competitive advantages of companies by enabling faster time-to-market, reduced costs and improved product quality.
Report Segmentation & Scope
This report provides a detailed segmentation of the Continuous Manufacturing industry based on product type, application, and end-user.
- Product: Integrated Continuous Manufacturing and Semi-Continuous Manufacturing. Integrated systems are projected to experience higher growth rates due to their comprehensive advantages.
- Application: API Manufacturing and End Product Manufacturing. API manufacturing currently holds a larger market share due to the larger scale of production.
- End User: Pharmaceutical Companies, Contract Manufacturers, and Other End Users. Pharmaceutical companies are the major drivers of market growth.
Each segment's growth projection, market size, and competitive dynamics are comprehensively analyzed in the full report.
Key Drivers of Continuous Manufacturing Industry Growth
Several factors fuel the growth of the Continuous Manufacturing industry. Technological advancements such as automation, process analytical technology (PAT), and AI-powered solutions enhance efficiency and quality. Stringent regulatory requirements in the pharmaceutical industry, particularly concerning quality and safety, drive adoption. Economic drivers like the need to reduce manufacturing costs and increase production capacity also contribute. The growing demand for personalized medicines is further boosting growth, as continuous manufacturing offers flexible and scalable production processes.
Challenges in the Continuous Manufacturing Industry Sector
The Continuous Manufacturing industry faces challenges such as high initial investment costs for equipment and infrastructure, which may deter smaller companies. Regulatory hurdles and stringent compliance requirements add complexity to adoption. Supply chain disruptions can impact the availability of critical raw materials and components, causing delays in production. Intense competition among established players and emerging companies creates a dynamic and challenging business environment. Addressing these challenges is crucial for ensuring sustainable growth in this sector.
Leading Players in the Continuous Manufacturing Industry Market
- Coperion GmbH
- Scott Equipment Company
- Siemens Healthineers
- Munson Machinery Co Inc
- Sturtevant Inc
- GEA Group AG
- L B Bohle
- Robert Bosch GmbH
- Glatt GmbH
- Thermo Fisher Scientific
- HOSOKAWA MICRON CORP
Key Developments in Continuous Manufacturing Industry Sector
- March 2022: Phlow Corp. entered alliances with VCU Medicines for All Institute and AMPAC Fine Chemicals to offer contract continuous manufacturing R&D services for small molecule pharmaceuticals. This significantly expands the contract manufacturing options for smaller pharmaceutical companies and accelerates development in the field.
- March 2022: United States Pharmacopeia (USP) India invested USD 20 Million in a new continuous manufacturing facility in Hyderabad. This signifies the growing investment in continuous manufacturing infrastructure, particularly in emerging markets.
Strategic Continuous Manufacturing Industry Market Outlook
The Continuous Manufacturing industry is poised for sustained growth, driven by technological innovation, increased demand for high-quality medicines, and favorable regulatory environments. Strategic opportunities exist for companies that can offer innovative solutions, optimize supply chains, and adapt to evolving regulatory landscapes. The focus on integrated solutions, digitalization, and sustainability will be key to success. The market’s future potential is immense, presenting attractive prospects for both established players and new entrants.
Continuous Manufacturing Industry Segmentation
-
1. Product
- 1.1. Integrated Continuous Manufacturing
-
1.2. Semi Continous Manufacturing
- 1.2.1. Continuous Blenders
- 1.2.2. Continuous Granulators
- 1.2.3. Continuos Coaters
- 1.2.4. Continuous Compressors
- 1.2.5. Continuous Dryers
- 1.2.6. Other Semi-continuous Manufacturing Products
-
2. Application
- 2.1. API Manufacturing
- 2.2. End Product Manufacturing
-
3. End User
- 3.1. Contract Manufacturers
- 3.2. Pharmacuitical Companies
- 3.3. Other End Users
Continuous Manufacturing Industry Segmentation By Geography
-
1. North America
- 1.1. United States
- 1.2. Canada
- 1.3. Mexico
-
2. Europe
- 2.1. Germany
- 2.2. United Kingdom
- 2.3. France
- 2.4. Italy
- 2.5. Spain
- 2.6. Rest of Europe
-
3. Asia Pacific
- 3.1. China
- 3.2. Japan
- 3.3. India
- 3.4. Australia
- 3.5. South Korea
- 3.6. Rest of Asia Pacific
-
4. Middle East and Africa
- 4.1. GCC
- 4.2. South Africa
- 4.3. Rest of Middle East and Africa
-
5. South America
- 5.1. Brazil
- 5.2. Argentina
- 5.3. Rest of South America
Continuous Manufacturing Industry REPORT HIGHLIGHTS
| Aspects | Details |
|---|---|
| Study Period | 2019-2033 |
| Base Year | 2024 |
| Estimated Year | 2025 |
| Forecast Period | 2025-2033 |
| Historical Period | 2019-2024 |
| Growth Rate | CAGR of 12.80% from 2019-2033 |
| Segmentation |
|
Table of Contents
- 1. Introduction
- 1.1. Research Scope
- 1.2. Market Segmentation
- 1.3. Research Methodology
- 1.4. Definitions and Assumptions
- 2. Executive Summary
- 2.1. Introduction
- 3. Market Dynamics
- 3.1. Introduction
- 3.2. Market Drivers
- 3.2.1. Less Cost and Better Quality of Production; Support from Regulatory Authorities Around the World
- 3.3. Market Restrains
- 3.3.1. Lack of Regulatory and Technical Clarity; Slow adaptation and Rigidity Among the Industries
- 3.4. Market Trends
- 3.4.1. Integrated Continuous Manufacturing is Projected to Grow at Significant Rate Over the Forecast Period
- 4. Market Factor Analysis
- 4.1. Porters Five Forces
- 4.2. Supply/Value Chain
- 4.3. PESTEL analysis
- 4.4. Market Entropy
- 4.5. Patent/Trademark Analysis
- 5. Global Continuous Manufacturing Industry Analysis, Insights and Forecast, 2019-2031
- 5.1. Market Analysis, Insights and Forecast - by Product
- 5.1.1. Integrated Continuous Manufacturing
- 5.1.2. Semi Continous Manufacturing
- 5.1.2.1. Continuous Blenders
- 5.1.2.2. Continuous Granulators
- 5.1.2.3. Continuos Coaters
- 5.1.2.4. Continuous Compressors
- 5.1.2.5. Continuous Dryers
- 5.1.2.6. Other Semi-continuous Manufacturing Products
- 5.2. Market Analysis, Insights and Forecast - by Application
- 5.2.1. API Manufacturing
- 5.2.2. End Product Manufacturing
- 5.3. Market Analysis, Insights and Forecast - by End User
- 5.3.1. Contract Manufacturers
- 5.3.2. Pharmacuitical Companies
- 5.3.3. Other End Users
- 5.4. Market Analysis, Insights and Forecast - by Region
- 5.4.1. North America
- 5.4.2. Europe
- 5.4.3. Asia Pacific
- 5.4.4. Middle East and Africa
- 5.4.5. South America
- 5.1. Market Analysis, Insights and Forecast - by Product
- 6. North America Continuous Manufacturing Industry Analysis, Insights and Forecast, 2019-2031
- 6.1. Market Analysis, Insights and Forecast - by Product
- 6.1.1. Integrated Continuous Manufacturing
- 6.1.2. Semi Continous Manufacturing
- 6.1.2.1. Continuous Blenders
- 6.1.2.2. Continuous Granulators
- 6.1.2.3. Continuos Coaters
- 6.1.2.4. Continuous Compressors
- 6.1.2.5. Continuous Dryers
- 6.1.2.6. Other Semi-continuous Manufacturing Products
- 6.2. Market Analysis, Insights and Forecast - by Application
- 6.2.1. API Manufacturing
- 6.2.2. End Product Manufacturing
- 6.3. Market Analysis, Insights and Forecast - by End User
- 6.3.1. Contract Manufacturers
- 6.3.2. Pharmacuitical Companies
- 6.3.3. Other End Users
- 6.1. Market Analysis, Insights and Forecast - by Product
- 7. Europe Continuous Manufacturing Industry Analysis, Insights and Forecast, 2019-2031
- 7.1. Market Analysis, Insights and Forecast - by Product
- 7.1.1. Integrated Continuous Manufacturing
- 7.1.2. Semi Continous Manufacturing
- 7.1.2.1. Continuous Blenders
- 7.1.2.2. Continuous Granulators
- 7.1.2.3. Continuos Coaters
- 7.1.2.4. Continuous Compressors
- 7.1.2.5. Continuous Dryers
- 7.1.2.6. Other Semi-continuous Manufacturing Products
- 7.2. Market Analysis, Insights and Forecast - by Application
- 7.2.1. API Manufacturing
- 7.2.2. End Product Manufacturing
- 7.3. Market Analysis, Insights and Forecast - by End User
- 7.3.1. Contract Manufacturers
- 7.3.2. Pharmacuitical Companies
- 7.3.3. Other End Users
- 7.1. Market Analysis, Insights and Forecast - by Product
- 8. Asia Pacific Continuous Manufacturing Industry Analysis, Insights and Forecast, 2019-2031
- 8.1. Market Analysis, Insights and Forecast - by Product
- 8.1.1. Integrated Continuous Manufacturing
- 8.1.2. Semi Continous Manufacturing
- 8.1.2.1. Continuous Blenders
- 8.1.2.2. Continuous Granulators
- 8.1.2.3. Continuos Coaters
- 8.1.2.4. Continuous Compressors
- 8.1.2.5. Continuous Dryers
- 8.1.2.6. Other Semi-continuous Manufacturing Products
- 8.2. Market Analysis, Insights and Forecast - by Application
- 8.2.1. API Manufacturing
- 8.2.2. End Product Manufacturing
- 8.3. Market Analysis, Insights and Forecast - by End User
- 8.3.1. Contract Manufacturers
- 8.3.2. Pharmacuitical Companies
- 8.3.3. Other End Users
- 8.1. Market Analysis, Insights and Forecast - by Product
- 9. Middle East and Africa Continuous Manufacturing Industry Analysis, Insights and Forecast, 2019-2031
- 9.1. Market Analysis, Insights and Forecast - by Product
- 9.1.1. Integrated Continuous Manufacturing
- 9.1.2. Semi Continous Manufacturing
- 9.1.2.1. Continuous Blenders
- 9.1.2.2. Continuous Granulators
- 9.1.2.3. Continuos Coaters
- 9.1.2.4. Continuous Compressors
- 9.1.2.5. Continuous Dryers
- 9.1.2.6. Other Semi-continuous Manufacturing Products
- 9.2. Market Analysis, Insights and Forecast - by Application
- 9.2.1. API Manufacturing
- 9.2.2. End Product Manufacturing
- 9.3. Market Analysis, Insights and Forecast - by End User
- 9.3.1. Contract Manufacturers
- 9.3.2. Pharmacuitical Companies
- 9.3.3. Other End Users
- 9.1. Market Analysis, Insights and Forecast - by Product
- 10. South America Continuous Manufacturing Industry Analysis, Insights and Forecast, 2019-2031
- 10.1. Market Analysis, Insights and Forecast - by Product
- 10.1.1. Integrated Continuous Manufacturing
- 10.1.2. Semi Continous Manufacturing
- 10.1.2.1. Continuous Blenders
- 10.1.2.2. Continuous Granulators
- 10.1.2.3. Continuos Coaters
- 10.1.2.4. Continuous Compressors
- 10.1.2.5. Continuous Dryers
- 10.1.2.6. Other Semi-continuous Manufacturing Products
- 10.2. Market Analysis, Insights and Forecast - by Application
- 10.2.1. API Manufacturing
- 10.2.2. End Product Manufacturing
- 10.3. Market Analysis, Insights and Forecast - by End User
- 10.3.1. Contract Manufacturers
- 10.3.2. Pharmacuitical Companies
- 10.3.3. Other End Users
- 10.1. Market Analysis, Insights and Forecast - by Product
- 11. North America Continuous Manufacturing Industry Analysis, Insights and Forecast, 2019-2031
- 11.1. Market Analysis, Insights and Forecast - By Country/Sub-region
- 11.1.1 United States
- 11.1.2 Canada
- 11.1.3 Mexico
- 12. Europe Continuous Manufacturing Industry Analysis, Insights and Forecast, 2019-2031
- 12.1. Market Analysis, Insights and Forecast - By Country/Sub-region
- 12.1.1 Germany
- 12.1.2 United Kingdom
- 12.1.3 France
- 12.1.4 Italy
- 12.1.5 Spain
- 12.1.6 Rest of Europe
- 13. Asia Pacific Continuous Manufacturing Industry Analysis, Insights and Forecast, 2019-2031
- 13.1. Market Analysis, Insights and Forecast - By Country/Sub-region
- 13.1.1 China
- 13.1.2 Japan
- 13.1.3 India
- 13.1.4 Australia
- 13.1.5 South Korea
- 13.1.6 Rest of Asia Pacific
- 14. Middle East and Africa Continuous Manufacturing Industry Analysis, Insights and Forecast, 2019-2031
- 14.1. Market Analysis, Insights and Forecast - By Country/Sub-region
- 14.1.1 GCC
- 14.1.2 South Africa
- 14.1.3 Rest of Middle East and Africa
- 15. South America Continuous Manufacturing Industry Analysis, Insights and Forecast, 2019-2031
- 15.1. Market Analysis, Insights and Forecast - By Country/Sub-region
- 15.1.1 Brazil
- 15.1.2 Argentina
- 15.1.3 Rest of South America
- 16. Competitive Analysis
- 16.1. Global Market Share Analysis 2024
- 16.2. Company Profiles
- 16.2.1 Coperion GmbH
- 16.2.1.1. Overview
- 16.2.1.2. Products
- 16.2.1.3. SWOT Analysis
- 16.2.1.4. Recent Developments
- 16.2.1.5. Financials (Based on Availability)
- 16.2.2 Scott Equipment Company
- 16.2.2.1. Overview
- 16.2.2.2. Products
- 16.2.2.3. SWOT Analysis
- 16.2.2.4. Recent Developments
- 16.2.2.5. Financials (Based on Availability)
- 16.2.3 Siemens Healthineers
- 16.2.3.1. Overview
- 16.2.3.2. Products
- 16.2.3.3. SWOT Analysis
- 16.2.3.4. Recent Developments
- 16.2.3.5. Financials (Based on Availability)
- 16.2.4 Munson Machinery Co Inc
- 16.2.4.1. Overview
- 16.2.4.2. Products
- 16.2.4.3. SWOT Analysis
- 16.2.4.4. Recent Developments
- 16.2.4.5. Financials (Based on Availability)
- 16.2.5 Sturtevant Inc
- 16.2.5.1. Overview
- 16.2.5.2. Products
- 16.2.5.3. SWOT Analysis
- 16.2.5.4. Recent Developments
- 16.2.5.5. Financials (Based on Availability)
- 16.2.6 GEA Group AG
- 16.2.6.1. Overview
- 16.2.6.2. Products
- 16.2.6.3. SWOT Analysis
- 16.2.6.4. Recent Developments
- 16.2.6.5. Financials (Based on Availability)
- 16.2.7 L B Bohle
- 16.2.7.1. Overview
- 16.2.7.2. Products
- 16.2.7.3. SWOT Analysis
- 16.2.7.4. Recent Developments
- 16.2.7.5. Financials (Based on Availability)
- 16.2.8 Robert Bosch GmbH
- 16.2.8.1. Overview
- 16.2.8.2. Products
- 16.2.8.3. SWOT Analysis
- 16.2.8.4. Recent Developments
- 16.2.8.5. Financials (Based on Availability)
- 16.2.9 Glatt GmbH
- 16.2.9.1. Overview
- 16.2.9.2. Products
- 16.2.9.3. SWOT Analysis
- 16.2.9.4. Recent Developments
- 16.2.9.5. Financials (Based on Availability)
- 16.2.10 Thermo Fisher Scientific
- 16.2.10.1. Overview
- 16.2.10.2. Products
- 16.2.10.3. SWOT Analysis
- 16.2.10.4. Recent Developments
- 16.2.10.5. Financials (Based on Availability)
- 16.2.11 HOSOKAWA MICRON CORP
- 16.2.11.1. Overview
- 16.2.11.2. Products
- 16.2.11.3. SWOT Analysis
- 16.2.11.4. Recent Developments
- 16.2.11.5. Financials (Based on Availability)
- 16.2.1 Coperion GmbH
List of Figures
- Figure 1: Global Continuous Manufacturing Industry Revenue Breakdown (Million, %) by Region 2024 & 2032
- Figure 2: North America Continuous Manufacturing Industry Revenue (Million), by Country 2024 & 2032
- Figure 3: North America Continuous Manufacturing Industry Revenue Share (%), by Country 2024 & 2032
- Figure 4: Europe Continuous Manufacturing Industry Revenue (Million), by Country 2024 & 2032
- Figure 5: Europe Continuous Manufacturing Industry Revenue Share (%), by Country 2024 & 2032
- Figure 6: Asia Pacific Continuous Manufacturing Industry Revenue (Million), by Country 2024 & 2032
- Figure 7: Asia Pacific Continuous Manufacturing Industry Revenue Share (%), by Country 2024 & 2032
- Figure 8: Middle East and Africa Continuous Manufacturing Industry Revenue (Million), by Country 2024 & 2032
- Figure 9: Middle East and Africa Continuous Manufacturing Industry Revenue Share (%), by Country 2024 & 2032
- Figure 10: South America Continuous Manufacturing Industry Revenue (Million), by Country 2024 & 2032
- Figure 11: South America Continuous Manufacturing Industry Revenue Share (%), by Country 2024 & 2032
- Figure 12: North America Continuous Manufacturing Industry Revenue (Million), by Product 2024 & 2032
- Figure 13: North America Continuous Manufacturing Industry Revenue Share (%), by Product 2024 & 2032
- Figure 14: North America Continuous Manufacturing Industry Revenue (Million), by Application 2024 & 2032
- Figure 15: North America Continuous Manufacturing Industry Revenue Share (%), by Application 2024 & 2032
- Figure 16: North America Continuous Manufacturing Industry Revenue (Million), by End User 2024 & 2032
- Figure 17: North America Continuous Manufacturing Industry Revenue Share (%), by End User 2024 & 2032
- Figure 18: North America Continuous Manufacturing Industry Revenue (Million), by Country 2024 & 2032
- Figure 19: North America Continuous Manufacturing Industry Revenue Share (%), by Country 2024 & 2032
- Figure 20: Europe Continuous Manufacturing Industry Revenue (Million), by Product 2024 & 2032
- Figure 21: Europe Continuous Manufacturing Industry Revenue Share (%), by Product 2024 & 2032
- Figure 22: Europe Continuous Manufacturing Industry Revenue (Million), by Application 2024 & 2032
- Figure 23: Europe Continuous Manufacturing Industry Revenue Share (%), by Application 2024 & 2032
- Figure 24: Europe Continuous Manufacturing Industry Revenue (Million), by End User 2024 & 2032
- Figure 25: Europe Continuous Manufacturing Industry Revenue Share (%), by End User 2024 & 2032
- Figure 26: Europe Continuous Manufacturing Industry Revenue (Million), by Country 2024 & 2032
- Figure 27: Europe Continuous Manufacturing Industry Revenue Share (%), by Country 2024 & 2032
- Figure 28: Asia Pacific Continuous Manufacturing Industry Revenue (Million), by Product 2024 & 2032
- Figure 29: Asia Pacific Continuous Manufacturing Industry Revenue Share (%), by Product 2024 & 2032
- Figure 30: Asia Pacific Continuous Manufacturing Industry Revenue (Million), by Application 2024 & 2032
- Figure 31: Asia Pacific Continuous Manufacturing Industry Revenue Share (%), by Application 2024 & 2032
- Figure 32: Asia Pacific Continuous Manufacturing Industry Revenue (Million), by End User 2024 & 2032
- Figure 33: Asia Pacific Continuous Manufacturing Industry Revenue Share (%), by End User 2024 & 2032
- Figure 34: Asia Pacific Continuous Manufacturing Industry Revenue (Million), by Country 2024 & 2032
- Figure 35: Asia Pacific Continuous Manufacturing Industry Revenue Share (%), by Country 2024 & 2032
- Figure 36: Middle East and Africa Continuous Manufacturing Industry Revenue (Million), by Product 2024 & 2032
- Figure 37: Middle East and Africa Continuous Manufacturing Industry Revenue Share (%), by Product 2024 & 2032
- Figure 38: Middle East and Africa Continuous Manufacturing Industry Revenue (Million), by Application 2024 & 2032
- Figure 39: Middle East and Africa Continuous Manufacturing Industry Revenue Share (%), by Application 2024 & 2032
- Figure 40: Middle East and Africa Continuous Manufacturing Industry Revenue (Million), by End User 2024 & 2032
- Figure 41: Middle East and Africa Continuous Manufacturing Industry Revenue Share (%), by End User 2024 & 2032
- Figure 42: Middle East and Africa Continuous Manufacturing Industry Revenue (Million), by Country 2024 & 2032
- Figure 43: Middle East and Africa Continuous Manufacturing Industry Revenue Share (%), by Country 2024 & 2032
- Figure 44: South America Continuous Manufacturing Industry Revenue (Million), by Product 2024 & 2032
- Figure 45: South America Continuous Manufacturing Industry Revenue Share (%), by Product 2024 & 2032
- Figure 46: South America Continuous Manufacturing Industry Revenue (Million), by Application 2024 & 2032
- Figure 47: South America Continuous Manufacturing Industry Revenue Share (%), by Application 2024 & 2032
- Figure 48: South America Continuous Manufacturing Industry Revenue (Million), by End User 2024 & 2032
- Figure 49: South America Continuous Manufacturing Industry Revenue Share (%), by End User 2024 & 2032
- Figure 50: South America Continuous Manufacturing Industry Revenue (Million), by Country 2024 & 2032
- Figure 51: South America Continuous Manufacturing Industry Revenue Share (%), by Country 2024 & 2032
List of Tables
- Table 1: Global Continuous Manufacturing Industry Revenue Million Forecast, by Region 2019 & 2032
- Table 2: Global Continuous Manufacturing Industry Revenue Million Forecast, by Product 2019 & 2032
- Table 3: Global Continuous Manufacturing Industry Revenue Million Forecast, by Application 2019 & 2032
- Table 4: Global Continuous Manufacturing Industry Revenue Million Forecast, by End User 2019 & 2032
- Table 5: Global Continuous Manufacturing Industry Revenue Million Forecast, by Region 2019 & 2032
- Table 6: Global Continuous Manufacturing Industry Revenue Million Forecast, by Country 2019 & 2032
- Table 7: United States Continuous Manufacturing Industry Revenue (Million) Forecast, by Application 2019 & 2032
- Table 8: Canada Continuous Manufacturing Industry Revenue (Million) Forecast, by Application 2019 & 2032
- Table 9: Mexico Continuous Manufacturing Industry Revenue (Million) Forecast, by Application 2019 & 2032
- Table 10: Global Continuous Manufacturing Industry Revenue Million Forecast, by Country 2019 & 2032
- Table 11: Germany Continuous Manufacturing Industry Revenue (Million) Forecast, by Application 2019 & 2032
- Table 12: United Kingdom Continuous Manufacturing Industry Revenue (Million) Forecast, by Application 2019 & 2032
- Table 13: France Continuous Manufacturing Industry Revenue (Million) Forecast, by Application 2019 & 2032
- Table 14: Italy Continuous Manufacturing Industry Revenue (Million) Forecast, by Application 2019 & 2032
- Table 15: Spain Continuous Manufacturing Industry Revenue (Million) Forecast, by Application 2019 & 2032
- Table 16: Rest of Europe Continuous Manufacturing Industry Revenue (Million) Forecast, by Application 2019 & 2032
- Table 17: Global Continuous Manufacturing Industry Revenue Million Forecast, by Country 2019 & 2032
- Table 18: China Continuous Manufacturing Industry Revenue (Million) Forecast, by Application 2019 & 2032
- Table 19: Japan Continuous Manufacturing Industry Revenue (Million) Forecast, by Application 2019 & 2032
- Table 20: India Continuous Manufacturing Industry Revenue (Million) Forecast, by Application 2019 & 2032
- Table 21: Australia Continuous Manufacturing Industry Revenue (Million) Forecast, by Application 2019 & 2032
- Table 22: South Korea Continuous Manufacturing Industry Revenue (Million) Forecast, by Application 2019 & 2032
- Table 23: Rest of Asia Pacific Continuous Manufacturing Industry Revenue (Million) Forecast, by Application 2019 & 2032
- Table 24: Global Continuous Manufacturing Industry Revenue Million Forecast, by Country 2019 & 2032
- Table 25: GCC Continuous Manufacturing Industry Revenue (Million) Forecast, by Application 2019 & 2032
- Table 26: South Africa Continuous Manufacturing Industry Revenue (Million) Forecast, by Application 2019 & 2032
- Table 27: Rest of Middle East and Africa Continuous Manufacturing Industry Revenue (Million) Forecast, by Application 2019 & 2032
- Table 28: Global Continuous Manufacturing Industry Revenue Million Forecast, by Country 2019 & 2032
- Table 29: Brazil Continuous Manufacturing Industry Revenue (Million) Forecast, by Application 2019 & 2032
- Table 30: Argentina Continuous Manufacturing Industry Revenue (Million) Forecast, by Application 2019 & 2032
- Table 31: Rest of South America Continuous Manufacturing Industry Revenue (Million) Forecast, by Application 2019 & 2032
- Table 32: Global Continuous Manufacturing Industry Revenue Million Forecast, by Product 2019 & 2032
- Table 33: Global Continuous Manufacturing Industry Revenue Million Forecast, by Application 2019 & 2032
- Table 34: Global Continuous Manufacturing Industry Revenue Million Forecast, by End User 2019 & 2032
- Table 35: Global Continuous Manufacturing Industry Revenue Million Forecast, by Country 2019 & 2032
- Table 36: United States Continuous Manufacturing Industry Revenue (Million) Forecast, by Application 2019 & 2032
- Table 37: Canada Continuous Manufacturing Industry Revenue (Million) Forecast, by Application 2019 & 2032
- Table 38: Mexico Continuous Manufacturing Industry Revenue (Million) Forecast, by Application 2019 & 2032
- Table 39: Global Continuous Manufacturing Industry Revenue Million Forecast, by Product 2019 & 2032
- Table 40: Global Continuous Manufacturing Industry Revenue Million Forecast, by Application 2019 & 2032
- Table 41: Global Continuous Manufacturing Industry Revenue Million Forecast, by End User 2019 & 2032
- Table 42: Global Continuous Manufacturing Industry Revenue Million Forecast, by Country 2019 & 2032
- Table 43: Germany Continuous Manufacturing Industry Revenue (Million) Forecast, by Application 2019 & 2032
- Table 44: United Kingdom Continuous Manufacturing Industry Revenue (Million) Forecast, by Application 2019 & 2032
- Table 45: France Continuous Manufacturing Industry Revenue (Million) Forecast, by Application 2019 & 2032
- Table 46: Italy Continuous Manufacturing Industry Revenue (Million) Forecast, by Application 2019 & 2032
- Table 47: Spain Continuous Manufacturing Industry Revenue (Million) Forecast, by Application 2019 & 2032
- Table 48: Rest of Europe Continuous Manufacturing Industry Revenue (Million) Forecast, by Application 2019 & 2032
- Table 49: Global Continuous Manufacturing Industry Revenue Million Forecast, by Product 2019 & 2032
- Table 50: Global Continuous Manufacturing Industry Revenue Million Forecast, by Application 2019 & 2032
- Table 51: Global Continuous Manufacturing Industry Revenue Million Forecast, by End User 2019 & 2032
- Table 52: Global Continuous Manufacturing Industry Revenue Million Forecast, by Country 2019 & 2032
- Table 53: China Continuous Manufacturing Industry Revenue (Million) Forecast, by Application 2019 & 2032
- Table 54: Japan Continuous Manufacturing Industry Revenue (Million) Forecast, by Application 2019 & 2032
- Table 55: India Continuous Manufacturing Industry Revenue (Million) Forecast, by Application 2019 & 2032
- Table 56: Australia Continuous Manufacturing Industry Revenue (Million) Forecast, by Application 2019 & 2032
- Table 57: South Korea Continuous Manufacturing Industry Revenue (Million) Forecast, by Application 2019 & 2032
- Table 58: Rest of Asia Pacific Continuous Manufacturing Industry Revenue (Million) Forecast, by Application 2019 & 2032
- Table 59: Global Continuous Manufacturing Industry Revenue Million Forecast, by Product 2019 & 2032
- Table 60: Global Continuous Manufacturing Industry Revenue Million Forecast, by Application 2019 & 2032
- Table 61: Global Continuous Manufacturing Industry Revenue Million Forecast, by End User 2019 & 2032
- Table 62: Global Continuous Manufacturing Industry Revenue Million Forecast, by Country 2019 & 2032
- Table 63: GCC Continuous Manufacturing Industry Revenue (Million) Forecast, by Application 2019 & 2032
- Table 64: South Africa Continuous Manufacturing Industry Revenue (Million) Forecast, by Application 2019 & 2032
- Table 65: Rest of Middle East and Africa Continuous Manufacturing Industry Revenue (Million) Forecast, by Application 2019 & 2032
- Table 66: Global Continuous Manufacturing Industry Revenue Million Forecast, by Product 2019 & 2032
- Table 67: Global Continuous Manufacturing Industry Revenue Million Forecast, by Application 2019 & 2032
- Table 68: Global Continuous Manufacturing Industry Revenue Million Forecast, by End User 2019 & 2032
- Table 69: Global Continuous Manufacturing Industry Revenue Million Forecast, by Country 2019 & 2032
- Table 70: Brazil Continuous Manufacturing Industry Revenue (Million) Forecast, by Application 2019 & 2032
- Table 71: Argentina Continuous Manufacturing Industry Revenue (Million) Forecast, by Application 2019 & 2032
- Table 72: Rest of South America Continuous Manufacturing Industry Revenue (Million) Forecast, by Application 2019 & 2032
Frequently Asked Questions
1. What is the projected Compound Annual Growth Rate (CAGR) of the Continuous Manufacturing Industry?
The projected CAGR is approximately 12.80%.
2. Which companies are prominent players in the Continuous Manufacturing Industry?
Key companies in the market include Coperion GmbH, Scott Equipment Company, Siemens Healthineers, Munson Machinery Co Inc, Sturtevant Inc, GEA Group AG, L B Bohle, Robert Bosch GmbH, Glatt GmbH, Thermo Fisher Scientific, HOSOKAWA MICRON CORP.
3. What are the main segments of the Continuous Manufacturing Industry?
The market segments include Product, Application, End User.
4. Can you provide details about the market size?
The market size is estimated to be USD XX Million as of 2022.
5. What are some drivers contributing to market growth?
Less Cost and Better Quality of Production; Support from Regulatory Authorities Around the World.
6. What are the notable trends driving market growth?
Integrated Continuous Manufacturing is Projected to Grow at Significant Rate Over the Forecast Period.
7. Are there any restraints impacting market growth?
Lack of Regulatory and Technical Clarity; Slow adaptation and Rigidity Among the Industries.
8. Can you provide examples of recent developments in the market?
In March 2022, Phlow Corp, a United States essential medicines public benefit company entered alliances with both Virginia Commonwealth University (VCU) Medicines for All institute and AMPAC fine chemicals to provide contract continuous manufacturing research and development services for small molecule pharmaceutical products.
9. What pricing options are available for accessing the report?
Pricing options include single-user, multi-user, and enterprise licenses priced at USD 4750, USD 5250, and USD 8750 respectively.
10. Is the market size provided in terms of value or volume?
The market size is provided in terms of value, measured in Million.
11. Are there any specific market keywords associated with the report?
Yes, the market keyword associated with the report is "Continuous Manufacturing Industry," which aids in identifying and referencing the specific market segment covered.
12. How do I determine which pricing option suits my needs best?
The pricing options vary based on user requirements and access needs. Individual users may opt for single-user licenses, while businesses requiring broader access may choose multi-user or enterprise licenses for cost-effective access to the report.
13. Are there any additional resources or data provided in the Continuous Manufacturing Industry report?
While the report offers comprehensive insights, it's advisable to review the specific contents or supplementary materials provided to ascertain if additional resources or data are available.
14. How can I stay updated on further developments or reports in the Continuous Manufacturing Industry?
To stay informed about further developments, trends, and reports in the Continuous Manufacturing Industry, consider subscribing to industry newsletters, following relevant companies and organizations, or regularly checking reputable industry news sources and publications.
Methodology
Step 1 - Identification of Relevant Samples Size from Population Database


Step 2 - Approaches for Defining Global Market Size (Value, Volume* & Price*)

Note*: In applicable scenarios
Step 3 - Data Sources
Primary Research
- Web Analytics
- Survey Reports
- Research Institute
- Latest Research Reports
- Opinion Leaders
Secondary Research
- Annual Reports
- White Paper
- Latest Press Release
- Industry Association
- Paid Database
- Investor Presentations

Step 4 - Data Triangulation
Involves using different sources of information in order to increase the validity of a study
These sources are likely to be stakeholders in a program - participants, other researchers, program staff, other community members, and so on.
Then we put all data in single framework & apply various statistical tools to find out the dynamic on the market.
During the analysis stage, feedback from the stakeholder groups would be compared to determine areas of agreement as well as areas of divergence


