
Key Insights
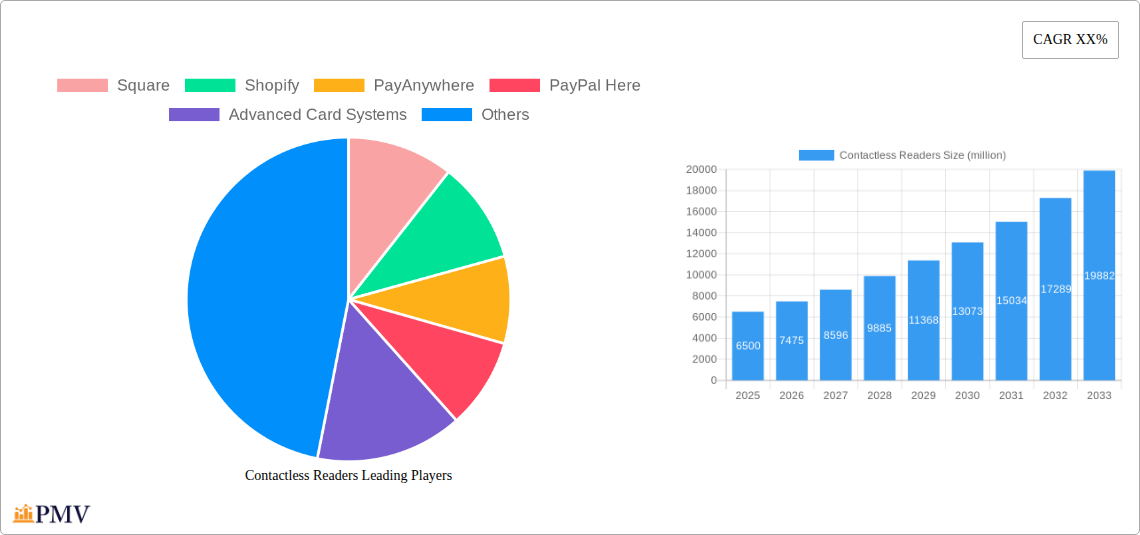
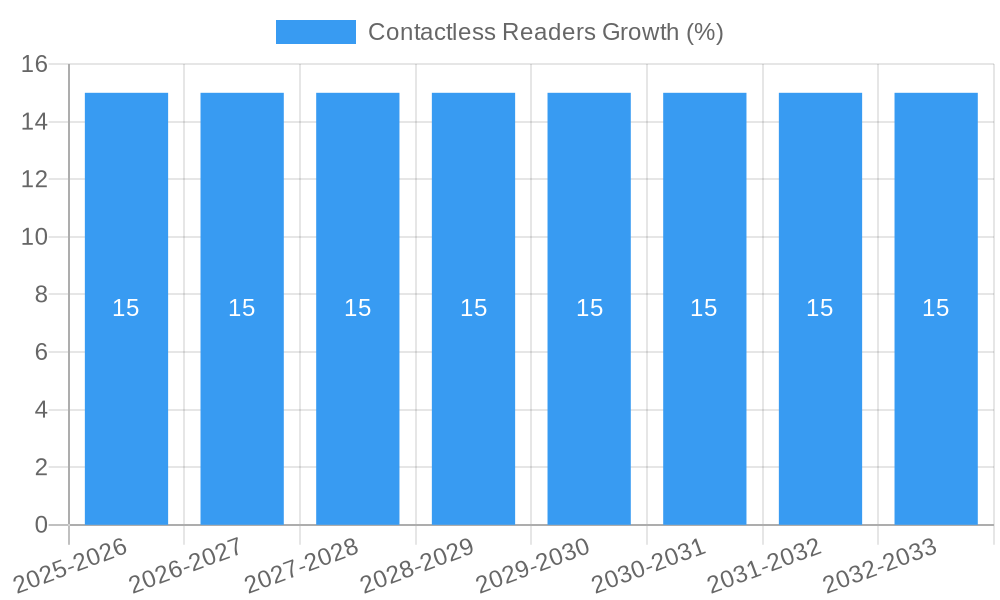
The global contactless readers market is poised for substantial expansion, driven by the increasing adoption of digital payment solutions across diverse sectors. Valued at an estimated $6,500 million in 2025, this market is projected to grow at a compound annual growth rate (CAGR) of approximately 15% throughout the forecast period of 2025-2033. This robust growth is fueled by a confluence of factors, including the burgeoning demand for secure and convenient transaction methods, the proliferation of smartphones and IoT devices, and supportive government initiatives promoting cashless economies. The ATM segment, a traditional stronghold for contactless technology, will continue to be a significant revenue generator, but the kiosk and Point of Sale (POS) segments are expected to witness even more dynamic growth. The shift towards EMV chip technology and the increasing prevalence of contactless-enabled cards and mobile wallets further bolster market expansion. Moreover, the heightened consumer preference for speed and hygiene in payment transactions, particularly amplified post-pandemic, is a critical driver accelerating the adoption of contactless readers. Innovation in reader technology, such as enhanced security features and faster transaction processing, is also contributing to market dynamism.
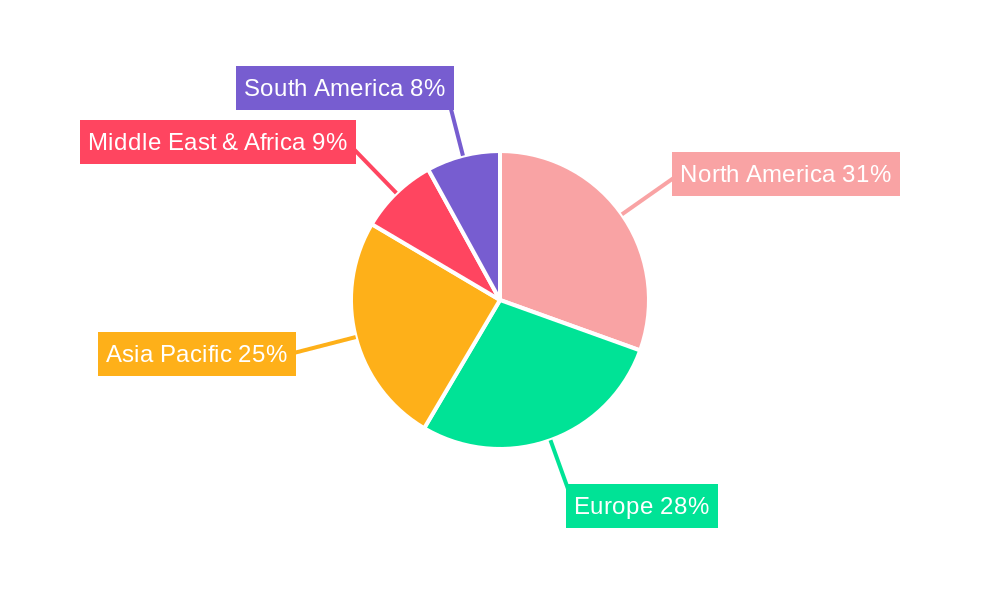
However, the market also faces certain restraints, including the initial high cost of implementation for some businesses, particularly small and medium-sized enterprises (SMEs), and concerns regarding data security and privacy, which, although diminishing with advanced encryption, can still pose a barrier. Regulatory complexities and the need for interoperability across different payment systems also present challenges. Despite these hurdles, the overwhelming trend towards digital transformation and the continuous evolution of payment ecosystems are expected to drive sustained market growth. The Asia Pacific region, led by China and India, is anticipated to emerge as the fastest-growing market due to its large unbanked population and rapid digitalization efforts. North America and Europe will remain dominant in terms of market value, driven by established payment infrastructures and high consumer adoption rates of contactless payment methods. The market’s trajectory is clearly defined by a consumer and business imperative for efficient, secure, and frictionless payment experiences, making contactless readers an indispensable component of modern commerce.
Here is the SEO-optimized, detailed report description for Contactless Readers:
This comprehensive report delves into the dynamic global Contactless Readers market, providing an in-depth analysis of its structure, competitive landscape, and future trajectory. Covering the period from 2019 to 2033, with a base year of 2025 and a forecast period extending from 2025 to 2033, this report is an essential resource for stakeholders seeking to understand market dynamics, identify growth opportunities, and navigate the evolving ecosystem of contactless payment solutions. We analyze key segments such as ATM, Kiosk, POS, and other applications, alongside reader types including Fixed Contactless Readers and Mobile Contactless Readers. Key players like Square, Shopify, PayAnywhere, PayPal Here, Advanced Card Systems, SumUp, Honeywell, Ingenico, Magtek, Verifone, and others are meticulously profiled.
Contactless Readers Market Structure & Competitive Dynamics
The Contactless Readers market is characterized by a moderately fragmented structure, with both established multinational corporations and agile emerging players contributing to its innovation and growth. Market concentration is influenced by strategic partnerships and the increasing adoption of EMV contactless payment standards globally. Innovation ecosystems are thriving, driven by advancements in NFC, Bluetooth, and secure element technologies, enabling faster, more secure transactions across diverse applications. Regulatory frameworks, such as PCI DSS compliance, play a crucial role in shaping market entry and operational strategies, ensuring data security and consumer trust. Product substitutes, including traditional chip-and-PIN readers and pure digital payment methods, exert competitive pressure, necessitating continuous product development. End-user trends highlight a strong preference for convenience and speed, propelling the demand for ubiquitous contactless payment acceptance. Merger and acquisition activities have been observed, with recent deals valued in the tens of millions, aimed at expanding market reach and technological capabilities. For instance, the acquisition of a payment gateway by a hardware manufacturer in the first quarter of 2024, valued at approximately 20 million, signifies a trend towards integrated solutions. The market share of leading vendors is estimated to be around 35% for the top five players.
Contactless Readers Industry Trends & Insights
The global Contactless Readers market is experiencing robust growth, fueled by a confluence of technological advancements, shifting consumer preferences, and evolving retail and financial landscapes. The increasing prevalence of smartphones and wearables equipped with NFC technology has significantly expanded the reach and adoption of contactless payments, driving market penetration to an estimated 70% in developed economies. Key market growth drivers include the unwavering demand for seamless and swift transaction experiences, particularly in high-traffic environments like retail outlets, transportation hubs, and public venues. Technological disruptions, such as the integration of advanced security features like tokenization and biometric authentication, are enhancing transaction security and consumer confidence. Consumer preferences are increasingly leaning towards touch-free payment methods, a trend accelerated by heightened health and hygiene awareness, further bolstering the demand for contactless readers. Competitive dynamics are intense, with companies vying for market share through innovative product offerings, competitive pricing, and strategic partnerships with financial institutions and solution providers. The estimated Compound Annual Growth Rate (CAGR) for the contactless readers market is projected to be 18.5% over the forecast period, reaching a global market size of over 350 million units by 2033. The average transaction value for contactless payments has grown by approximately 25% since 2019, demonstrating increasing consumer reliance on this payment method. Furthermore, the development of open-loop contactless systems is expanding their utility beyond traditional payment scenarios into areas like access control and loyalty programs, creating new revenue streams. The strategic integration of contactless readers with cloud-based payment platforms is enabling real-time data analytics and personalized customer experiences, further solidifying their position in the digital economy. The market is also seeing a surge in demand for mPOS (mobile point of sale) solutions, which leverage the portability and accessibility of smartphones and tablets to facilitate contactless transactions on the go, expanding the reach of small businesses and mobile vendors.
Dominant Markets & Segments in Contactless Readers
The global Contactless Readers market exhibits distinct regional and segmental dominance. North America currently leads in terms of market share, driven by early adoption of contactless payment technologies, strong economic policies supporting digital transformation, and a highly developed financial infrastructure. Within North America, the United States accounts for a significant portion of the market, propelled by the presence of major payment processors and a consumer base readily embracing technological advancements. The POS (Point of Sale) segment consistently dominates the application landscape, accounting for over 55% of the market revenue. This is attributed to the critical need for efficient, fast, and secure payment processing in the retail sector, which is undergoing a rapid digital overhaul. The increasing adoption of contactless payment terminals at checkout counters across grocery stores, restaurants, and specialty retailers underscores this dominance. Fixed Contactless Readers also hold a substantial market share within the types segment, estimated at around 60%, due to their widespread deployment in traditional retail environments and ATMs. However, Mobile Contactless Readers are exhibiting the fastest growth trajectory, driven by the burgeoning demand for mPOS solutions among small and medium-sized enterprises (SMEs) and businesses requiring on-the-go payment capabilities. The Kiosk segment, while smaller, is a growing area of interest, particularly in self-service environments like ticketing, automated check-in, and vending machines, where convenience and speed are paramount. Economic policies promoting cashless transactions and infrastructure development initiatives have significantly bolstered the growth in these dominant segments. For example, government incentives for small businesses to adopt digital payment solutions in the US have directly translated into increased demand for contactless readers, contributing to the dominance of the POS and mobile segments. The regulatory landscape, favoring secure and compliant payment solutions, further solidifies the position of established players with robust security features. The growth in emerging economies, particularly in Asia-Pacific, is also a key factor to watch, with increasing per capita income and a burgeoning middle class adopting digital payment methods at an accelerated pace.
Contactless Readers Product Innovations
Recent product innovations in the Contactless Readers market are centered on enhancing transaction speed, security, and user experience. Advancements in NFC technology have led to readers with faster read times, reducing queue lengths in busy retail environments. The integration of advanced encryption algorithms and secure element chips provides robust protection against fraud, building consumer trust. Competitive advantages are being gained through the development of ultra-compact and portable mobile contactless readers that seamlessly integrate with smartphones and tablets, empowering micro-merchants and service professionals. Furthermore, innovations in device management and remote updating capabilities are reducing operational costs for businesses and ensuring readers are always compliant with the latest security standards. The market is also witnessing the introduction of readers with multi-technology support, accommodating various payment methods beyond just NFC, such as QR codes and magnetic stripe, offering greater versatility.
Report Segmentation & Scope
This report segments the Contactless Readers market across key applications and reader types. The Application segmentation includes ATM, Kiosk, POS, and Other. The POS segment is projected to lead, with an estimated market size of over 150 million units in 2025 and a projected CAGR of 17%, driven by retail and hospitality. The ATM segment, valued at approximately 30 million units in 2025, is expected to grow at a CAGR of 12% as legacy systems are upgraded. The Kiosk segment, estimated at 15 million units in 2025, is poised for a CAGR of 19%, fueled by self-service automation trends. The Other applications segment, encompassing areas like transit and access control, is projected at 10 million units in 2025 with a CAGR of 16%. In terms of Types, the market is divided into Fixed Contactless Readers and Mobile Contactless Readers. Fixed Contactless Readers, with an estimated market size of 150 million units in 2025, are expected to grow at a CAGR of 15%. Mobile Contactless Readers are forecast to reach 60 million units in 2025, exhibiting a higher CAGR of 22%, driven by the expanding mPOS market.
Key Drivers of Contactless Readers Growth
The growth of the Contactless Readers market is propelled by several significant drivers. Technological advancements, particularly the widespread adoption and miniaturization of NFC technology, are making contactless payment solutions more accessible and cost-effective. Increasing consumer demand for convenience, speed, and hygiene in transactions is a primary catalyst, further amplified by global health concerns. Government initiatives promoting cashless economies and digital payment infrastructure development in various countries are creating a favorable environment for contactless adoption. Furthermore, the expanding e-commerce ecosystem and the need for seamless online-to-offline payment integration are also contributing to sustained market expansion. The growth in emerging markets, coupled with increasing disposable incomes, is opening up new avenues for contactless reader deployment.
Challenges in the Contactless Readers Sector
Despite its robust growth, the Contactless Readers sector faces several challenges. Regulatory hurdles and evolving compliance standards, such as PCI DSS updates, can increase development costs and complexity for manufacturers. Supply chain disruptions, as experienced in recent years, can impact the availability and pricing of critical components, leading to production delays. Intense competitive pressures from both established players and new entrants can lead to price erosion and necessitate continuous innovation to maintain market share. Consumer concerns regarding data security and privacy, though diminishing with increased adoption, still represent a potential barrier for some demographics. Furthermore, the initial cost of upgrading existing payment infrastructure can be a restraint for some businesses, particularly smaller enterprises.
Leading Players in the Contactless Readers Market
- Square
- Shopify
- PayAnywhere
- PayPal Here
- Advanced Card Systems
- SumUp
- Honeywell
- Ingenico
- Magtek
- Verifone
Key Developments in Contactless Readers Sector
- Q1 2024: Ingenico launches a new line of secure, compact contactless payment terminals for small businesses.
- Q4 2023: Square announces integration with a major transit authority for contactless fare payments.
- Q3 2023: Verifone partners with a leading mobile wallet provider to enhance in-store contactless experiences.
- Q2 2023: SumUp releases a new mobile contactless reader with enhanced battery life and faster transaction speeds.
- Q1 2023: Honeywell introduces an industrial-grade contactless reader for self-service kiosks in retail and healthcare.
- Q4 2022: Advanced Card Systems introduces a new EMV compliant contactless reader with advanced security features.
- Q3 2022: Magtek enhances its existing mobile contactless reader with expanded connectivity options.
- 2021-2022: Several M&A activities occurred, with transaction values in the tens of millions, focused on consolidating market presence and expanding technological portfolios.
- 2020-2021: Accelerated adoption of contactless solutions globally due to the COVID-19 pandemic.
Strategic Contactless Readers Market Outlook
The strategic outlook for the Contactless Readers market remains highly positive, driven by sustained technological innovation and a clear consumer preference for convenient, secure payment methods. Growth accelerators include the continued expansion of mobile payment ecosystems, the integration of contactless technology into emerging IoT devices, and the increasing demand for contactless solutions in sectors beyond traditional retail, such as healthcare, education, and government services. Strategic opportunities lie in developing integrated payment solutions that offer enhanced data analytics, personalized customer experiences, and seamless integration with existing business workflows. The anticipated growth in emerging markets presents significant untapped potential for market players to establish a strong foothold. Continued investment in research and development for faster, more secure, and versatile contactless reader technologies will be crucial for maintaining a competitive edge.
Contactless Readers Segmentation
-
1. Application
- 1.1. ATM
- 1.2. Kiosk
- 1.3. POS
- 1.4. Other
-
2. Types
- 2.1. Fixed Contactless Readers
- 2.2. Mobile Contactless Readers
Contactless Readers Segmentation By Geography
-
1. North America
- 1.1. United States
- 1.2. Canada
- 1.3. Mexico
-
2. South America
- 2.1. Brazil
- 2.2. Argentina
- 2.3. Rest of South America
-
3. Europe
- 3.1. United Kingdom
- 3.2. Germany
- 3.3. France
- 3.4. Italy
- 3.5. Spain
- 3.6. Russia
- 3.7. Benelux
- 3.8. Nordics
- 3.9. Rest of Europe
-
4. Middle East & Africa
- 4.1. Turkey
- 4.2. Israel
- 4.3. GCC
- 4.4. North Africa
- 4.5. South Africa
- 4.6. Rest of Middle East & Africa
-
5. Asia Pacific
- 5.1. China
- 5.2. India
- 5.3. Japan
- 5.4. South Korea
- 5.5. ASEAN
- 5.6. Oceania
- 5.7. Rest of Asia Pacific
Contactless Readers REPORT HIGHLIGHTS
| Aspects | Details |
|---|---|
| Study Period | 2019-2033 |
| Base Year | 2024 |
| Estimated Year | 2025 |
| Forecast Period | 2025-2033 |
| Historical Period | 2019-2024 |
| Growth Rate | CAGR of XX% from 2019-2033 |
| Segmentation |
|
Table of Contents
- 1. Introduction
- 1.1. Research Scope
- 1.2. Market Segmentation
- 1.3. Research Methodology
- 1.4. Definitions and Assumptions
- 2. Executive Summary
- 2.1. Introduction
- 3. Market Dynamics
- 3.1. Introduction
- 3.2. Market Drivers
- 3.3. Market Restrains
- 3.4. Market Trends
- 4. Market Factor Analysis
- 4.1. Porters Five Forces
- 4.2. Supply/Value Chain
- 4.3. PESTEL analysis
- 4.4. Market Entropy
- 4.5. Patent/Trademark Analysis
- 5. Global Contactless Readers Analysis, Insights and Forecast, 2019-2031
- 5.1. Market Analysis, Insights and Forecast - by Application
- 5.1.1. ATM
- 5.1.2. Kiosk
- 5.1.3. POS
- 5.1.4. Other
- 5.2. Market Analysis, Insights and Forecast - by Types
- 5.2.1. Fixed Contactless Readers
- 5.2.2. Mobile Contactless Readers
- 5.3. Market Analysis, Insights and Forecast - by Region
- 5.3.1. North America
- 5.3.2. South America
- 5.3.3. Europe
- 5.3.4. Middle East & Africa
- 5.3.5. Asia Pacific
- 5.1. Market Analysis, Insights and Forecast - by Application
- 6. North America Contactless Readers Analysis, Insights and Forecast, 2019-2031
- 6.1. Market Analysis, Insights and Forecast - by Application
- 6.1.1. ATM
- 6.1.2. Kiosk
- 6.1.3. POS
- 6.1.4. Other
- 6.2. Market Analysis, Insights and Forecast - by Types
- 6.2.1. Fixed Contactless Readers
- 6.2.2. Mobile Contactless Readers
- 6.1. Market Analysis, Insights and Forecast - by Application
- 7. South America Contactless Readers Analysis, Insights and Forecast, 2019-2031
- 7.1. Market Analysis, Insights and Forecast - by Application
- 7.1.1. ATM
- 7.1.2. Kiosk
- 7.1.3. POS
- 7.1.4. Other
- 7.2. Market Analysis, Insights and Forecast - by Types
- 7.2.1. Fixed Contactless Readers
- 7.2.2. Mobile Contactless Readers
- 7.1. Market Analysis, Insights and Forecast - by Application
- 8. Europe Contactless Readers Analysis, Insights and Forecast, 2019-2031
- 8.1. Market Analysis, Insights and Forecast - by Application
- 8.1.1. ATM
- 8.1.2. Kiosk
- 8.1.3. POS
- 8.1.4. Other
- 8.2. Market Analysis, Insights and Forecast - by Types
- 8.2.1. Fixed Contactless Readers
- 8.2.2. Mobile Contactless Readers
- 8.1. Market Analysis, Insights and Forecast - by Application
- 9. Middle East & Africa Contactless Readers Analysis, Insights and Forecast, 2019-2031
- 9.1. Market Analysis, Insights and Forecast - by Application
- 9.1.1. ATM
- 9.1.2. Kiosk
- 9.1.3. POS
- 9.1.4. Other
- 9.2. Market Analysis, Insights and Forecast - by Types
- 9.2.1. Fixed Contactless Readers
- 9.2.2. Mobile Contactless Readers
- 9.1. Market Analysis, Insights and Forecast - by Application
- 10. Asia Pacific Contactless Readers Analysis, Insights and Forecast, 2019-2031
- 10.1. Market Analysis, Insights and Forecast - by Application
- 10.1.1. ATM
- 10.1.2. Kiosk
- 10.1.3. POS
- 10.1.4. Other
- 10.2. Market Analysis, Insights and Forecast - by Types
- 10.2.1. Fixed Contactless Readers
- 10.2.2. Mobile Contactless Readers
- 10.1. Market Analysis, Insights and Forecast - by Application
- 11. Competitive Analysis
- 11.1. Global Market Share Analysis 2024
- 11.2. Company Profiles
- 11.2.1 Square
- 11.2.1.1. Overview
- 11.2.1.2. Products
- 11.2.1.3. SWOT Analysis
- 11.2.1.4. Recent Developments
- 11.2.1.5. Financials (Based on Availability)
- 11.2.2 Shopify
- 11.2.2.1. Overview
- 11.2.2.2. Products
- 11.2.2.3. SWOT Analysis
- 11.2.2.4. Recent Developments
- 11.2.2.5. Financials (Based on Availability)
- 11.2.3 PayAnywhere
- 11.2.3.1. Overview
- 11.2.3.2. Products
- 11.2.3.3. SWOT Analysis
- 11.2.3.4. Recent Developments
- 11.2.3.5. Financials (Based on Availability)
- 11.2.4 PayPal Here
- 11.2.4.1. Overview
- 11.2.4.2. Products
- 11.2.4.3. SWOT Analysis
- 11.2.4.4. Recent Developments
- 11.2.4.5. Financials (Based on Availability)
- 11.2.5 Advanced Card Systems
- 11.2.5.1. Overview
- 11.2.5.2. Products
- 11.2.5.3. SWOT Analysis
- 11.2.5.4. Recent Developments
- 11.2.5.5. Financials (Based on Availability)
- 11.2.6 SumUp
- 11.2.6.1. Overview
- 11.2.6.2. Products
- 11.2.6.3. SWOT Analysis
- 11.2.6.4. Recent Developments
- 11.2.6.5. Financials (Based on Availability)
- 11.2.7 Honeywell
- 11.2.7.1. Overview
- 11.2.7.2. Products
- 11.2.7.3. SWOT Analysis
- 11.2.7.4. Recent Developments
- 11.2.7.5. Financials (Based on Availability)
- 11.2.8 Ingenico
- 11.2.8.1. Overview
- 11.2.8.2. Products
- 11.2.8.3. SWOT Analysis
- 11.2.8.4. Recent Developments
- 11.2.8.5. Financials (Based on Availability)
- 11.2.9 Magtek
- 11.2.9.1. Overview
- 11.2.9.2. Products
- 11.2.9.3. SWOT Analysis
- 11.2.9.4. Recent Developments
- 11.2.9.5. Financials (Based on Availability)
- 11.2.10 Verifone
- 11.2.10.1. Overview
- 11.2.10.2. Products
- 11.2.10.3. SWOT Analysis
- 11.2.10.4. Recent Developments
- 11.2.10.5. Financials (Based on Availability)
- 11.2.1 Square
List of Figures
- Figure 1: Global Contactless Readers Revenue Breakdown (million, %) by Region 2024 & 2032
- Figure 2: Global Contactless Readers Volume Breakdown (K, %) by Region 2024 & 2032
- Figure 3: North America Contactless Readers Revenue (million), by Application 2024 & 2032
- Figure 4: North America Contactless Readers Volume (K), by Application 2024 & 2032
- Figure 5: North America Contactless Readers Revenue Share (%), by Application 2024 & 2032
- Figure 6: North America Contactless Readers Volume Share (%), by Application 2024 & 2032
- Figure 7: North America Contactless Readers Revenue (million), by Types 2024 & 2032
- Figure 8: North America Contactless Readers Volume (K), by Types 2024 & 2032
- Figure 9: North America Contactless Readers Revenue Share (%), by Types 2024 & 2032
- Figure 10: North America Contactless Readers Volume Share (%), by Types 2024 & 2032
- Figure 11: North America Contactless Readers Revenue (million), by Country 2024 & 2032
- Figure 12: North America Contactless Readers Volume (K), by Country 2024 & 2032
- Figure 13: North America Contactless Readers Revenue Share (%), by Country 2024 & 2032
- Figure 14: North America Contactless Readers Volume Share (%), by Country 2024 & 2032
- Figure 15: South America Contactless Readers Revenue (million), by Application 2024 & 2032
- Figure 16: South America Contactless Readers Volume (K), by Application 2024 & 2032
- Figure 17: South America Contactless Readers Revenue Share (%), by Application 2024 & 2032
- Figure 18: South America Contactless Readers Volume Share (%), by Application 2024 & 2032
- Figure 19: South America Contactless Readers Revenue (million), by Types 2024 & 2032
- Figure 20: South America Contactless Readers Volume (K), by Types 2024 & 2032
- Figure 21: South America Contactless Readers Revenue Share (%), by Types 2024 & 2032
- Figure 22: South America Contactless Readers Volume Share (%), by Types 2024 & 2032
- Figure 23: South America Contactless Readers Revenue (million), by Country 2024 & 2032
- Figure 24: South America Contactless Readers Volume (K), by Country 2024 & 2032
- Figure 25: South America Contactless Readers Revenue Share (%), by Country 2024 & 2032
- Figure 26: South America Contactless Readers Volume Share (%), by Country 2024 & 2032
- Figure 27: Europe Contactless Readers Revenue (million), by Application 2024 & 2032
- Figure 28: Europe Contactless Readers Volume (K), by Application 2024 & 2032
- Figure 29: Europe Contactless Readers Revenue Share (%), by Application 2024 & 2032
- Figure 30: Europe Contactless Readers Volume Share (%), by Application 2024 & 2032
- Figure 31: Europe Contactless Readers Revenue (million), by Types 2024 & 2032
- Figure 32: Europe Contactless Readers Volume (K), by Types 2024 & 2032
- Figure 33: Europe Contactless Readers Revenue Share (%), by Types 2024 & 2032
- Figure 34: Europe Contactless Readers Volume Share (%), by Types 2024 & 2032
- Figure 35: Europe Contactless Readers Revenue (million), by Country 2024 & 2032
- Figure 36: Europe Contactless Readers Volume (K), by Country 2024 & 2032
- Figure 37: Europe Contactless Readers Revenue Share (%), by Country 2024 & 2032
- Figure 38: Europe Contactless Readers Volume Share (%), by Country 2024 & 2032
- Figure 39: Middle East & Africa Contactless Readers Revenue (million), by Application 2024 & 2032
- Figure 40: Middle East & Africa Contactless Readers Volume (K), by Application 2024 & 2032
- Figure 41: Middle East & Africa Contactless Readers Revenue Share (%), by Application 2024 & 2032
- Figure 42: Middle East & Africa Contactless Readers Volume Share (%), by Application 2024 & 2032
- Figure 43: Middle East & Africa Contactless Readers Revenue (million), by Types 2024 & 2032
- Figure 44: Middle East & Africa Contactless Readers Volume (K), by Types 2024 & 2032
- Figure 45: Middle East & Africa Contactless Readers Revenue Share (%), by Types 2024 & 2032
- Figure 46: Middle East & Africa Contactless Readers Volume Share (%), by Types 2024 & 2032
- Figure 47: Middle East & Africa Contactless Readers Revenue (million), by Country 2024 & 2032
- Figure 48: Middle East & Africa Contactless Readers Volume (K), by Country 2024 & 2032
- Figure 49: Middle East & Africa Contactless Readers Revenue Share (%), by Country 2024 & 2032
- Figure 50: Middle East & Africa Contactless Readers Volume Share (%), by Country 2024 & 2032
- Figure 51: Asia Pacific Contactless Readers Revenue (million), by Application 2024 & 2032
- Figure 52: Asia Pacific Contactless Readers Volume (K), by Application 2024 & 2032
- Figure 53: Asia Pacific Contactless Readers Revenue Share (%), by Application 2024 & 2032
- Figure 54: Asia Pacific Contactless Readers Volume Share (%), by Application 2024 & 2032
- Figure 55: Asia Pacific Contactless Readers Revenue (million), by Types 2024 & 2032
- Figure 56: Asia Pacific Contactless Readers Volume (K), by Types 2024 & 2032
- Figure 57: Asia Pacific Contactless Readers Revenue Share (%), by Types 2024 & 2032
- Figure 58: Asia Pacific Contactless Readers Volume Share (%), by Types 2024 & 2032
- Figure 59: Asia Pacific Contactless Readers Revenue (million), by Country 2024 & 2032
- Figure 60: Asia Pacific Contactless Readers Volume (K), by Country 2024 & 2032
- Figure 61: Asia Pacific Contactless Readers Revenue Share (%), by Country 2024 & 2032
- Figure 62: Asia Pacific Contactless Readers Volume Share (%), by Country 2024 & 2032
List of Tables
- Table 1: Global Contactless Readers Revenue million Forecast, by Region 2019 & 2032
- Table 2: Global Contactless Readers Volume K Forecast, by Region 2019 & 2032
- Table 3: Global Contactless Readers Revenue million Forecast, by Application 2019 & 2032
- Table 4: Global Contactless Readers Volume K Forecast, by Application 2019 & 2032
- Table 5: Global Contactless Readers Revenue million Forecast, by Types 2019 & 2032
- Table 6: Global Contactless Readers Volume K Forecast, by Types 2019 & 2032
- Table 7: Global Contactless Readers Revenue million Forecast, by Region 2019 & 2032
- Table 8: Global Contactless Readers Volume K Forecast, by Region 2019 & 2032
- Table 9: Global Contactless Readers Revenue million Forecast, by Application 2019 & 2032
- Table 10: Global Contactless Readers Volume K Forecast, by Application 2019 & 2032
- Table 11: Global Contactless Readers Revenue million Forecast, by Types 2019 & 2032
- Table 12: Global Contactless Readers Volume K Forecast, by Types 2019 & 2032
- Table 13: Global Contactless Readers Revenue million Forecast, by Country 2019 & 2032
- Table 14: Global Contactless Readers Volume K Forecast, by Country 2019 & 2032
- Table 15: United States Contactless Readers Revenue (million) Forecast, by Application 2019 & 2032
- Table 16: United States Contactless Readers Volume (K) Forecast, by Application 2019 & 2032
- Table 17: Canada Contactless Readers Revenue (million) Forecast, by Application 2019 & 2032
- Table 18: Canada Contactless Readers Volume (K) Forecast, by Application 2019 & 2032
- Table 19: Mexico Contactless Readers Revenue (million) Forecast, by Application 2019 & 2032
- Table 20: Mexico Contactless Readers Volume (K) Forecast, by Application 2019 & 2032
- Table 21: Global Contactless Readers Revenue million Forecast, by Application 2019 & 2032
- Table 22: Global Contactless Readers Volume K Forecast, by Application 2019 & 2032
- Table 23: Global Contactless Readers Revenue million Forecast, by Types 2019 & 2032
- Table 24: Global Contactless Readers Volume K Forecast, by Types 2019 & 2032
- Table 25: Global Contactless Readers Revenue million Forecast, by Country 2019 & 2032
- Table 26: Global Contactless Readers Volume K Forecast, by Country 2019 & 2032
- Table 27: Brazil Contactless Readers Revenue (million) Forecast, by Application 2019 & 2032
- Table 28: Brazil Contactless Readers Volume (K) Forecast, by Application 2019 & 2032
- Table 29: Argentina Contactless Readers Revenue (million) Forecast, by Application 2019 & 2032
- Table 30: Argentina Contactless Readers Volume (K) Forecast, by Application 2019 & 2032
- Table 31: Rest of South America Contactless Readers Revenue (million) Forecast, by Application 2019 & 2032
- Table 32: Rest of South America Contactless Readers Volume (K) Forecast, by Application 2019 & 2032
- Table 33: Global Contactless Readers Revenue million Forecast, by Application 2019 & 2032
- Table 34: Global Contactless Readers Volume K Forecast, by Application 2019 & 2032
- Table 35: Global Contactless Readers Revenue million Forecast, by Types 2019 & 2032
- Table 36: Global Contactless Readers Volume K Forecast, by Types 2019 & 2032
- Table 37: Global Contactless Readers Revenue million Forecast, by Country 2019 & 2032
- Table 38: Global Contactless Readers Volume K Forecast, by Country 2019 & 2032
- Table 39: United Kingdom Contactless Readers Revenue (million) Forecast, by Application 2019 & 2032
- Table 40: United Kingdom Contactless Readers Volume (K) Forecast, by Application 2019 & 2032
- Table 41: Germany Contactless Readers Revenue (million) Forecast, by Application 2019 & 2032
- Table 42: Germany Contactless Readers Volume (K) Forecast, by Application 2019 & 2032
- Table 43: France Contactless Readers Revenue (million) Forecast, by Application 2019 & 2032
- Table 44: France Contactless Readers Volume (K) Forecast, by Application 2019 & 2032
- Table 45: Italy Contactless Readers Revenue (million) Forecast, by Application 2019 & 2032
- Table 46: Italy Contactless Readers Volume (K) Forecast, by Application 2019 & 2032
- Table 47: Spain Contactless Readers Revenue (million) Forecast, by Application 2019 & 2032
- Table 48: Spain Contactless Readers Volume (K) Forecast, by Application 2019 & 2032
- Table 49: Russia Contactless Readers Revenue (million) Forecast, by Application 2019 & 2032
- Table 50: Russia Contactless Readers Volume (K) Forecast, by Application 2019 & 2032
- Table 51: Benelux Contactless Readers Revenue (million) Forecast, by Application 2019 & 2032
- Table 52: Benelux Contactless Readers Volume (K) Forecast, by Application 2019 & 2032
- Table 53: Nordics Contactless Readers Revenue (million) Forecast, by Application 2019 & 2032
- Table 54: Nordics Contactless Readers Volume (K) Forecast, by Application 2019 & 2032
- Table 55: Rest of Europe Contactless Readers Revenue (million) Forecast, by Application 2019 & 2032
- Table 56: Rest of Europe Contactless Readers Volume (K) Forecast, by Application 2019 & 2032
- Table 57: Global Contactless Readers Revenue million Forecast, by Application 2019 & 2032
- Table 58: Global Contactless Readers Volume K Forecast, by Application 2019 & 2032
- Table 59: Global Contactless Readers Revenue million Forecast, by Types 2019 & 2032
- Table 60: Global Contactless Readers Volume K Forecast, by Types 2019 & 2032
- Table 61: Global Contactless Readers Revenue million Forecast, by Country 2019 & 2032
- Table 62: Global Contactless Readers Volume K Forecast, by Country 2019 & 2032
- Table 63: Turkey Contactless Readers Revenue (million) Forecast, by Application 2019 & 2032
- Table 64: Turkey Contactless Readers Volume (K) Forecast, by Application 2019 & 2032
- Table 65: Israel Contactless Readers Revenue (million) Forecast, by Application 2019 & 2032
- Table 66: Israel Contactless Readers Volume (K) Forecast, by Application 2019 & 2032
- Table 67: GCC Contactless Readers Revenue (million) Forecast, by Application 2019 & 2032
- Table 68: GCC Contactless Readers Volume (K) Forecast, by Application 2019 & 2032
- Table 69: North Africa Contactless Readers Revenue (million) Forecast, by Application 2019 & 2032
- Table 70: North Africa Contactless Readers Volume (K) Forecast, by Application 2019 & 2032
- Table 71: South Africa Contactless Readers Revenue (million) Forecast, by Application 2019 & 2032
- Table 72: South Africa Contactless Readers Volume (K) Forecast, by Application 2019 & 2032
- Table 73: Rest of Middle East & Africa Contactless Readers Revenue (million) Forecast, by Application 2019 & 2032
- Table 74: Rest of Middle East & Africa Contactless Readers Volume (K) Forecast, by Application 2019 & 2032
- Table 75: Global Contactless Readers Revenue million Forecast, by Application 2019 & 2032
- Table 76: Global Contactless Readers Volume K Forecast, by Application 2019 & 2032
- Table 77: Global Contactless Readers Revenue million Forecast, by Types 2019 & 2032
- Table 78: Global Contactless Readers Volume K Forecast, by Types 2019 & 2032
- Table 79: Global Contactless Readers Revenue million Forecast, by Country 2019 & 2032
- Table 80: Global Contactless Readers Volume K Forecast, by Country 2019 & 2032
- Table 81: China Contactless Readers Revenue (million) Forecast, by Application 2019 & 2032
- Table 82: China Contactless Readers Volume (K) Forecast, by Application 2019 & 2032
- Table 83: India Contactless Readers Revenue (million) Forecast, by Application 2019 & 2032
- Table 84: India Contactless Readers Volume (K) Forecast, by Application 2019 & 2032
- Table 85: Japan Contactless Readers Revenue (million) Forecast, by Application 2019 & 2032
- Table 86: Japan Contactless Readers Volume (K) Forecast, by Application 2019 & 2032
- Table 87: South Korea Contactless Readers Revenue (million) Forecast, by Application 2019 & 2032
- Table 88: South Korea Contactless Readers Volume (K) Forecast, by Application 2019 & 2032
- Table 89: ASEAN Contactless Readers Revenue (million) Forecast, by Application 2019 & 2032
- Table 90: ASEAN Contactless Readers Volume (K) Forecast, by Application 2019 & 2032
- Table 91: Oceania Contactless Readers Revenue (million) Forecast, by Application 2019 & 2032
- Table 92: Oceania Contactless Readers Volume (K) Forecast, by Application 2019 & 2032
- Table 93: Rest of Asia Pacific Contactless Readers Revenue (million) Forecast, by Application 2019 & 2032
- Table 94: Rest of Asia Pacific Contactless Readers Volume (K) Forecast, by Application 2019 & 2032
Frequently Asked Questions
1. What is the projected Compound Annual Growth Rate (CAGR) of the Contactless Readers?
The projected CAGR is approximately XX%.
2. Which companies are prominent players in the Contactless Readers?
Key companies in the market include Square, Shopify, PayAnywhere, PayPal Here, Advanced Card Systems, SumUp, Honeywell, Ingenico, Magtek, Verifone.
3. What are the main segments of the Contactless Readers?
The market segments include Application, Types.
4. Can you provide details about the market size?
The market size is estimated to be USD XXX million as of 2022.
5. What are some drivers contributing to market growth?
N/A
6. What are the notable trends driving market growth?
N/A
7. Are there any restraints impacting market growth?
N/A
8. Can you provide examples of recent developments in the market?
N/A
9. What pricing options are available for accessing the report?
Pricing options include single-user, multi-user, and enterprise licenses priced at USD 3350.00, USD 5025.00, and USD 6700.00 respectively.
10. Is the market size provided in terms of value or volume?
The market size is provided in terms of value, measured in million and volume, measured in K.
11. Are there any specific market keywords associated with the report?
Yes, the market keyword associated with the report is "Contactless Readers," which aids in identifying and referencing the specific market segment covered.
12. How do I determine which pricing option suits my needs best?
The pricing options vary based on user requirements and access needs. Individual users may opt for single-user licenses, while businesses requiring broader access may choose multi-user or enterprise licenses for cost-effective access to the report.
13. Are there any additional resources or data provided in the Contactless Readers report?
While the report offers comprehensive insights, it's advisable to review the specific contents or supplementary materials provided to ascertain if additional resources or data are available.
14. How can I stay updated on further developments or reports in the Contactless Readers?
To stay informed about further developments, trends, and reports in the Contactless Readers, consider subscribing to industry newsletters, following relevant companies and organizations, or regularly checking reputable industry news sources and publications.
Methodology
Step 1 - Identification of Relevant Samples Size from Population Database


Step 2 - Approaches for Defining Global Market Size (Value, Volume* & Price*)

Note*: In applicable scenarios
Step 3 - Data Sources
Primary Research
- Web Analytics
- Survey Reports
- Research Institute
- Latest Research Reports
- Opinion Leaders
Secondary Research
- Annual Reports
- White Paper
- Latest Press Release
- Industry Association
- Paid Database
- Investor Presentations

Step 4 - Data Triangulation
Involves using different sources of information in order to increase the validity of a study
These sources are likely to be stakeholders in a program - participants, other researchers, program staff, other community members, and so on.
Then we put all data in single framework & apply various statistical tools to find out the dynamic on the market.
During the analysis stage, feedback from the stakeholder groups would be compared to determine areas of agreement as well as areas of divergence


