
Key Insights
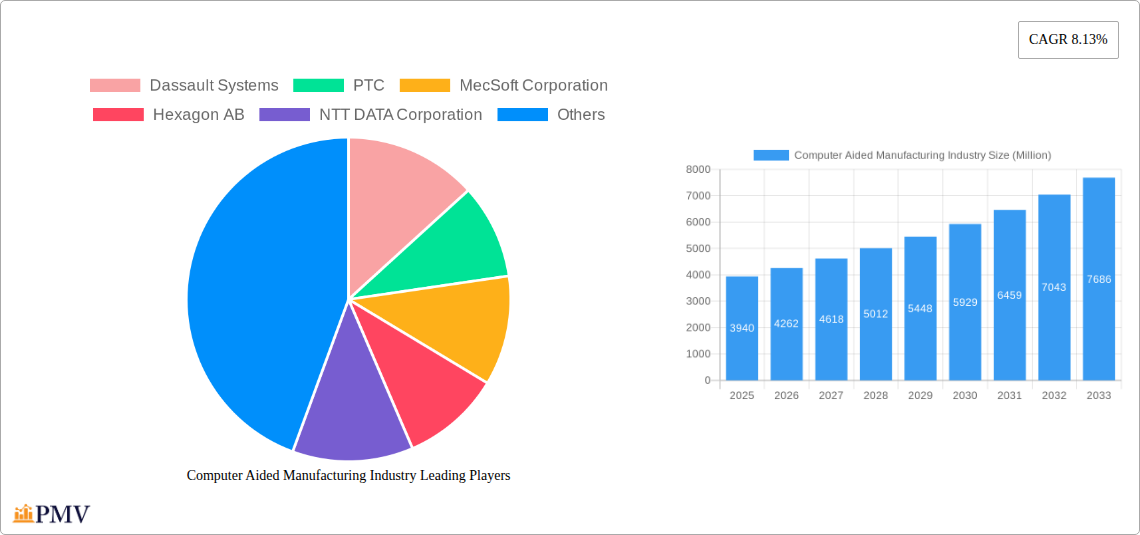
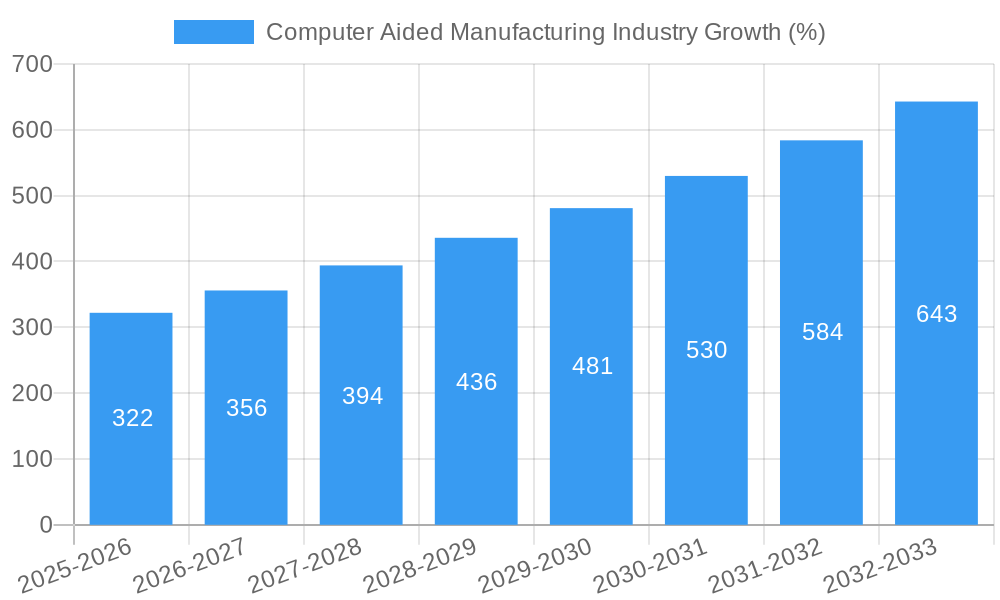
The Computer Aided Manufacturing (CAM) industry is experiencing robust growth, projected to reach a market size of $3.94 billion in 2025, expanding at a Compound Annual Growth Rate (CAGR) of 8.13%. This expansion is fueled by several key drivers. The increasing adoption of Industry 4.0 technologies, including the Internet of Things (IoT) and cloud computing, is streamlining manufacturing processes and enhancing efficiency, driving demand for advanced CAM solutions. Furthermore, the rising need for automation to improve productivity and reduce labor costs, particularly within sectors like automotive and aerospace, is a significant catalyst for market growth. The growing complexity of product designs and the demand for customized products are also contributing factors. While the initial investment in CAM software and hardware can be substantial, the long-term benefits in terms of cost savings, improved quality, and faster production cycles are overcoming this restraint. The market is segmented by end-user industry, with Aerospace & Defense, Automotive, and Medical sectors being prominent consumers of CAM technologies. Leading players such as Dassault Systèmes, PTC, and Autodesk are strategically investing in research and development to offer innovative and integrated solutions, further stimulating market competition and innovation. Geographic expansion, particularly in rapidly industrializing economies within the Asia-Pacific region, also presents lucrative opportunities for growth. The ongoing shift towards sustainable manufacturing practices, including reducing waste and optimizing resource utilization, is expected to further drive the adoption of CAM solutions designed for environmentally conscious production.
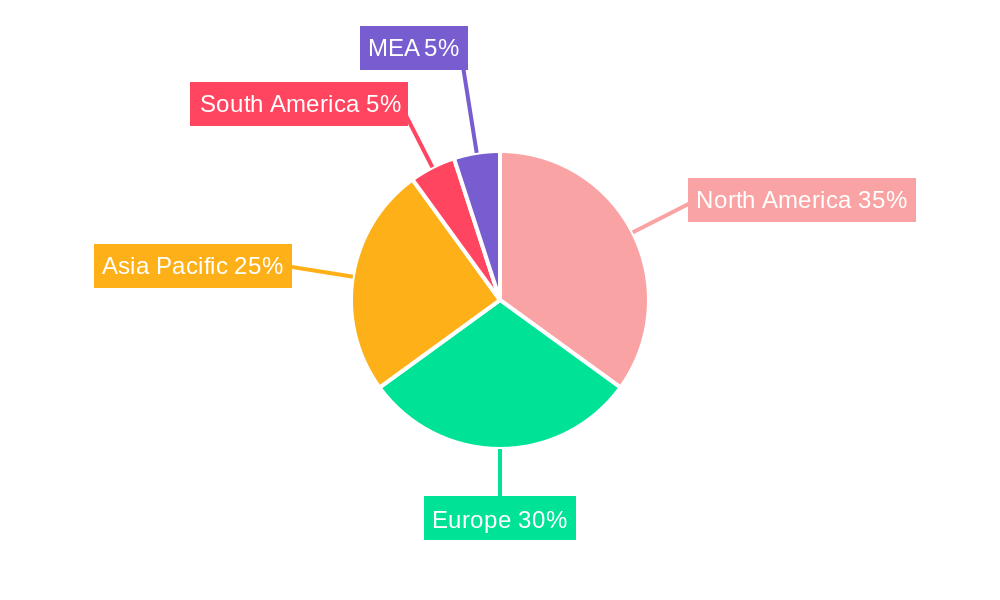
The forecast period (2025-2033) anticipates continued expansion driven by technological advancements such as AI-powered CAM software, additive manufacturing integration, and improved data analytics capabilities. The ongoing digital transformation within manufacturing enterprises worldwide is creating a fertile ground for widespread adoption. While certain regions like North America and Europe currently hold a significant market share, the Asia-Pacific region is projected to witness the most substantial growth during the forecast period due to rapid industrialization and increasing investment in advanced manufacturing technologies. The competitive landscape is characterized by both established industry giants and emerging innovative companies, fostering a dynamic and evolving market environment where continuous improvement and innovation are key to success. The long-term outlook for the CAM industry remains positive, with substantial potential for growth and expansion across various sectors and geographies.
Computer Aided Manufacturing (CAM) Industry Market Report: 2019-2033
This comprehensive report provides a detailed analysis of the Computer Aided Manufacturing (CAM) industry, offering invaluable insights for stakeholders across the value chain. With a focus on market dynamics, technological advancements, and key players, this report covers the period from 2019 to 2033, with a base year of 2025 and a forecast period of 2025-2033. The report leverages extensive data analysis to provide actionable intelligence for strategic decision-making. Market values are expressed in USD million.
Computer Aided Manufacturing Industry Market Structure & Competitive Dynamics
The Computer Aided Manufacturing (CAM) industry exhibits a moderately concentrated market structure, with a few dominant players and numerous niche providers. Market concentration is influenced by factors such as technological capabilities, geographical reach, and customer relationships. The industry's innovation ecosystem is highly dynamic, characterized by continuous advancements in software, hardware, and integration solutions. Regulatory frameworks, particularly those related to data security and intellectual property, significantly impact market operations. Product substitutes, including traditional manufacturing methods, exert competitive pressure, particularly in price-sensitive segments. End-user trends, such as increasing automation and digitalization, shape market demand. Mergers and acquisitions (M&A) activity is prevalent, with larger players acquiring smaller companies to expand their product portfolios and market share. Over the historical period (2019-2024), the total value of M&A deals in the CAM industry is estimated at $xx Million, with an average deal value of $xx Million.
- Market Share: The top 5 players account for approximately xx% of the global market share in 2024.
- M&A Activity: Increased M&A activity is anticipated, driven by the need for technology expansion and market consolidation.
- Innovation: Continuous development of AI-powered CAM solutions and cloud-based platforms fuels competition and drives growth.
Computer Aided Manufacturing Industry Industry Trends & Insights
The CAM industry is experiencing robust growth, driven by several key factors. The increasing adoption of automation and digitalization across various industries is a major catalyst. The demand for higher efficiency, improved product quality, and reduced production costs fuels the adoption of CAM solutions. Technological disruptions, such as the integration of artificial intelligence (AI), machine learning (ML), and the Internet of Things (IoT), are reshaping the industry landscape, creating new opportunities and challenges. Consumer preferences are shifting towards customized and personalized products, necessitating flexible and adaptable manufacturing processes, further driving CAM adoption. Competitive dynamics are intense, with companies constantly innovating to maintain a competitive edge. The Compound Annual Growth Rate (CAGR) for the CAM market is projected to be xx% during the forecast period (2025-2033), with significant market penetration expected in emerging economies.
Dominant Markets & Segments in Computer Aided Manufacturing Industry
North America currently holds the dominant position in the global CAM market, driven by robust technological advancements, high adoption rates across various end-user industries, and a supportive regulatory environment. Within the end-user segments, the Automotive and Aerospace & Defense industries are the largest consumers of CAM solutions, accounting for xx% and xx% of the total market revenue in 2024 respectively, largely due to the complexity of their products and the need for precision manufacturing.
- Key Drivers for North American Dominance:
- Strong technological innovation and R&D investment.
- High adoption of automation and digitalization across industries.
- Well-developed infrastructure and supply chain networks.
- Favorable regulatory environment.
- Aerospace & Defense (Revenue: $xx Million, Market Share: xx%): Driven by the need for highly precise and complex parts manufacturing.
- Automotive (Revenue: $xx Million, Market Share: xx%): Fueled by the demand for lightweight, fuel-efficient vehicles and increasing automation in manufacturing.
- Medical (Revenue: $xx Million, Market Share: xx%): Driven by the need for high-precision and biocompatible medical devices.
- Energy & Utilities (Revenue: $xx Million, Market Share: xx%): Driven by increased demand for efficient energy production and distribution.
- Other End-User Industries (Revenue: $xx Million, Market Share: xx%): Includes sectors like consumer goods, electronics, and machinery manufacturing.
Computer Aided Manufacturing Industry Product Innovations
Recent product innovations in the CAM industry focus on enhancing software capabilities through AI and ML integration, improving simulation accuracy, and enabling seamless integration with other manufacturing software and hardware. Cloud-based CAM solutions are gaining traction, offering increased scalability, accessibility, and collaboration capabilities. The integration of advanced sensors and data analytics improves real-time monitoring and control, leading to higher efficiency and improved product quality. These innovations address the growing demand for flexible, adaptable, and efficient manufacturing processes, catering to the needs of a wide range of industries.
Report Segmentation & Scope
This report segments the CAM market by end-user industry: Aerospace & Defense, Automotive, Medical, Energy & Utilities, and Other End-User Industries. Each segment is analyzed based on revenue, market share, growth projections, and competitive dynamics. The report provides detailed insights into the historical performance (2019-2024) and future projections (2025-2033) for each segment, enabling a comprehensive understanding of the market landscape. The growth of each segment is influenced by specific industry trends and technological advancements, with some experiencing faster growth than others. Competitive dynamics within each segment are also analyzed, identifying key players and their market strategies.
Key Drivers of Computer Aided Manufacturing Industry Growth
Several factors are driving the growth of the CAM industry. Technological advancements, such as AI-powered design and simulation tools and advanced manufacturing processes, are significantly impacting production efficiency and product quality. Economic factors, such as increasing demand for customized products and the need for cost reduction, are driving CAM adoption across various sectors. Regulatory factors, including government incentives for automation and digitalization, are also promoting growth in the CAM industry. For example, tax credits and grants for implementing CAM technologies in specific industries are encouraging adoption.
Challenges in the Computer Aided Manufacturing Industry Sector
Despite the significant growth potential, the CAM industry faces several challenges. High implementation costs and the complexity of integrating CAM systems into existing manufacturing processes can hinder adoption, particularly in small and medium-sized enterprises (SMEs). Supply chain disruptions and cybersecurity threats can also impact operations and profitability. Intense competition and the rapid pace of technological innovation necessitate continuous investment in research and development to maintain a competitive edge. These factors can lead to decreased profitability if not effectively managed.
Leading Players in the Computer Aided Manufacturing Industry Market
- Dassault Systèmes
- PTC
- MecSoft Corporation
- Hexagon AB
- NTT DATA Corporation
- Siemens AG
- SolidCAM Ltd
- OPEN MIND Technologies AG
- Autodesk Inc
- 3D Systems Inc
- BobCAD-CAM
- SmartCAMcnc
- ZWSOFTCO LTD (Guangzhou)
- HCL Technologies Limited
- CNC Software LLC (Mastercam)
Key Developments in Computer Aided Manufacturing Industry Sector
- November 2023: Microlight3D launched Luminis software, a CAM software for microFAB-3D, enabling 3D printing of objects 100 times smaller than a hair strand. This significantly expands the applications of 3D printing in micro-robotics, microfluidics, and other micro-scale technologies. The high-speed 3D visualization (40-60 fps) offers enhanced control and monitoring capabilities.
- May 2023: NVIDIA introduced NVIDIA Omniverse, a platform connecting CAD apps, APIs, and AI frameworks for virtual factory building, digitalizing manufacturing workflows, and improving quality and safety. This comprehensive suite of tools enhances the digital twin capabilities for CAM applications, driving improved efficiency and reduced errors.
Strategic Computer Aided Manufacturing Industry Market Outlook
The future of the CAM industry is promising, with significant growth potential driven by continued technological advancements, increasing automation across various industries, and the growing demand for customized products. Strategic opportunities exist for companies that can effectively leverage AI, ML, and IoT technologies to enhance the capabilities of their CAM solutions. Focusing on developing cloud-based solutions and strengthening partnerships with other technology providers can also enhance market positioning and drive growth. Furthermore, companies need to invest in cybersecurity measures and supply chain resilience to address the challenges faced by the industry.
Computer Aided Manufacturing Industry Segmentation
-
1. Deployment Model
- 1.1. On-Premises
- 1.2. Cloud-Based
-
2. End-User Industry
- 2.1. Aerospace & Defense
- 2.2. Automotive
- 2.3. Medical
- 2.4. Energy & Utilities
- 2.5. Other End-User Industries
Computer Aided Manufacturing Industry Segmentation By Geography
-
1. North America
- 1.1. United States
- 1.2. Canada
-
2. Europe
- 2.1. Germany
- 2.2. Switzerland
- 2.3. Spain
- 2.4. Austria
- 2.5. Belgium
- 2.6. Netherlands
- 2.7. United Kingdom
- 2.8. France
- 2.9. Italy
- 2.10. Sweden
- 2.11. Poland
-
3. Asia
- 3.1. China
- 3.2. Japan
- 3.3. South Korea
- 3.4. India
- 4. Australia and New Zealand
-
5. Latin America
- 5.1. Brazil
- 5.2. Mexico
-
6. Middle East and Africa
- 6.1. United Arab Emirates
- 6.2. Saudi Arabia
- 6.3. South Africa
Computer Aided Manufacturing Industry REPORT HIGHLIGHTS
| Aspects | Details |
|---|---|
| Study Period | 2019-2033 |
| Base Year | 2024 |
| Estimated Year | 2025 |
| Forecast Period | 2025-2033 |
| Historical Period | 2019-2024 |
| Growth Rate | CAGR of 8.13% from 2019-2033 |
| Segmentation |
|
Table of Contents
- 1. Introduction
- 1.1. Research Scope
- 1.2. Market Segmentation
- 1.3. Research Methodology
- 1.4. Definitions and Assumptions
- 2. Executive Summary
- 2.1. Introduction
- 3. Market Dynamics
- 3.1. Introduction
- 3.2. Market Drivers
- 3.2.1. Increasing Adoption of Industry 4.; Growing Utilization of CAM Software in the Packaging Machinery Sector
- 3.3. Market Restrains
- 3.3.1. Wide Availability of Open Source CAM Software
- 3.4. Market Trends
- 3.4.1. Automotive is Expected to Hold a Major Market Share
- 4. Market Factor Analysis
- 4.1. Porters Five Forces
- 4.2. Supply/Value Chain
- 4.3. PESTEL analysis
- 4.4. Market Entropy
- 4.5. Patent/Trademark Analysis
- 5. Global Computer Aided Manufacturing Industry Analysis, Insights and Forecast, 2019-2031
- 5.1. Market Analysis, Insights and Forecast - by Deployment Model
- 5.1.1. On-Premises
- 5.1.2. Cloud-Based
- 5.2. Market Analysis, Insights and Forecast - by End-User Industry
- 5.2.1. Aerospace & Defense
- 5.2.2. Automotive
- 5.2.3. Medical
- 5.2.4. Energy & Utilities
- 5.2.5. Other End-User Industries
- 5.3. Market Analysis, Insights and Forecast - by Region
- 5.3.1. North America
- 5.3.2. Europe
- 5.3.3. Asia
- 5.3.4. Australia and New Zealand
- 5.3.5. Latin America
- 5.3.6. Middle East and Africa
- 5.1. Market Analysis, Insights and Forecast - by Deployment Model
- 6. North America Computer Aided Manufacturing Industry Analysis, Insights and Forecast, 2019-2031
- 6.1. Market Analysis, Insights and Forecast - by Deployment Model
- 6.1.1. On-Premises
- 6.1.2. Cloud-Based
- 6.2. Market Analysis, Insights and Forecast - by End-User Industry
- 6.2.1. Aerospace & Defense
- 6.2.2. Automotive
- 6.2.3. Medical
- 6.2.4. Energy & Utilities
- 6.2.5. Other End-User Industries
- 6.1. Market Analysis, Insights and Forecast - by Deployment Model
- 7. Europe Computer Aided Manufacturing Industry Analysis, Insights and Forecast, 2019-2031
- 7.1. Market Analysis, Insights and Forecast - by Deployment Model
- 7.1.1. On-Premises
- 7.1.2. Cloud-Based
- 7.2. Market Analysis, Insights and Forecast - by End-User Industry
- 7.2.1. Aerospace & Defense
- 7.2.2. Automotive
- 7.2.3. Medical
- 7.2.4. Energy & Utilities
- 7.2.5. Other End-User Industries
- 7.1. Market Analysis, Insights and Forecast - by Deployment Model
- 8. Asia Computer Aided Manufacturing Industry Analysis, Insights and Forecast, 2019-2031
- 8.1. Market Analysis, Insights and Forecast - by Deployment Model
- 8.1.1. On-Premises
- 8.1.2. Cloud-Based
- 8.2. Market Analysis, Insights and Forecast - by End-User Industry
- 8.2.1. Aerospace & Defense
- 8.2.2. Automotive
- 8.2.3. Medical
- 8.2.4. Energy & Utilities
- 8.2.5. Other End-User Industries
- 8.1. Market Analysis, Insights and Forecast - by Deployment Model
- 9. Australia and New Zealand Computer Aided Manufacturing Industry Analysis, Insights and Forecast, 2019-2031
- 9.1. Market Analysis, Insights and Forecast - by Deployment Model
- 9.1.1. On-Premises
- 9.1.2. Cloud-Based
- 9.2. Market Analysis, Insights and Forecast - by End-User Industry
- 9.2.1. Aerospace & Defense
- 9.2.2. Automotive
- 9.2.3. Medical
- 9.2.4. Energy & Utilities
- 9.2.5. Other End-User Industries
- 9.1. Market Analysis, Insights and Forecast - by Deployment Model
- 10. Latin America Computer Aided Manufacturing Industry Analysis, Insights and Forecast, 2019-2031
- 10.1. Market Analysis, Insights and Forecast - by Deployment Model
- 10.1.1. On-Premises
- 10.1.2. Cloud-Based
- 10.2. Market Analysis, Insights and Forecast - by End-User Industry
- 10.2.1. Aerospace & Defense
- 10.2.2. Automotive
- 10.2.3. Medical
- 10.2.4. Energy & Utilities
- 10.2.5. Other End-User Industries
- 10.1. Market Analysis, Insights and Forecast - by Deployment Model
- 11. Middle East and Africa Computer Aided Manufacturing Industry Analysis, Insights and Forecast, 2019-2031
- 11.1. Market Analysis, Insights and Forecast - by Deployment Model
- 11.1.1. On-Premises
- 11.1.2. Cloud-Based
- 11.2. Market Analysis, Insights and Forecast - by End-User Industry
- 11.2.1. Aerospace & Defense
- 11.2.2. Automotive
- 11.2.3. Medical
- 11.2.4. Energy & Utilities
- 11.2.5. Other End-User Industries
- 11.1. Market Analysis, Insights and Forecast - by Deployment Model
- 12. North America Computer Aided Manufacturing Industry Analysis, Insights and Forecast, 2019-2031
- 12.1. Market Analysis, Insights and Forecast - By Country/Sub-region
- 12.1.1 United States
- 12.1.2 Canada
- 12.1.3 Mexico
- 13. Europe Computer Aided Manufacturing Industry Analysis, Insights and Forecast, 2019-2031
- 13.1. Market Analysis, Insights and Forecast - By Country/Sub-region
- 13.1.1 Germany
- 13.1.2 United Kingdom
- 13.1.3 France
- 13.1.4 Spain
- 13.1.5 Italy
- 13.1.6 Spain
- 13.1.7 Belgium
- 13.1.8 Netherland
- 13.1.9 Nordics
- 13.1.10 Rest of Europe
- 14. Asia Pacific Computer Aided Manufacturing Industry Analysis, Insights and Forecast, 2019-2031
- 14.1. Market Analysis, Insights and Forecast - By Country/Sub-region
- 14.1.1 China
- 14.1.2 Japan
- 14.1.3 India
- 14.1.4 South Korea
- 14.1.5 Southeast Asia
- 14.1.6 Australia
- 14.1.7 Indonesia
- 14.1.8 Phillipes
- 14.1.9 Singapore
- 14.1.10 Thailandc
- 14.1.11 Rest of Asia Pacific
- 15. South America Computer Aided Manufacturing Industry Analysis, Insights and Forecast, 2019-2031
- 15.1. Market Analysis, Insights and Forecast - By Country/Sub-region
- 15.1.1 Brazil
- 15.1.2 Argentina
- 15.1.3 Peru
- 15.1.4 Chile
- 15.1.5 Colombia
- 15.1.6 Ecuador
- 15.1.7 Venezuela
- 15.1.8 Rest of South America
- 16. North America Computer Aided Manufacturing Industry Analysis, Insights and Forecast, 2019-2031
- 16.1. Market Analysis, Insights and Forecast - By Country/Sub-region
- 16.1.1 United States
- 16.1.2 Canada
- 16.1.3 Mexico
- 17. MEA Computer Aided Manufacturing Industry Analysis, Insights and Forecast, 2019-2031
- 17.1. Market Analysis, Insights and Forecast - By Country/Sub-region
- 17.1.1 United Arab Emirates
- 17.1.2 Saudi Arabia
- 17.1.3 South Africa
- 17.1.4 Rest of Middle East and Africa
- 18. Competitive Analysis
- 18.1. Global Market Share Analysis 2024
- 18.2. Company Profiles
- 18.2.1 Dassault Systems
- 18.2.1.1. Overview
- 18.2.1.2. Products
- 18.2.1.3. SWOT Analysis
- 18.2.1.4. Recent Developments
- 18.2.1.5. Financials (Based on Availability)
- 18.2.2 PTC
- 18.2.2.1. Overview
- 18.2.2.2. Products
- 18.2.2.3. SWOT Analysis
- 18.2.2.4. Recent Developments
- 18.2.2.5. Financials (Based on Availability)
- 18.2.3 MecSoft Corporation
- 18.2.3.1. Overview
- 18.2.3.2. Products
- 18.2.3.3. SWOT Analysis
- 18.2.3.4. Recent Developments
- 18.2.3.5. Financials (Based on Availability)
- 18.2.4 Hexagon AB
- 18.2.4.1. Overview
- 18.2.4.2. Products
- 18.2.4.3. SWOT Analysis
- 18.2.4.4. Recent Developments
- 18.2.4.5. Financials (Based on Availability)
- 18.2.5 NTT DATA Corporation
- 18.2.5.1. Overview
- 18.2.5.2. Products
- 18.2.5.3. SWOT Analysis
- 18.2.5.4. Recent Developments
- 18.2.5.5. Financials (Based on Availability)
- 18.2.6 Siemens AG
- 18.2.6.1. Overview
- 18.2.6.2. Products
- 18.2.6.3. SWOT Analysis
- 18.2.6.4. Recent Developments
- 18.2.6.5. Financials (Based on Availability)
- 18.2.7 SolidCAM Ltd
- 18.2.7.1. Overview
- 18.2.7.2. Products
- 18.2.7.3. SWOT Analysis
- 18.2.7.4. Recent Developments
- 18.2.7.5. Financials (Based on Availability)
- 18.2.8 OPEN MIND Technologies AG
- 18.2.8.1. Overview
- 18.2.8.2. Products
- 18.2.8.3. SWOT Analysis
- 18.2.8.4. Recent Developments
- 18.2.8.5. Financials (Based on Availability)
- 18.2.9 Autodesk Inc
- 18.2.9.1. Overview
- 18.2.9.2. Products
- 18.2.9.3. SWOT Analysis
- 18.2.9.4. Recent Developments
- 18.2.9.5. Financials (Based on Availability)
- 18.2.10 3D Systems Inc
- 18.2.10.1. Overview
- 18.2.10.2. Products
- 18.2.10.3. SWOT Analysis
- 18.2.10.4. Recent Developments
- 18.2.10.5. Financials (Based on Availability)
- 18.2.11 BobCAD-CAM
- 18.2.11.1. Overview
- 18.2.11.2. Products
- 18.2.11.3. SWOT Analysis
- 18.2.11.4. Recent Developments
- 18.2.11.5. Financials (Based on Availability)
- 18.2.12 SmartCAMcnc
- 18.2.12.1. Overview
- 18.2.12.2. Products
- 18.2.12.3. SWOT Analysis
- 18.2.12.4. Recent Developments
- 18.2.12.5. Financials (Based on Availability)
- 18.2.13 ZWSOFTCO LTD (Guangzhou)
- 18.2.13.1. Overview
- 18.2.13.2. Products
- 18.2.13.3. SWOT Analysis
- 18.2.13.4. Recent Developments
- 18.2.13.5. Financials (Based on Availability)
- 18.2.14 HCL Technologies Limited
- 18.2.14.1. Overview
- 18.2.14.2. Products
- 18.2.14.3. SWOT Analysis
- 18.2.14.4. Recent Developments
- 18.2.14.5. Financials (Based on Availability)
- 18.2.15 CNC Software LLC (Mastercam)
- 18.2.15.1. Overview
- 18.2.15.2. Products
- 18.2.15.3. SWOT Analysis
- 18.2.15.4. Recent Developments
- 18.2.15.5. Financials (Based on Availability)
- 18.2.1 Dassault Systems
List of Figures
- Figure 1: Global Computer Aided Manufacturing Industry Revenue Breakdown (Million, %) by Region 2024 & 2032
- Figure 2: North America Computer Aided Manufacturing Industry Revenue (Million), by Country 2024 & 2032
- Figure 3: North America Computer Aided Manufacturing Industry Revenue Share (%), by Country 2024 & 2032
- Figure 4: Europe Computer Aided Manufacturing Industry Revenue (Million), by Country 2024 & 2032
- Figure 5: Europe Computer Aided Manufacturing Industry Revenue Share (%), by Country 2024 & 2032
- Figure 6: Asia Pacific Computer Aided Manufacturing Industry Revenue (Million), by Country 2024 & 2032
- Figure 7: Asia Pacific Computer Aided Manufacturing Industry Revenue Share (%), by Country 2024 & 2032
- Figure 8: South America Computer Aided Manufacturing Industry Revenue (Million), by Country 2024 & 2032
- Figure 9: South America Computer Aided Manufacturing Industry Revenue Share (%), by Country 2024 & 2032
- Figure 10: North America Computer Aided Manufacturing Industry Revenue (Million), by Country 2024 & 2032
- Figure 11: North America Computer Aided Manufacturing Industry Revenue Share (%), by Country 2024 & 2032
- Figure 12: MEA Computer Aided Manufacturing Industry Revenue (Million), by Country 2024 & 2032
- Figure 13: MEA Computer Aided Manufacturing Industry Revenue Share (%), by Country 2024 & 2032
- Figure 14: North America Computer Aided Manufacturing Industry Revenue (Million), by Deployment Model 2024 & 2032
- Figure 15: North America Computer Aided Manufacturing Industry Revenue Share (%), by Deployment Model 2024 & 2032
- Figure 16: North America Computer Aided Manufacturing Industry Revenue (Million), by End-User Industry 2024 & 2032
- Figure 17: North America Computer Aided Manufacturing Industry Revenue Share (%), by End-User Industry 2024 & 2032
- Figure 18: North America Computer Aided Manufacturing Industry Revenue (Million), by Country 2024 & 2032
- Figure 19: North America Computer Aided Manufacturing Industry Revenue Share (%), by Country 2024 & 2032
- Figure 20: Europe Computer Aided Manufacturing Industry Revenue (Million), by Deployment Model 2024 & 2032
- Figure 21: Europe Computer Aided Manufacturing Industry Revenue Share (%), by Deployment Model 2024 & 2032
- Figure 22: Europe Computer Aided Manufacturing Industry Revenue (Million), by End-User Industry 2024 & 2032
- Figure 23: Europe Computer Aided Manufacturing Industry Revenue Share (%), by End-User Industry 2024 & 2032
- Figure 24: Europe Computer Aided Manufacturing Industry Revenue (Million), by Country 2024 & 2032
- Figure 25: Europe Computer Aided Manufacturing Industry Revenue Share (%), by Country 2024 & 2032
- Figure 26: Asia Computer Aided Manufacturing Industry Revenue (Million), by Deployment Model 2024 & 2032
- Figure 27: Asia Computer Aided Manufacturing Industry Revenue Share (%), by Deployment Model 2024 & 2032
- Figure 28: Asia Computer Aided Manufacturing Industry Revenue (Million), by End-User Industry 2024 & 2032
- Figure 29: Asia Computer Aided Manufacturing Industry Revenue Share (%), by End-User Industry 2024 & 2032
- Figure 30: Asia Computer Aided Manufacturing Industry Revenue (Million), by Country 2024 & 2032
- Figure 31: Asia Computer Aided Manufacturing Industry Revenue Share (%), by Country 2024 & 2032
- Figure 32: Australia and New Zealand Computer Aided Manufacturing Industry Revenue (Million), by Deployment Model 2024 & 2032
- Figure 33: Australia and New Zealand Computer Aided Manufacturing Industry Revenue Share (%), by Deployment Model 2024 & 2032
- Figure 34: Australia and New Zealand Computer Aided Manufacturing Industry Revenue (Million), by End-User Industry 2024 & 2032
- Figure 35: Australia and New Zealand Computer Aided Manufacturing Industry Revenue Share (%), by End-User Industry 2024 & 2032
- Figure 36: Australia and New Zealand Computer Aided Manufacturing Industry Revenue (Million), by Country 2024 & 2032
- Figure 37: Australia and New Zealand Computer Aided Manufacturing Industry Revenue Share (%), by Country 2024 & 2032
- Figure 38: Latin America Computer Aided Manufacturing Industry Revenue (Million), by Deployment Model 2024 & 2032
- Figure 39: Latin America Computer Aided Manufacturing Industry Revenue Share (%), by Deployment Model 2024 & 2032
- Figure 40: Latin America Computer Aided Manufacturing Industry Revenue (Million), by End-User Industry 2024 & 2032
- Figure 41: Latin America Computer Aided Manufacturing Industry Revenue Share (%), by End-User Industry 2024 & 2032
- Figure 42: Latin America Computer Aided Manufacturing Industry Revenue (Million), by Country 2024 & 2032
- Figure 43: Latin America Computer Aided Manufacturing Industry Revenue Share (%), by Country 2024 & 2032
- Figure 44: Middle East and Africa Computer Aided Manufacturing Industry Revenue (Million), by Deployment Model 2024 & 2032
- Figure 45: Middle East and Africa Computer Aided Manufacturing Industry Revenue Share (%), by Deployment Model 2024 & 2032
- Figure 46: Middle East and Africa Computer Aided Manufacturing Industry Revenue (Million), by End-User Industry 2024 & 2032
- Figure 47: Middle East and Africa Computer Aided Manufacturing Industry Revenue Share (%), by End-User Industry 2024 & 2032
- Figure 48: Middle East and Africa Computer Aided Manufacturing Industry Revenue (Million), by Country 2024 & 2032
- Figure 49: Middle East and Africa Computer Aided Manufacturing Industry Revenue Share (%), by Country 2024 & 2032
List of Tables
- Table 1: Global Computer Aided Manufacturing Industry Revenue Million Forecast, by Region 2019 & 2032
- Table 2: Global Computer Aided Manufacturing Industry Revenue Million Forecast, by Deployment Model 2019 & 2032
- Table 3: Global Computer Aided Manufacturing Industry Revenue Million Forecast, by End-User Industry 2019 & 2032
- Table 4: Global Computer Aided Manufacturing Industry Revenue Million Forecast, by Region 2019 & 2032
- Table 5: Global Computer Aided Manufacturing Industry Revenue Million Forecast, by Country 2019 & 2032
- Table 6: United States Computer Aided Manufacturing Industry Revenue (Million) Forecast, by Application 2019 & 2032
- Table 7: Canada Computer Aided Manufacturing Industry Revenue (Million) Forecast, by Application 2019 & 2032
- Table 8: Mexico Computer Aided Manufacturing Industry Revenue (Million) Forecast, by Application 2019 & 2032
- Table 9: Global Computer Aided Manufacturing Industry Revenue Million Forecast, by Country 2019 & 2032
- Table 10: Germany Computer Aided Manufacturing Industry Revenue (Million) Forecast, by Application 2019 & 2032
- Table 11: United Kingdom Computer Aided Manufacturing Industry Revenue (Million) Forecast, by Application 2019 & 2032
- Table 12: France Computer Aided Manufacturing Industry Revenue (Million) Forecast, by Application 2019 & 2032
- Table 13: Spain Computer Aided Manufacturing Industry Revenue (Million) Forecast, by Application 2019 & 2032
- Table 14: Italy Computer Aided Manufacturing Industry Revenue (Million) Forecast, by Application 2019 & 2032
- Table 15: Spain Computer Aided Manufacturing Industry Revenue (Million) Forecast, by Application 2019 & 2032
- Table 16: Belgium Computer Aided Manufacturing Industry Revenue (Million) Forecast, by Application 2019 & 2032
- Table 17: Netherland Computer Aided Manufacturing Industry Revenue (Million) Forecast, by Application 2019 & 2032
- Table 18: Nordics Computer Aided Manufacturing Industry Revenue (Million) Forecast, by Application 2019 & 2032
- Table 19: Rest of Europe Computer Aided Manufacturing Industry Revenue (Million) Forecast, by Application 2019 & 2032
- Table 20: Global Computer Aided Manufacturing Industry Revenue Million Forecast, by Country 2019 & 2032
- Table 21: China Computer Aided Manufacturing Industry Revenue (Million) Forecast, by Application 2019 & 2032
- Table 22: Japan Computer Aided Manufacturing Industry Revenue (Million) Forecast, by Application 2019 & 2032
- Table 23: India Computer Aided Manufacturing Industry Revenue (Million) Forecast, by Application 2019 & 2032
- Table 24: South Korea Computer Aided Manufacturing Industry Revenue (Million) Forecast, by Application 2019 & 2032
- Table 25: Southeast Asia Computer Aided Manufacturing Industry Revenue (Million) Forecast, by Application 2019 & 2032
- Table 26: Australia Computer Aided Manufacturing Industry Revenue (Million) Forecast, by Application 2019 & 2032
- Table 27: Indonesia Computer Aided Manufacturing Industry Revenue (Million) Forecast, by Application 2019 & 2032
- Table 28: Phillipes Computer Aided Manufacturing Industry Revenue (Million) Forecast, by Application 2019 & 2032
- Table 29: Singapore Computer Aided Manufacturing Industry Revenue (Million) Forecast, by Application 2019 & 2032
- Table 30: Thailandc Computer Aided Manufacturing Industry Revenue (Million) Forecast, by Application 2019 & 2032
- Table 31: Rest of Asia Pacific Computer Aided Manufacturing Industry Revenue (Million) Forecast, by Application 2019 & 2032
- Table 32: Global Computer Aided Manufacturing Industry Revenue Million Forecast, by Country 2019 & 2032
- Table 33: Brazil Computer Aided Manufacturing Industry Revenue (Million) Forecast, by Application 2019 & 2032
- Table 34: Argentina Computer Aided Manufacturing Industry Revenue (Million) Forecast, by Application 2019 & 2032
- Table 35: Peru Computer Aided Manufacturing Industry Revenue (Million) Forecast, by Application 2019 & 2032
- Table 36: Chile Computer Aided Manufacturing Industry Revenue (Million) Forecast, by Application 2019 & 2032
- Table 37: Colombia Computer Aided Manufacturing Industry Revenue (Million) Forecast, by Application 2019 & 2032
- Table 38: Ecuador Computer Aided Manufacturing Industry Revenue (Million) Forecast, by Application 2019 & 2032
- Table 39: Venezuela Computer Aided Manufacturing Industry Revenue (Million) Forecast, by Application 2019 & 2032
- Table 40: Rest of South America Computer Aided Manufacturing Industry Revenue (Million) Forecast, by Application 2019 & 2032
- Table 41: Global Computer Aided Manufacturing Industry Revenue Million Forecast, by Country 2019 & 2032
- Table 42: United States Computer Aided Manufacturing Industry Revenue (Million) Forecast, by Application 2019 & 2032
- Table 43: Canada Computer Aided Manufacturing Industry Revenue (Million) Forecast, by Application 2019 & 2032
- Table 44: Mexico Computer Aided Manufacturing Industry Revenue (Million) Forecast, by Application 2019 & 2032
- Table 45: Global Computer Aided Manufacturing Industry Revenue Million Forecast, by Country 2019 & 2032
- Table 46: United Arab Emirates Computer Aided Manufacturing Industry Revenue (Million) Forecast, by Application 2019 & 2032
- Table 47: Saudi Arabia Computer Aided Manufacturing Industry Revenue (Million) Forecast, by Application 2019 & 2032
- Table 48: South Africa Computer Aided Manufacturing Industry Revenue (Million) Forecast, by Application 2019 & 2032
- Table 49: Rest of Middle East and Africa Computer Aided Manufacturing Industry Revenue (Million) Forecast, by Application 2019 & 2032
- Table 50: Global Computer Aided Manufacturing Industry Revenue Million Forecast, by Deployment Model 2019 & 2032
- Table 51: Global Computer Aided Manufacturing Industry Revenue Million Forecast, by End-User Industry 2019 & 2032
- Table 52: Global Computer Aided Manufacturing Industry Revenue Million Forecast, by Country 2019 & 2032
- Table 53: United States Computer Aided Manufacturing Industry Revenue (Million) Forecast, by Application 2019 & 2032
- Table 54: Canada Computer Aided Manufacturing Industry Revenue (Million) Forecast, by Application 2019 & 2032
- Table 55: Global Computer Aided Manufacturing Industry Revenue Million Forecast, by Deployment Model 2019 & 2032
- Table 56: Global Computer Aided Manufacturing Industry Revenue Million Forecast, by End-User Industry 2019 & 2032
- Table 57: Global Computer Aided Manufacturing Industry Revenue Million Forecast, by Country 2019 & 2032
- Table 58: Germany Computer Aided Manufacturing Industry Revenue (Million) Forecast, by Application 2019 & 2032
- Table 59: Switzerland Computer Aided Manufacturing Industry Revenue (Million) Forecast, by Application 2019 & 2032
- Table 60: Spain Computer Aided Manufacturing Industry Revenue (Million) Forecast, by Application 2019 & 2032
- Table 61: Austria Computer Aided Manufacturing Industry Revenue (Million) Forecast, by Application 2019 & 2032
- Table 62: Belgium Computer Aided Manufacturing Industry Revenue (Million) Forecast, by Application 2019 & 2032
- Table 63: Netherlands Computer Aided Manufacturing Industry Revenue (Million) Forecast, by Application 2019 & 2032
- Table 64: United Kingdom Computer Aided Manufacturing Industry Revenue (Million) Forecast, by Application 2019 & 2032
- Table 65: France Computer Aided Manufacturing Industry Revenue (Million) Forecast, by Application 2019 & 2032
- Table 66: Italy Computer Aided Manufacturing Industry Revenue (Million) Forecast, by Application 2019 & 2032
- Table 67: Sweden Computer Aided Manufacturing Industry Revenue (Million) Forecast, by Application 2019 & 2032
- Table 68: Poland Computer Aided Manufacturing Industry Revenue (Million) Forecast, by Application 2019 & 2032
- Table 69: Global Computer Aided Manufacturing Industry Revenue Million Forecast, by Deployment Model 2019 & 2032
- Table 70: Global Computer Aided Manufacturing Industry Revenue Million Forecast, by End-User Industry 2019 & 2032
- Table 71: Global Computer Aided Manufacturing Industry Revenue Million Forecast, by Country 2019 & 2032
- Table 72: China Computer Aided Manufacturing Industry Revenue (Million) Forecast, by Application 2019 & 2032
- Table 73: Japan Computer Aided Manufacturing Industry Revenue (Million) Forecast, by Application 2019 & 2032
- Table 74: South Korea Computer Aided Manufacturing Industry Revenue (Million) Forecast, by Application 2019 & 2032
- Table 75: India Computer Aided Manufacturing Industry Revenue (Million) Forecast, by Application 2019 & 2032
- Table 76: Global Computer Aided Manufacturing Industry Revenue Million Forecast, by Deployment Model 2019 & 2032
- Table 77: Global Computer Aided Manufacturing Industry Revenue Million Forecast, by End-User Industry 2019 & 2032
- Table 78: Global Computer Aided Manufacturing Industry Revenue Million Forecast, by Country 2019 & 2032
- Table 79: Global Computer Aided Manufacturing Industry Revenue Million Forecast, by Deployment Model 2019 & 2032
- Table 80: Global Computer Aided Manufacturing Industry Revenue Million Forecast, by End-User Industry 2019 & 2032
- Table 81: Global Computer Aided Manufacturing Industry Revenue Million Forecast, by Country 2019 & 2032
- Table 82: Brazil Computer Aided Manufacturing Industry Revenue (Million) Forecast, by Application 2019 & 2032
- Table 83: Mexico Computer Aided Manufacturing Industry Revenue (Million) Forecast, by Application 2019 & 2032
- Table 84: Global Computer Aided Manufacturing Industry Revenue Million Forecast, by Deployment Model 2019 & 2032
- Table 85: Global Computer Aided Manufacturing Industry Revenue Million Forecast, by End-User Industry 2019 & 2032
- Table 86: Global Computer Aided Manufacturing Industry Revenue Million Forecast, by Country 2019 & 2032
- Table 87: United Arab Emirates Computer Aided Manufacturing Industry Revenue (Million) Forecast, by Application 2019 & 2032
- Table 88: Saudi Arabia Computer Aided Manufacturing Industry Revenue (Million) Forecast, by Application 2019 & 2032
- Table 89: South Africa Computer Aided Manufacturing Industry Revenue (Million) Forecast, by Application 2019 & 2032
Frequently Asked Questions
1. What is the projected Compound Annual Growth Rate (CAGR) of the Computer Aided Manufacturing Industry?
The projected CAGR is approximately 8.13%.
2. Which companies are prominent players in the Computer Aided Manufacturing Industry?
Key companies in the market include Dassault Systems, PTC, MecSoft Corporation, Hexagon AB, NTT DATA Corporation, Siemens AG, SolidCAM Ltd, OPEN MIND Technologies AG, Autodesk Inc, 3D Systems Inc, BobCAD-CAM, SmartCAMcnc , ZWSOFTCO LTD (Guangzhou), HCL Technologies Limited, CNC Software LLC (Mastercam).
3. What are the main segments of the Computer Aided Manufacturing Industry?
The market segments include Deployment Model, End-User Industry.
4. Can you provide details about the market size?
The market size is estimated to be USD 3.94 Million as of 2022.
5. What are some drivers contributing to market growth?
Increasing Adoption of Industry 4.; Growing Utilization of CAM Software in the Packaging Machinery Sector.
6. What are the notable trends driving market growth?
Automotive is Expected to Hold a Major Market Share.
7. Are there any restraints impacting market growth?
Wide Availability of Open Source CAM Software.
8. Can you provide examples of recent developments in the market?
November 2023 - Microlight3D launched Luminis software, a computer-aided manufacturing (CAM) software built explicitly for the microFAB-3D. Luminis combines the ability to prepare objects for printing and control the printer, aiding to 3D print objects to 100× smaller than a strand of hair. Luminis features 3D visualization for the capturing of 40 fps - 60 fps data under the same load. The software enables printing prototypes of technologies used in micro-robotics, microfluidics, micro-optics, and cell culture and tissue engineering.
9. What pricing options are available for accessing the report?
Pricing options include single-user, multi-user, and enterprise licenses priced at USD 4750, USD 5250, and USD 8750 respectively.
10. Is the market size provided in terms of value or volume?
The market size is provided in terms of value, measured in Million.
11. Are there any specific market keywords associated with the report?
Yes, the market keyword associated with the report is "Computer Aided Manufacturing Industry," which aids in identifying and referencing the specific market segment covered.
12. How do I determine which pricing option suits my needs best?
The pricing options vary based on user requirements and access needs. Individual users may opt for single-user licenses, while businesses requiring broader access may choose multi-user or enterprise licenses for cost-effective access to the report.
13. Are there any additional resources or data provided in the Computer Aided Manufacturing Industry report?
While the report offers comprehensive insights, it's advisable to review the specific contents or supplementary materials provided to ascertain if additional resources or data are available.
14. How can I stay updated on further developments or reports in the Computer Aided Manufacturing Industry?
To stay informed about further developments, trends, and reports in the Computer Aided Manufacturing Industry, consider subscribing to industry newsletters, following relevant companies and organizations, or regularly checking reputable industry news sources and publications.
Methodology
Step 1 - Identification of Relevant Samples Size from Population Database


Step 2 - Approaches for Defining Global Market Size (Value, Volume* & Price*)

Note*: In applicable scenarios
Step 3 - Data Sources
Primary Research
- Web Analytics
- Survey Reports
- Research Institute
- Latest Research Reports
- Opinion Leaders
Secondary Research
- Annual Reports
- White Paper
- Latest Press Release
- Industry Association
- Paid Database
- Investor Presentations

Step 4 - Data Triangulation
Involves using different sources of information in order to increase the validity of a study
These sources are likely to be stakeholders in a program - participants, other researchers, program staff, other community members, and so on.
Then we put all data in single framework & apply various statistical tools to find out the dynamic on the market.
During the analysis stage, feedback from the stakeholder groups would be compared to determine areas of agreement as well as areas of divergence


