Regional Analysis of Blockchain in Sports Market Growth Trajectories

Blockchain in Sports Market by Source Type (Media Rights, Gate/Ticket Sales Revenues, Merchandising, Sponsorships), by North America, by Europe, by Asia Pacific, by Latin America, by Middle East and Africa Forecast 2025-2033

Jul 21 2025
Base Year: 2024

234 Pages
Main Logo

Regional Analysis of Blockchain in Sports Market Growth Trajectories


Home
Industries
Technology, Media and Telecom
sponsor image
sponsor image
sponsor image
sponsor image
sponsor image
sponsor image
sponsor image
sponsor image
sponsor image
sponsor image
sponsor image
sponsor image
sponsor image
sponsor image
sponsor image
sponsor image
sponsor image
sponsor image
sponsor image
sponsor image

Tailored for you

  • In-depth Analysis Tailored to Specified Regions or Segments
  • Company Profiles Customized to User Preferences
  • Comprehensive Insights Focused on Specific Segments or Regions
  • Customized Evaluation of Competitive Landscape to Meet Your Needs
  • Tailored Customization to Address Other Specific Requirements
Ask for customization


Key Insights

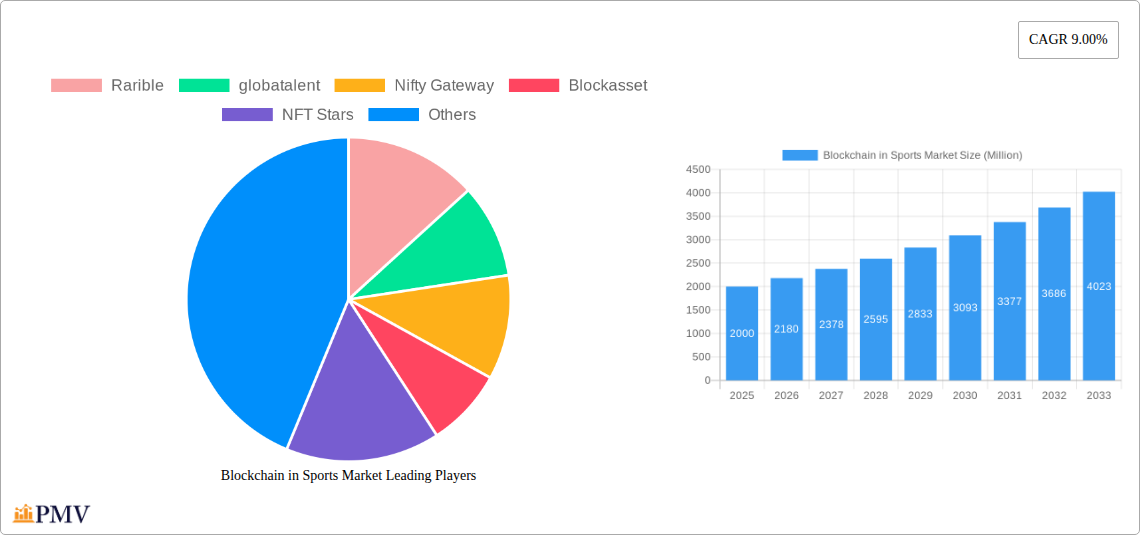
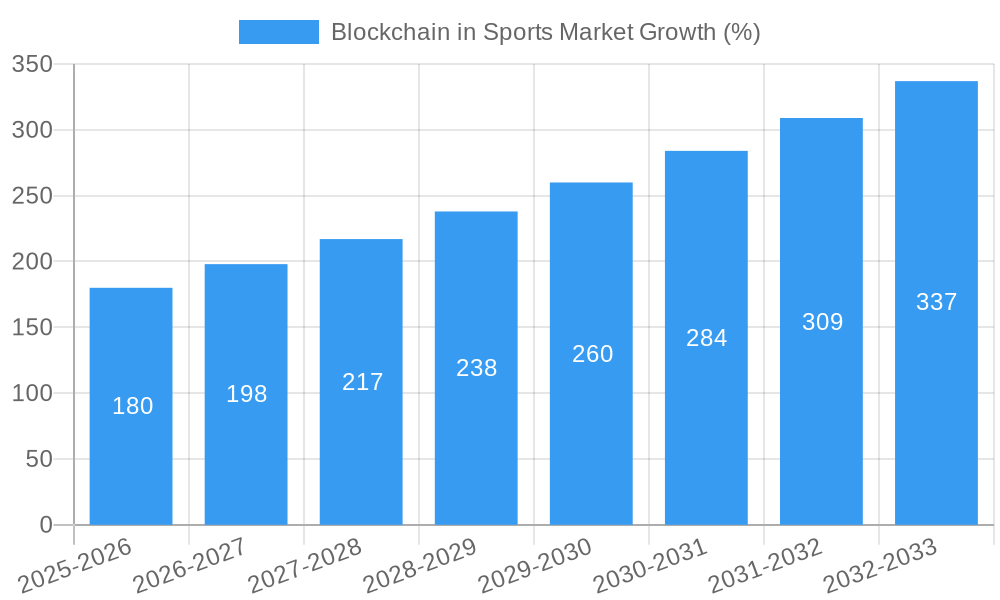
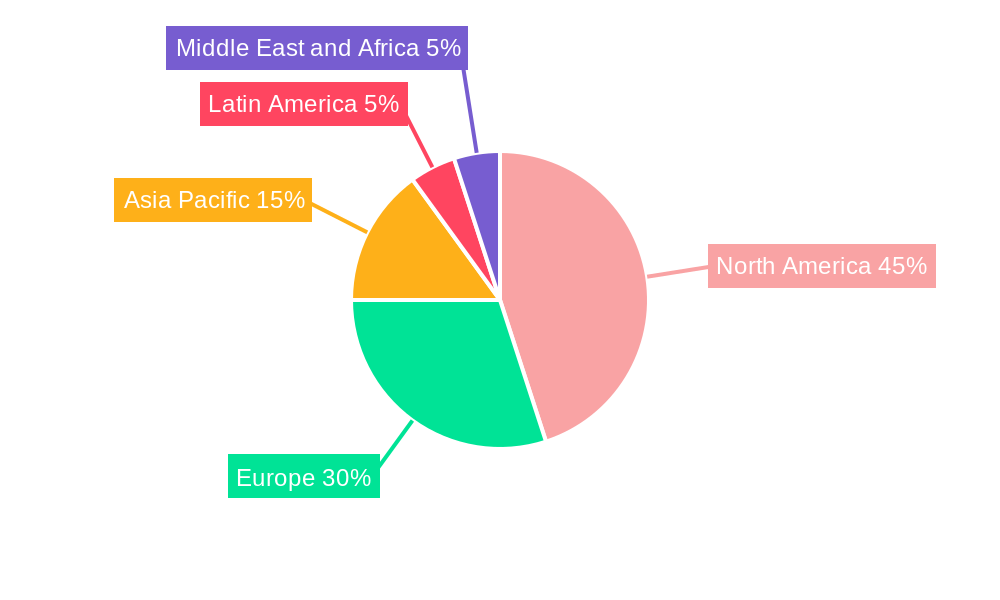
The Blockchain in Sports market is experiencing rapid growth, fueled by increasing adoption of NFTs (Non-Fungible Tokens) and blockchain technology within the sports industry. The market's value, currently estimated at approximately $2 billion in 2025, is projected to achieve a Compound Annual Growth Rate (CAGR) of 9% from 2025 to 2033. This expansion is driven by several factors. Firstly, the increasing popularity of digital collectibles, including player cards and game moments represented as NFTs, is creating new revenue streams for sports organizations and providing fans with unique ownership opportunities. Secondly, the enhanced security and transparency offered by blockchain technology are streamlining processes like ticket sales and sponsorship management, reducing fraud and improving efficiency. Thirdly, the emergence of blockchain-based platforms for fan engagement and community building is fostering deeper connections between teams and their supporters. The market is segmented by revenue source, including media rights, gate/ticket sales, merchandising, and sponsorships, with NFTs significantly impacting each segment. Companies like Rarible, Dapper Labs (NBA Top Shot), Sorare, and OpenSea are key players in this evolving landscape, developing innovative platforms and facilitating NFT transactions. Geographical growth is anticipated across all regions, with North America and Europe currently holding the largest market shares, followed by the Asia-Pacific region experiencing significant growth potential.

The restraints to market growth include regulatory uncertainty surrounding NFTs and digital assets, technological limitations impacting scalability and transaction speeds, and the educational gap amongst both sports organizations and fans regarding the use and potential of blockchain technology. However, overcoming these challenges will be critical for unlocking the full potential of the blockchain in sports market. Continued technological advancements, clearer regulatory frameworks, and increased user education will propel this market toward a future where blockchain technology is seamlessly integrated across all aspects of the sports industry. The forecast period of 2025-2033 represents a substantial opportunity for both established sports organizations and emerging blockchain companies.

Blockchain in Sports Market Research Report - Market Size, Growth & Forecast

Blockchain in Sports Market: A Comprehensive Report (2019-2033)

This in-depth report provides a comprehensive analysis of the Blockchain in Sports Market, offering invaluable insights for industry stakeholders, investors, and strategists. Covering the period 2019-2033, with a focus on 2025, this report meticulously examines market structure, competitive dynamics, technological advancements, and future growth potential. The market is projected to reach xx Million by 2033, exhibiting a CAGR of xx% during the forecast period (2025-2033).

Blockchain in Sports Market Market Structure & Competitive Dynamics

The Blockchain in Sports Market exhibits a moderately concentrated structure, with key players such as Dapper Labs (NBA Top Shot), Sorare, and OpenSea holding significant market share. The market's innovative ecosystem is characterized by continuous development of NFT platforms, blockchain-based ticketing solutions, and decentralized applications (dApps) focused on fan engagement. Regulatory frameworks surrounding blockchain technology and digital assets are still evolving, posing both opportunities and challenges. Product substitutes are limited, given the unique attributes of blockchain technology in ensuring transparency and immutability. End-user trends show increasing adoption of NFTs and blockchain-based solutions by sports fans and organizations seeking enhanced engagement and revenue generation. M&A activity in the sector is substantial, with deal values exceeding xx Million in the past year, reflecting the growing market maturity. For instance, the acquisition of xx company by yy company, valued at xx Million, signifies the consolidation trend within the market.

  • Market Concentration: Moderately concentrated, with top players holding xx% market share.
  • M&A Activity: Significant, with deal values exceeding xx Million annually.
  • Regulatory Framework: Evolving, presenting both opportunities and challenges.
  • Innovation Ecosystem: Rapidly evolving with continuous new platform launches and dApp development.

Blockchain in Sports Market Industry Trends & Insights

The Blockchain in Sports Market is experiencing exponential growth driven by several key factors. The increasing popularity of NFTs, fueled by celebrity endorsements and media attention, is a primary driver. Technological disruptions like the evolution of metaverse platforms are further accelerating adoption. Consumers are increasingly attracted to the unique ownership and authenticity that blockchain offers, particularly in the context of digital collectibles and memorabilia. The competitive dynamics are intensely innovative, with new platforms constantly emerging and established players expanding their capabilities. The market penetration of blockchain-based solutions in sports is still relatively low (currently estimated at xx%), but the growth trajectory points toward significant expansion in the coming years. The integration of blockchain into ticketing systems, media rights management, and fan engagement programs promises to unlock new revenue streams and revolutionize the fan experience.

Blockchain in Sports Market Growth

Dominant Markets & Segments in Blockchain in Sports Market

The North American market currently dominates the Blockchain in Sports Market, largely driven by the early adoption of NFT marketplaces and the significant presence of major sports leagues. Within the segment breakdown by source type, the Media Rights segment currently holds the largest market share (xx%), followed by Merchandising (xx%), Sponsorships (xx%), and Gate/Ticket Sales Revenues (xx%).

  • North American Dominance: Driven by early NFT adoption and major league involvement.
  • Media Rights Segment: Largest market share due to high value of digital rights.
  • Key Drivers (North America): Strong digital infrastructure, established sports leagues, early investor interest.
  • Key Drivers (Media Rights): High value of digital content, growing demand for exclusive digital collectibles, and the potential for enhanced fan engagement through interactive NFTs.

Blockchain in Sports Market Product Innovations

Recent product innovations include the emergence of blockchain-based ticketing systems that offer fraud-proof tickets, enhance security, and prevent scalping. Platforms offering fractional ownership of digital assets, allowing more fans to access expensive collectibles, are also gaining popularity. This trend is matched by the rise of interactive NFTs which provide additional utility and value beyond mere ownership, enhancing the fan engagement opportunities for sports organizations. These innovations enhance the user experience and drive market growth.

Report Segmentation & Scope

This report segments the Blockchain in Sports Market by source type:

  • Media Rights: This segment encompasses the use of blockchain for managing and distributing digital media rights, including highlights, game replays, and exclusive content, with projected growth of xx% during the forecast period. The competitive landscape is fiercely contested with several companies competing to provide efficient rights management systems.
  • Gate/Ticket Sales Revenues: Blockchain technology streamlines ticketing processes, reducing fraud and enhancing security, with estimated growth of xx% in the forecast period. Competitive dynamics are shaped by the need to integrate with existing ticketing infrastructure.
  • Merchandising: This segment focuses on the sale of digital collectibles and NFTs, with anticipated growth of xx% during the forecast period. Competition is high, with many platforms offering similar services.
  • Sponsorships: Blockchain enables innovative sponsorship activations, creating new revenue streams for sports organizations and brands, showing expected growth of xx% in the forecast period. The key players in this segment are those who can successfully connect brands to the blockchain-enabled fan base.

Key Drivers of Blockchain in Sports Market Growth

Several factors drive the growth of the Blockchain in Sports Market. Firstly, technological advancements like improved scalability and interoperability of blockchain networks are lowering barriers to entry. Secondly, increasing fan engagement and monetization opportunities incentivize sports organizations to embrace blockchain solutions. Finally, regulatory clarity, where achieved, is accelerating adoption. The FIFA's partnership with Algorand, for example, provides a significant boost to the market.

Challenges in the Blockchain in Sports Market Sector

The Blockchain in Sports Market faces challenges, including regulatory uncertainty in certain jurisdictions which can stifle innovation. High initial investment costs for blockchain infrastructure can also hinder adoption. Furthermore, the need for improved user education and awareness remains crucial to drive wider acceptance of blockchain-based solutions amongst sports fans. Scalability issues of certain blockchain networks can also impact the user experience, hindering broader adoption.

Leading Players in the Blockchain in Sports Market Market

  • Rarible
  • globatalent
  • Nifty Gateway
  • Blockasset
  • NFT Stars
  • Eternal
  • Flow
  • Sorare
  • Algorand
  • OpenSea
  • NBA Top Shot
  • Dapper Labs

Key Developments in Blockchain in Sports Market Sector

  • September 2022: FIFA launches FIFA+ Collect, a platform for affordable digital collectibles powered by Algorand. This significantly expands the market reach and accessibility of blockchain-based sports collectibles.
  • May 2022: FIFA and Algorand announce a multi-year sponsorship and technical partnership, solidifying Algorand's position in the sports blockchain ecosystem and boosting market confidence.

Strategic Blockchain in Sports Market Market Outlook

The future of the Blockchain in Sports Market is exceptionally bright. The convergence of blockchain technology with the metaverse and the growing sophistication of NFTs promises to create new revenue streams and innovative fan engagement opportunities. Strategic partnerships between sports organizations, blockchain technology providers, and brands will further fuel market expansion. The continued development of user-friendly interfaces and improved scalability will be crucial for driving mass adoption. The market is poised for significant growth, driven by technological innovation and increasing consumer demand.

Blockchain in Sports Market Segmentation

  • 1. Source Type
    • 1.1. Media Rights
    • 1.2. Gate/Ticket Sales Revenues
    • 1.3. Merchandising
    • 1.4. Sponsorships

Blockchain in Sports Market Segmentation By Geography

  • 1. North America
  • 2. Europe
  • 3. Asia Pacific
  • 4. Latin America
  • 5. Middle East and Africa
Blockchain in Sports Market Regional Share


Blockchain in Sports Market REPORT HIGHLIGHTS

AspectsDetails
Study Period 2019-2033
Base Year 2024
Estimated Year 2025
Forecast Period2025-2033
Historical Period2019-2024
Growth RateCAGR of 9.00% from 2019-2033
Segmentation
    • By Source Type
      • Media Rights
      • Gate/Ticket Sales Revenues
      • Merchandising
      • Sponsorships
  • By Geography
    • North America
    • Europe
    • Asia Pacific
    • Latin America
    • Middle East and Africa


Table of Contents

  1. 1. Introduction
    • 1.1. Research Scope
    • 1.2. Market Segmentation
    • 1.3. Research Methodology
    • 1.4. Definitions and Assumptions
  2. 2. Executive Summary
    • 2.1. Introduction
  3. 3. Market Dynamics
    • 3.1. Introduction
      • 3.2. Market Drivers
        • 3.2.1. Aggressive Spending by Venture Capitalists
      • 3.3. Market Restrains
        • 3.3.1. Scalability Constraints
      • 3.4. Market Trends
        • 3.4.1. Managing fans engagment platfroms using blockchain is expected to dive growth for the market
  4. 4. Market Factor Analysis
    • 4.1. Porters Five Forces
    • 4.2. Supply/Value Chain
    • 4.3. PESTEL analysis
    • 4.4. Market Entropy
    • 4.5. Patent/Trademark Analysis
  5. 5. Global Blockchain in Sports Market Analysis, Insights and Forecast, 2019-2031
    • 5.1. Market Analysis, Insights and Forecast - by Source Type
      • 5.1.1. Media Rights
      • 5.1.2. Gate/Ticket Sales Revenues
      • 5.1.3. Merchandising
      • 5.1.4. Sponsorships
    • 5.2. Market Analysis, Insights and Forecast - by Region
      • 5.2.1. North America
      • 5.2.2. Europe
      • 5.2.3. Asia Pacific
      • 5.2.4. Latin America
      • 5.2.5. Middle East and Africa
  6. 6. North America Blockchain in Sports Market Analysis, Insights and Forecast, 2019-2031
    • 6.1. Market Analysis, Insights and Forecast - by Source Type
      • 6.1.1. Media Rights
      • 6.1.2. Gate/Ticket Sales Revenues
      • 6.1.3. Merchandising
      • 6.1.4. Sponsorships
  7. 7. Europe Blockchain in Sports Market Analysis, Insights and Forecast, 2019-2031
    • 7.1. Market Analysis, Insights and Forecast - by Source Type
      • 7.1.1. Media Rights
      • 7.1.2. Gate/Ticket Sales Revenues
      • 7.1.3. Merchandising
      • 7.1.4. Sponsorships
  8. 8. Asia Pacific Blockchain in Sports Market Analysis, Insights and Forecast, 2019-2031
    • 8.1. Market Analysis, Insights and Forecast - by Source Type
      • 8.1.1. Media Rights
      • 8.1.2. Gate/Ticket Sales Revenues
      • 8.1.3. Merchandising
      • 8.1.4. Sponsorships
  9. 9. Latin America Blockchain in Sports Market Analysis, Insights and Forecast, 2019-2031
    • 9.1. Market Analysis, Insights and Forecast - by Source Type
      • 9.1.1. Media Rights
      • 9.1.2. Gate/Ticket Sales Revenues
      • 9.1.3. Merchandising
      • 9.1.4. Sponsorships
  10. 10. Middle East and Africa Blockchain in Sports Market Analysis, Insights and Forecast, 2019-2031
    • 10.1. Market Analysis, Insights and Forecast - by Source Type
      • 10.1.1. Media Rights
      • 10.1.2. Gate/Ticket Sales Revenues
      • 10.1.3. Merchandising
      • 10.1.4. Sponsorships
  11. 11. North America Blockchain in Sports Market Analysis, Insights and Forecast, 2019-2031
      • 11.1. Market Analysis, Insights and Forecast - By Country/Sub-region
        • 11.1.1.
  12. 12. Europe Blockchain in Sports Market Analysis, Insights and Forecast, 2019-2031
      • 12.1. Market Analysis, Insights and Forecast - By Country/Sub-region
        • 12.1.1.
  13. 13. Asia Pacific Blockchain in Sports Market Analysis, Insights and Forecast, 2019-2031
      • 13.1. Market Analysis, Insights and Forecast - By Country/Sub-region
        • 13.1.1.
  14. 14. Latin America Blockchain in Sports Market Analysis, Insights and Forecast, 2019-2031
      • 14.1. Market Analysis, Insights and Forecast - By Country/Sub-region
        • 14.1.1.
  15. 15. Middle East and Africa Blockchain in Sports Market Analysis, Insights and Forecast, 2019-2031
      • 15.1. Market Analysis, Insights and Forecast - By Country/Sub-region
        • 15.1.1.
  16. 16. Competitive Analysis
    • 16.1. Global Market Share Analysis 2024
      • 16.2. Company Profiles
        • 16.2.1 Rarible
          • 16.2.1.1. Overview
          • 16.2.1.2. Products
          • 16.2.1.3. SWOT Analysis
          • 16.2.1.4. Recent Developments
          • 16.2.1.5. Financials (Based on Availability)
        • 16.2.2 globatalent
          • 16.2.2.1. Overview
          • 16.2.2.2. Products
          • 16.2.2.3. SWOT Analysis
          • 16.2.2.4. Recent Developments
          • 16.2.2.5. Financials (Based on Availability)
        • 16.2.3 Nifty Gateway
          • 16.2.3.1. Overview
          • 16.2.3.2. Products
          • 16.2.3.3. SWOT Analysis
          • 16.2.3.4. Recent Developments
          • 16.2.3.5. Financials (Based on Availability)
        • 16.2.4 Blockasset
          • 16.2.4.1. Overview
          • 16.2.4.2. Products
          • 16.2.4.3. SWOT Analysis
          • 16.2.4.4. Recent Developments
          • 16.2.4.5. Financials (Based on Availability)
        • 16.2.5 NFT Stars
          • 16.2.5.1. Overview
          • 16.2.5.2. Products
          • 16.2.5.3. SWOT Analysis
          • 16.2.5.4. Recent Developments
          • 16.2.5.5. Financials (Based on Availability)
        • 16.2.6 Eternal
          • 16.2.6.1. Overview
          • 16.2.6.2. Products
          • 16.2.6.3. SWOT Analysis
          • 16.2.6.4. Recent Developments
          • 16.2.6.5. Financials (Based on Availability)
        • 16.2.7 Flow
          • 16.2.7.1. Overview
          • 16.2.7.2. Products
          • 16.2.7.3. SWOT Analysis
          • 16.2.7.4. Recent Developments
          • 16.2.7.5. Financials (Based on Availability)
        • 16.2.8 Sorare
          • 16.2.8.1. Overview
          • 16.2.8.2. Products
          • 16.2.8.3. SWOT Analysis
          • 16.2.8.4. Recent Developments
          • 16.2.8.5. Financials (Based on Availability)
        • 16.2.9 Algorand
          • 16.2.9.1. Overview
          • 16.2.9.2. Products
          • 16.2.9.3. SWOT Analysis
          • 16.2.9.4. Recent Developments
          • 16.2.9.5. Financials (Based on Availability)
        • 16.2.10 OpenSea
          • 16.2.10.1. Overview
          • 16.2.10.2. Products
          • 16.2.10.3. SWOT Analysis
          • 16.2.10.4. Recent Developments
          • 16.2.10.5. Financials (Based on Availability)
        • 16.2.11 NBA Top Shot
          • 16.2.11.1. Overview
          • 16.2.11.2. Products
          • 16.2.11.3. SWOT Analysis
          • 16.2.11.4. Recent Developments
          • 16.2.11.5. Financials (Based on Availability)
        • 16.2.12 Dappler Labs
          • 16.2.12.1. Overview
          • 16.2.12.2. Products
          • 16.2.12.3. SWOT Analysis
          • 16.2.12.4. Recent Developments
          • 16.2.12.5. Financials (Based on Availability)

List of Figures

  1. Figure 1: Global Blockchain in Sports Market Revenue Breakdown (Million, %) by Region 2024 & 2032
  2. Figure 2: North America Blockchain in Sports Market Revenue (Million), by Country 2024 & 2032
  3. Figure 3: North America Blockchain in Sports Market Revenue Share (%), by Country 2024 & 2032
  4. Figure 4: Europe Blockchain in Sports Market Revenue (Million), by Country 2024 & 2032
  5. Figure 5: Europe Blockchain in Sports Market Revenue Share (%), by Country 2024 & 2032
  6. Figure 6: Asia Pacific Blockchain in Sports Market Revenue (Million), by Country 2024 & 2032
  7. Figure 7: Asia Pacific Blockchain in Sports Market Revenue Share (%), by Country 2024 & 2032
  8. Figure 8: Latin America Blockchain in Sports Market Revenue (Million), by Country 2024 & 2032
  9. Figure 9: Latin America Blockchain in Sports Market Revenue Share (%), by Country 2024 & 2032
  10. Figure 10: Middle East and Africa Blockchain in Sports Market Revenue (Million), by Country 2024 & 2032
  11. Figure 11: Middle East and Africa Blockchain in Sports Market Revenue Share (%), by Country 2024 & 2032
  12. Figure 12: North America Blockchain in Sports Market Revenue (Million), by Source Type 2024 & 2032
  13. Figure 13: North America Blockchain in Sports Market Revenue Share (%), by Source Type 2024 & 2032
  14. Figure 14: North America Blockchain in Sports Market Revenue (Million), by Country 2024 & 2032
  15. Figure 15: North America Blockchain in Sports Market Revenue Share (%), by Country 2024 & 2032
  16. Figure 16: Europe Blockchain in Sports Market Revenue (Million), by Source Type 2024 & 2032
  17. Figure 17: Europe Blockchain in Sports Market Revenue Share (%), by Source Type 2024 & 2032
  18. Figure 18: Europe Blockchain in Sports Market Revenue (Million), by Country 2024 & 2032
  19. Figure 19: Europe Blockchain in Sports Market Revenue Share (%), by Country 2024 & 2032
  20. Figure 20: Asia Pacific Blockchain in Sports Market Revenue (Million), by Source Type 2024 & 2032
  21. Figure 21: Asia Pacific Blockchain in Sports Market Revenue Share (%), by Source Type 2024 & 2032
  22. Figure 22: Asia Pacific Blockchain in Sports Market Revenue (Million), by Country 2024 & 2032
  23. Figure 23: Asia Pacific Blockchain in Sports Market Revenue Share (%), by Country 2024 & 2032
  24. Figure 24: Latin America Blockchain in Sports Market Revenue (Million), by Source Type 2024 & 2032
  25. Figure 25: Latin America Blockchain in Sports Market Revenue Share (%), by Source Type 2024 & 2032
  26. Figure 26: Latin America Blockchain in Sports Market Revenue (Million), by Country 2024 & 2032
  27. Figure 27: Latin America Blockchain in Sports Market Revenue Share (%), by Country 2024 & 2032
  28. Figure 28: Middle East and Africa Blockchain in Sports Market Revenue (Million), by Source Type 2024 & 2032
  29. Figure 29: Middle East and Africa Blockchain in Sports Market Revenue Share (%), by Source Type 2024 & 2032
  30. Figure 30: Middle East and Africa Blockchain in Sports Market Revenue (Million), by Country 2024 & 2032
  31. Figure 31: Middle East and Africa Blockchain in Sports Market Revenue Share (%), by Country 2024 & 2032

List of Tables

  1. Table 1: Global Blockchain in Sports Market Revenue Million Forecast, by Region 2019 & 2032
  2. Table 2: Global Blockchain in Sports Market Revenue Million Forecast, by Source Type 2019 & 2032
  3. Table 3: Global Blockchain in Sports Market Revenue Million Forecast, by Region 2019 & 2032
  4. Table 4: Global Blockchain in Sports Market Revenue Million Forecast, by Country 2019 & 2032
  5. Table 5: Blockchain in Sports Market Revenue (Million) Forecast, by Application 2019 & 2032
  6. Table 6: Global Blockchain in Sports Market Revenue Million Forecast, by Country 2019 & 2032
  7. Table 7: Blockchain in Sports Market Revenue (Million) Forecast, by Application 2019 & 2032
  8. Table 8: Global Blockchain in Sports Market Revenue Million Forecast, by Country 2019 & 2032
  9. Table 9: Blockchain in Sports Market Revenue (Million) Forecast, by Application 2019 & 2032
  10. Table 10: Global Blockchain in Sports Market Revenue Million Forecast, by Country 2019 & 2032
  11. Table 11: Blockchain in Sports Market Revenue (Million) Forecast, by Application 2019 & 2032
  12. Table 12: Global Blockchain in Sports Market Revenue Million Forecast, by Country 2019 & 2032
  13. Table 13: Blockchain in Sports Market Revenue (Million) Forecast, by Application 2019 & 2032
  14. Table 14: Global Blockchain in Sports Market Revenue Million Forecast, by Source Type 2019 & 2032
  15. Table 15: Global Blockchain in Sports Market Revenue Million Forecast, by Country 2019 & 2032
  16. Table 16: Global Blockchain in Sports Market Revenue Million Forecast, by Source Type 2019 & 2032
  17. Table 17: Global Blockchain in Sports Market Revenue Million Forecast, by Country 2019 & 2032
  18. Table 18: Global Blockchain in Sports Market Revenue Million Forecast, by Source Type 2019 & 2032
  19. Table 19: Global Blockchain in Sports Market Revenue Million Forecast, by Country 2019 & 2032
  20. Table 20: Global Blockchain in Sports Market Revenue Million Forecast, by Source Type 2019 & 2032
  21. Table 21: Global Blockchain in Sports Market Revenue Million Forecast, by Country 2019 & 2032
  22. Table 22: Global Blockchain in Sports Market Revenue Million Forecast, by Source Type 2019 & 2032
  23. Table 23: Global Blockchain in Sports Market Revenue Million Forecast, by Country 2019 & 2032


Frequently Asked Questions

1. What is the projected Compound Annual Growth Rate (CAGR) of the Blockchain in Sports Market?

The projected CAGR is approximately 9.00%.

2. Which companies are prominent players in the Blockchain in Sports Market?

Key companies in the market include Rarible, globatalent, Nifty Gateway, Blockasset, NFT Stars, Eternal, Flow, Sorare, Algorand, OpenSea, NBA Top Shot, Dappler Labs.

3. What are the main segments of the Blockchain in Sports Market?

The market segments include Source Type.

4. Can you provide details about the market size?

The market size is estimated to be USD XX Million as of 2022.

5. What are some drivers contributing to market growth?

Aggressive Spending by Venture Capitalists.

6. What are the notable trends driving market growth?

Managing fans engagment platfroms using blockchain is expected to dive growth for the market.

7. Are there any restraints impacting market growth?

Scalability Constraints.

8. Can you provide examples of recent developments in the market?

September 2022 - FIFA is glad to announce the FIFA+ Collect introduction, allowing football fans worldwide to acquire unique digital collectibles inexpensively; Algorand powers FIFA+ Collect. FIFA+ Collect is a new platform allowing fans to own and collect FIFA World Cup and FIFA Women's World Cup moments.

9. What pricing options are available for accessing the report?

Pricing options include single-user, multi-user, and enterprise licenses priced at USD 4750, USD 5250, and USD 8750 respectively.

10. Is the market size provided in terms of value or volume?

The market size is provided in terms of value, measured in Million.

11. Are there any specific market keywords associated with the report?

Yes, the market keyword associated with the report is "Blockchain in Sports Market," which aids in identifying and referencing the specific market segment covered.

12. How do I determine which pricing option suits my needs best?

The pricing options vary based on user requirements and access needs. Individual users may opt for single-user licenses, while businesses requiring broader access may choose multi-user or enterprise licenses for cost-effective access to the report.

13. Are there any additional resources or data provided in the Blockchain in Sports Market report?

While the report offers comprehensive insights, it's advisable to review the specific contents or supplementary materials provided to ascertain if additional resources or data are available.

14. How can I stay updated on further developments or reports in the Blockchain in Sports Market?

To stay informed about further developments, trends, and reports in the Blockchain in Sports Market, consider subscribing to industry newsletters, following relevant companies and organizations, or regularly checking reputable industry news sources and publications.


Methodology

Step 1 - Identification of Relevant Samples Size from Population Database

Step Chart
Bar Chart
Method Chart

Step 2 - Approaches for Defining Global Market Size (Value, Volume* & Price*)

Approach Chart
Top-down and bottom-up approaches are used to validate the global market size and estimate the market size for manufactures, regional segments, product, and application.

Note*: In applicable scenarios

Step 3 - Data Sources

Primary Research

  • Web Analytics
  • Survey Reports
  • Research Institute
  • Latest Research Reports
  • Opinion Leaders

Secondary Research

  • Annual Reports
  • White Paper
  • Latest Press Release
  • Industry Association
  • Paid Database
  • Investor Presentations
Analyst Chart

Step 4 - Data Triangulation

Involves using different sources of information in order to increase the validity of a study

These sources are likely to be stakeholders in a program - participants, other researchers, program staff, other community members, and so on.

Then we put all data in single framework & apply various statistical tools to find out the dynamic on the market.

During the analysis stage, feedback from the stakeholder groups would be compared to determine areas of agreement as well as areas of divergence

Additionally, after gathering mixed and scattered data from a wide range of sources, data is triangulated and correlated to come up with estimated figures which are further validated through primary mediums or industry experts, opinion leaders.

About Precision Market View

Precision Market View offers precise market research, industry intelligence, and data analysis for healthcare, manufacturing, technology, and energy. Our reports provide the clarity you need to make informed decisions and drive growth.

Our team combines primary research, advanced analytics, and industry expertise to deliver actionable intelligence. We offer syndicated reports, custom research, and consulting services tailored to your business needs.

At Precision Market View, we are committed to quality, transparency, and client satisfaction. Every report is rigorously validated to ensure accuracy and relevance. Our global perspective and local expertise help you understand both the big picture and the finer details of your market.

Stay informed with Precision Market View. Subscribe to our newsletter for the latest updates and research highlights, and follow us on social media for real-time insights.

Precision Market View – Clarity for Your Strategic Decisions.

artwork spiralartwork spiralRelated Reports
artwork underline

Exploring Industrial Radiography Equipment Industry Market Evolution 2025-2033

Explore the booming Industrial Radiography Equipment market, driven by advanced technologies like DR and CT. Discover market size, CAGR of 7.70%, key drivers, restraints, and segment analysis for aerospace, automotive, and more. Get insights into 2025-2033 growth.

September 2025
Base Year: 2024
No Of Pages: 234
Price: $4750

Navigating India Surveillance IP Cameras Market Market Trends: Competitor Analysis and Growth 2025-2033

Explore the booming India Surveillance IP Cameras Market, projected for significant growth driven by smart city initiatives, AI integration, and enhanced security needs in BFSI, transportation, and government sectors.

September 2025
Base Year: 2024
No Of Pages: 197
Price: $3800

Strategic Roadmap for Online Strategy Games Market Industry

The size of the Online Strategy Games Market market was valued at USD 19.58 Million in 2024 and is projected to reach USD 36.98 Million by 2033, with an expected CAGR of 9.51% during the forecast period.

September 2025
Base Year: 2024
No Of Pages: 234
Price: $4750

Analyzing Consumer Behavior in Influencer Marketing Market Market

Explore the booming Influencer Marketing Market, projected to reach $13.80 billion with a 31.95% CAGR by 2025. Discover key drivers, segments, and leading players in this dynamic industry.

August 2025
Base Year: 2024
No Of Pages: 234
Price: $4750

Global Commercial Background Music Market Report 2025: Growth Driven by Government Incentives and Partnerships

Explore the booming Global Commercial Background Music Market, projected to hit $1.8B by 2025 with a 6.7% CAGR. Discover key drivers, trends, and growth opportunities in retail, hospitality, and healthcare.

August 2025
Base Year: 2024
No Of Pages: 234
Price: $4750

Enterprise Key Management Industry Comprehensive Market Study: Trends and Predictions 2025-2033

The Enterprise Key Management (EKM) market is booming, projected to reach $2.32B in 2025 with a 22.32% CAGR. Driven by cloud adoption, data privacy regulations, and cybersecurity threats, this report analyzes market trends, segments (cloud, on-premises, BFSI, Healthcare), key players (IBM, Microsoft, etc.), and future growth projections through 2033. Discover key insights and strategic opportunities in the EKM landscape.

August 2025
Base Year: 2024
No Of Pages: 234
Price: $4750

Telecom Power Systems Industry in North America: Market Dynamics and Forecasts 2025-2033

Discover the booming Telecom Power Systems market! This comprehensive analysis reveals a CAGR of 3.87%, driven by 5G expansion and cloud adoption. Explore market size, segmentation (power range, end-user application), key players (Huawei, ABB, Delta), and regional trends (Asia Pacific leading) from 2019-2033.

August 2025
Base Year: 2024
No Of Pages: 234
Price: $4750

Mexico Payments Industry Charting Growth Trajectories: Analysis and Forecasts 2025-2033

Discover the booming Mexico payments industry! This comprehensive market analysis reveals a $113.89M (2025) market with a 10.18% CAGR, driven by digital adoption and e-commerce growth. Explore key trends, challenges, and major players like HSBC, Mastercard, and Visa. Get insights into payment methods, industry segments, and future projections.

August 2025
Base Year: 2024
No Of Pages: 197
Price: $3800

Future Prospects for Industrial CT Scanning Industry Growth

Discover the booming industrial CT scanning market! Learn about its $502 million (2025) size, 9.03% CAGR, key drivers (like aerospace & automotive needs), and leading companies. Explore market trends and regional insights for 2025-2033.

August 2025
Base Year: 2024
No Of Pages: 234
Price: $4750

APAC Factory Automation and Industrial Controls Industry Market’s Strategic Roadmap: Insights for 2025-2033

Discover the booming APAC Factory Automation and Industrial Controls market! This in-depth analysis reveals a CAGR of 10.87% driven by Industry 4.0, IoT, and smart manufacturing. Explore market size, key players (Honeywell, ABB, Siemens), regional trends (China, India), and future growth projections for 2025-2033.

August 2025
Base Year: 2024
No Of Pages: 210
Price: $4750

EPM Industry Competitive Strategies: Trends and Forecasts 2025-2033

The Enterprise Performance Management (EPM) market is booming, projected to reach $17.5 billion by 2033 with a 9.5% CAGR. Discover key drivers, trends, and restraints shaping this dynamic industry, including cloud adoption, AI integration, and regional growth. Leading vendors like IBM, Oracle, and Anaplan are driving innovation. Learn more about the future of EPM.

August 2025
Base Year: 2024
No Of Pages: 234
Price: $4750

Key Drivers for North America Proximity Access Control Market Market Growth: Projections 2025-2033

The North America proximity access control market is booming, projected to reach [Insert Projected 2033 Value based on CAGR calculation from Chart Data] by 2033. Driven by rising security concerns and smart building tech, this market offers lucrative opportunities. Explore key trends, segments, and top players shaping this dynamic landscape.

August 2025
Base Year: 2024
No Of Pages: 210
Price: $4750

Heat Pump Market in US Competitive Strategies: Trends and Forecasts 2025-2033

Discover the booming US heat pump market: A comprehensive analysis reveals a $15B market in 2025, projected to reach $25B by 2033, driven by energy efficiency, environmental concerns, and government incentives. Learn about key market trends, segments (air-source, water-source, geothermal), leading companies, and regional growth.

August 2025
Base Year: 2024
No Of Pages: 197
Price: $3800

HVAC Equipment Market in US Market’s Tech Revolution: Projections to 2033

The US HVAC equipment market is booming, projected to reach $45.35 billion by 2033 with a CAGR of 7.42%. This in-depth analysis explores market drivers, trends, restraints, segments (residential, commercial, industrial; air conditioning, chillers, heating, ventilation), key players, and regional data (Northeast, Southeast, Midwest, Southwest, West). Discover insights into this dynamic sector.

August 2025
Base Year: 2024
No Of Pages: 197
Price: $3800

Qatar Managed Services Industry Market’s Role in Emerging Tech: Insights and Projections 2025-2033

Discover the booming Qatar managed services market! This in-depth analysis reveals a $0.59 billion market in 2025, projected to grow at a 13.95% CAGR until 2033. Explore key drivers, trends, and market segmentation, including managed infrastructure, hosting, security, and cloud services across various sectors. Learn about leading companies and future growth opportunities in Qatar's thriving digital landscape.

August 2025
Base Year: 2024
No Of Pages: 197
Price: $3800

Opportunities in Emerging Croatia Facility Management Market Industry Markets

Discover the burgeoning Croatian facility management market! This in-depth analysis reveals key trends, growth drivers (urbanization, construction), and leading players in the €150M+ market, projecting steady expansion to 2033. Learn about segments, including Hard & Soft FM, and the rising demand for outsourced solutions.

August 2025
Base Year: 2024
No Of Pages: 197
Price: $3800

MEMS Combo Interaction Sensor Industry Growth Projections: Trends to Watch

The MEMS Combo Interaction Sensor market is booming, projected to reach [estimated 2033 market size in millions] by 2033, with a CAGR of 11.5%. Discover key drivers, trends, and restraints shaping this dynamic industry across automotive, consumer electronics, and more. Explore leading companies and regional market shares.

August 2025
Base Year: 2024
No Of Pages: 234
Price: $4750

United States Geospatial Analytics Market Expected to Reach XXX Million by 2033

The US Geospatial Analytics Market is booming, projected to reach [estimated 2033 value] by 2033, driven by precision agriculture, smart cities, and defense applications. Discover key trends, growth drivers, and leading companies shaping this rapidly expanding $5.325 billion (2025) market.

August 2025
Base Year: 2024
No Of Pages: 197
Price: $3800

Sports Optic Market Market Demand and Consumption Trends: Outlook 2025-2033

Discover the booming sports optics market! Explore key trends, growth drivers (hunting, birdwatching, technological advancements), and leading companies shaping this $15B+ industry. Get insights into market segmentation, regional analysis (North America, Europe, Asia-Pacific), and future forecasts (2025-2033).

August 2025
Base Year: 2024
No Of Pages: 234
Price: $4750

Drivers of Change in Application Platform Industry Market 2025-2033

Discover the booming Application Platform market! Our comprehensive analysis reveals a 7.50% CAGR, key drivers, restraints, and regional trends until 2033. Learn about leading companies like Google, Salesforce, and Microsoft shaping this dynamic industry. Get the data now!

August 2025
Base Year: 2024
No Of Pages: 234
Price: $4750

Decoding Hong Kong Storage Industry’s Market Size Potential by 2033

Discover the booming Hong Kong self-storage market! Our analysis reveals an 8% CAGR, driven by urbanization & e-commerce. Explore market size, key players (SC Storage, Extra Space Pte Ltd, etc.), and future trends until 2033. Invest wisely in this growing sector.

August 2025
Base Year: 2024
No Of Pages: 197
Price: $3800

Comprehensive Insights into Japan Outdoor LED Lighting Market: Trends and Growth Projections 2025-2033

Discover the booming Japan Outdoor LED Lighting market! This in-depth analysis reveals a CAGR of 19.50%, driven by smart city initiatives and energy efficiency goals. Explore market size, key players (Toshiba, Nichia, Signify), regional trends, and future projections to 2033. Invest wisely in this rapidly expanding sector.

August 2025
Base Year: 2024
No Of Pages: 197
Price: $3800

Comprehensive Insights into Process Automation Industry in Europe: Trends and Growth Projections 2025-2033

Discover the booming European process automation market! This in-depth analysis reveals a CAGR of 6.18%, driven by Industry 4.0, IIoT, and stringent regulations. Explore key players, regional trends, and growth projections for 2025-2033. Learn about market segmentation, including communication protocols, system types, and end-user industries.

August 2025
Base Year: 2024
No Of Pages: 210
Price: $4750

UCaaS in Manufacturing Industry Report: Trends and Forecasts 2025-2033

Discover the booming UCaaS market in manufacturing! Learn about its 17.74% CAGR, key drivers, leading companies (like Cisco, Microsoft, and IBM), and regional growth projections through 2033. Optimize communication and collaboration with this in-depth market analysis.

August 2025
Base Year: 2024
No Of Pages: 234
Price: $4750

Global Perspectives on X-Ray Tube Industry Growth: 2025-2033 Insights

The X-ray tube market is booming, projected to reach [estimated 2033 market size] by 2033, driven by medical imaging advancements and industrial applications. Explore market trends, key players (Canon, Siemens, Varex), and regional growth in this comprehensive analysis.

August 2025
Base Year: 2024
No Of Pages: 234
Price: $4750

Hong Kong Data Center Networking Market 2025-2033 Market Analysis: Trends, Dynamics, and Growth Opportunities

Discover the booming Hong Kong data center networking market! This comprehensive analysis reveals a market size of $332.38 million in 2025, projected to grow at a CAGR of 7.22% through 2033. Explore key drivers, trends, restraints, and leading companies shaping this dynamic sector.

August 2025
Base Year: 2024
No Of Pages: 197
Price: $3800

Printed Thin Film Battery Market Unlocking Growth Potential: Analysis and Forecasts 2025-2033

The Printed Thin Film Battery Market is booming, projected to reach \$XX billion by 2033 with a remarkable 29.70% CAGR. Explore key drivers, trends, and regional insights shaping this dynamic market, featuring leading companies like Panasonic and others. Discover the potential of rechargeable and non-rechargeable batteries across diverse applications.

August 2025
Base Year: 2024
No Of Pages: 234
Price: $4750

India Data Center Power Market Growth Forecast and Consumer Insights

The India Data Center Power Market is booming, projected to reach $3.18 billion by 2033, with an 18.02% CAGR. Driven by digitalization and cloud adoption, this market is segmented by power solutions (PDU, switchgear etc.), end-users (IT, BFSI, Government), and regions. Learn more about key players and growth opportunities.

August 2025
Base Year: 2024
No Of Pages: 197
Price: $3800

APAC Marine Satellite Communications Market Market Trends and Insights

The APAC marine satellite communications market is booming, driven by VSAT adoption and growing demand for reliable connectivity at sea. Explore market size, CAGR, key players, and regional trends in this comprehensive analysis projecting strong growth to 2033.

August 2025
Base Year: 2024
No Of Pages: 197
Price: $3800

Challenges to Overcome in Solar Micro Inverter Industry Market Growth: Analysis 2025-2033

The solar microinverter market is booming, projected to reach $3.15B in 2025 with a 19.7% CAGR. Discover key trends, drivers, restraints, and leading companies shaping this dynamic industry. Learn about regional market share and growth opportunities in North America, Europe, Asia-Pacific, and more.

August 2025
Base Year: 2024
No Of Pages: 234
Price: $4750

Growth Catalysts in Radiation Hard Electronics Market Market

The Radiation Hard Electronics Market is booming, projected to reach $1.81 billion by 2025 with a CAGR of 3.87% until 2033. Driven by space exploration, aerospace, defense, and nuclear power, this market offers significant investment opportunities. Learn about key trends, leading companies, and regional growth in our comprehensive analysis.

August 2025
Base Year: 2024
No Of Pages: 234
Price: $4750

Global LiDAR Market 2025-2033: Preparing for Growth and Change

The global LiDAR market is booming, projected to reach \$2.57 billion by 2025 and grow at a CAGR of 19.93% through 2033. Driven by autonomous vehicles, ADAS, and mapping applications, this comprehensive market analysis explores key trends, segments (robotic vehicles, aerial & terrestrial LiDAR), and leading companies. Discover the future of LiDAR technology.

August 2025
Base Year: 2024
No Of Pages: 234
Price: $4750

APAC Valves Market Report 2025: Growth Driven by Government Incentives and Partnerships

The APAC valves market is booming, driven by infrastructure growth and industrial expansion in China and India. Discover key trends, market size projections (2025-2033), leading companies, and regional breakdowns in our comprehensive analysis. Learn about growth drivers, restraints, and the opportunities presented by automation and sustainability.

August 2025
Base Year: 2024
No Of Pages: 210
Price: $4750

Indonesia Data Center Storage Market Navigating Dynamics Comprehensive Analysis and Forecasts 2025-2033

Discover the booming Indonesia Data Center Storage market! This in-depth analysis reveals a 14.03% CAGR, driven by cloud adoption & digital transformation. Explore market size, key players (Seagate, Western Digital, NetApp), and future trends in NAS, SAN, and All-flash storage. Learn how to capitalize on this growth opportunity in Indonesia's expanding digital economy.

August 2025
Base Year: 2024
No Of Pages: 197
Price: $3800

Professional Services Automation Market Growth Opportunities: Market Size Forecast to 2033

The Professional Services Automation (PSA) market is booming, projected to reach $11.76B in 2025 with a 31.10% CAGR. Discover key trends, drivers, and leading companies shaping this rapidly growing sector. Explore cloud-based solutions, market segmentation, and regional insights.

August 2025
Base Year: 2024
No Of Pages: 234
Price: $4750

Residential & Industrial Biomass Boiler Market Market Drivers and Challenges: Trends 2025-2033

Discover the booming Residential & Industrial Biomass Boiler market! Learn about its 5.10% CAGR, key drivers, restraints, and regional trends. Explore market segmentation and leading companies shaping this sustainable energy sector. Get insights into market forecasts from 2025-2033.

August 2025
Base Year: 2024
No Of Pages: 234
Price: $4750

Strategic Projections for Transaction Monitoring Industry Market Expansion

The global transaction monitoring market is booming, projected to reach \$161.25 billion by 2033, driven by rising fraud, stringent regulations, and AI advancements. Learn about key players, market trends, and regional insights in this comprehensive analysis.

August 2025
Base Year: 2024
No Of Pages: 234
Price: $4750

GigE Camera Industry Market’s Technological Evolution: Trends and Analysis 2025-2033

Discover the booming GigE Vision camera market! Explore its 13.60% CAGR, key drivers like industrial automation and CMOS advancements, and regional growth projections through 2033. Learn about leading companies and market segmentation in this in-depth analysis.

August 2025
Base Year: 2024
No Of Pages: 234
Price: $4750

Asia-Pacific Cognitive Collaboration Industry Market Consumption Trends: Growth Analysis 2025-2033

The Asia-Pacific cognitive collaboration market is booming, projected to reach [estimated 2033 value based on CAGR from chart data] by 2033, driven by cloud adoption, improved efficiency needs, and government initiatives. Learn about key trends, leading companies, and regional insights in this comprehensive market analysis.

August 2025
Base Year: 2024
No Of Pages: 210
Price: $4750

Future-Forward Strategies for Europe Mobile Cloud Market Industry

The booming European mobile cloud market is projected to reach significant value by 2033, driven by mobile gaming, fintech, and enterprise adoption. Discover key trends, growth drivers, and leading companies shaping this dynamic sector. Explore market size, CAGR, and regional breakdowns for informed business decisions.

August 2025
Base Year: 2024
No Of Pages: 234
Price: $4750

Sensors Market Market Expansion: Growth Outlook 2025-2033

The global sensors market is booming, with a projected CAGR of 7.80% through 2033. Driven by IoT, automotive advancements, and consumer electronics, this in-depth analysis explores market size, key segments (optical, electrical resistance, automotive, consumer electronics), leading companies (Infineon, Honeywell, Bosch), and regional growth. Discover the latest trends and future forecasts for this dynamic industry.

August 2025
Base Year: 2024
No Of Pages: 234
Price: $4750

Decoding APAC Small Cell Tower Industry Consumer Preferences 2025-2033

The APAC small cell tower market is booming, driven by 5G expansion and surging mobile data demand. Discover key trends, growth forecasts (2025-2033), leading companies, and regional market shares in this in-depth analysis. Learn about the challenges and opportunities shaping this dynamic industry.

August 2025
Base Year: 2024
No Of Pages: 210
Price: $4750

Exploring Fiber Optic Test Equipment Industry Market Disruption and Innovation

The fiber optic test equipment market is booming, projected to reach [estimated 2033 value] by 2033, driven by 5G, data centers, and FTTH. This in-depth analysis explores market size, CAGR, key players (VIAVI, Anritsu), regional trends, and future growth forecasts for OTDRs, OSAs, and other crucial equipment.

August 2025
Base Year: 2024
No Of Pages: 234
Price: $4750

Tablet PC Industry Consumer Behavior Dynamics: Key Trends 2025-2033

The global Tablet PC market is booming, projected to reach $1.75 billion by 2033 with a 6.38% CAGR. Discover key trends, drivers, and leading companies shaping this dynamic market, encompassing rugged, semi-rugged, and ultra-rugged tablets across various industries.

August 2025
Base Year: 2024
No Of Pages: 234
Price: $4750

Greece ICT Market 2025-2033 Overview: Trends, Competitor Dynamics, and Opportunities

Discover the booming Greece ICT market forecast to 2033! This analysis reveals a €7.75B market experiencing 12.5% CAGR, driven by cloud adoption, 5G expansion, and digital transformation. Explore key players, market segments, and challenges impacting growth in the Greek ICT sector.

August 2025
Base Year: 2024
No Of Pages: 197
Price: $3800

Strategic Insights for Europe Elevator Market Market Growth

The European elevator market is booming, projected to reach €XX million by 2033 with a 5.67% CAGR. Driven by aging populations and building regulations, key players like Thyssenkrupp and Stannah are capitalizing on growing demand for accessibility and smart elevator technologies. Explore market trends, segmentation, and leading companies in this comprehensive analysis.

August 2025
Base Year: 2024
No Of Pages: 197
Price: $3800

Compensation Planning Software Industry Charting Growth Trajectories: Analysis and Forecasts 2025-2033

The Compensation Planning Software market is booming, with an 8.80% CAGR. Discover key trends, drivers, and restraints shaping this dynamic industry, including insights on regional growth, leading companies, and software application segments. Explore the future of cloud-based payroll, employee benefits, and performance management solutions.

August 2025
Base Year: 2024
No Of Pages: 234
Price: $4750

Germany FA and ICS Market’s Evolutionary Trends 2025-2033

Discover the booming German Factory Automation & Industrial Control Systems market! This in-depth analysis reveals a €5 billion market in 2025, projected to grow at 10.66% CAGR until 2033, driven by Industry 4.0 and digital transformation. Explore key trends, regional insights (North Rhine-Westphalia, Bavaria), leading companies (Siemens, Emerson), and future projections.

August 2025
Base Year: 2024
No Of Pages: 197
Price: $3800

South Africa MVNO - MNO Market Planning for the Future: Key Trends 2025-2033

Discover the booming South African MVNO-MNO market! This in-depth analysis reveals a $84.33 million market in 2025, growing at 7.80% CAGR until 2033. Learn about key players (Vodacom, MTN, Cell C), market drivers, and regional trends impacting this dynamic sector. Explore market segmentation, competitive landscape and future projections.

August 2025
Base Year: 2024
No Of Pages: 197
Price: $3800

Fiber Optic Components Industry XX CAGR Growth Analysis 2025-2033

The fiber optic components market is booming, projected to reach $XX million by 2033 with a CAGR of 10.70%. Driven by 5G, cloud computing, and high-speed data needs, this report analyzes market size, key players (Broadcom, II-VI, etc.), segments (cables, transceivers, etc.), and regional trends. Discover future growth opportunities in this dynamic industry.

August 2025
Base Year: 2024
No Of Pages: 234
Price: $4750
  • Home
  • About Us
  • Industries
    • Aerospace & Defense
    • Agriculture
    • Animal Nutrition & Wellness
    • Automotive
    • Chemicals & Materials
    • Consumer Goods and Services
    • Energy & Power
    • Financial Services and Investment Intelligence
    • Food & Beverage
    • Home and Property Improvement
    • Hospitality and Tourism
    • Logistics
    • Manufacturing Products and Services
    • Packaging
    • Professional and Commercial Services
    • Real Estate and Construction
    • Retail
    • Technology, Media and Telecom
    • Healthcare
  • Services
  • Contact
Main Logo
  • Home
  • About Us
  • Industries
    • Aerospace & Defense
    • Agriculture
    • Animal Nutrition & Wellness
    • Automotive
    • Chemicals & Materials
    • Consumer Goods and Services
    • Energy & Power
    • Financial Services and Investment Intelligence
    • Food & Beverage
    • Home and Property Improvement
    • Hospitality and Tourism
    • Logistics
    • Manufacturing Products and Services
    • Packaging
    • Professional and Commercial Services
    • Real Estate and Construction
    • Retail
    • Technology, Media and Telecom
    • Healthcare
  • Services
  • Contact
+17162654855
[email protected]

+17162654855

[email protected]

Business Address

Head Office

Ansec House 3 rd floor Tank Road, Yerwada, Pune, Maharashtra 411014

Contact Information

Craig Francis

Business Development Head

+17162654855

[email protected]

Secure Payment Partners

payment image
RetailLogisticsPackagingAutomotiveHealthcareAgricultureEnergy & PowerFood & BeverageAerospace & DefenseChemicals & MaterialsHospitality and TourismAnimal Nutrition & WellnessConsumer Goods and ServicesReal Estate and ConstructionHome and Property ImprovementTechnology, Media and TelecomManufacturing Products and ServicesFinancial Services and Investment Intelligence

© 2025 PRDUA Research & Media Private Limited, All rights reserved

Privacy Policy
Terms and Conditions
FAQ