
Key Insights
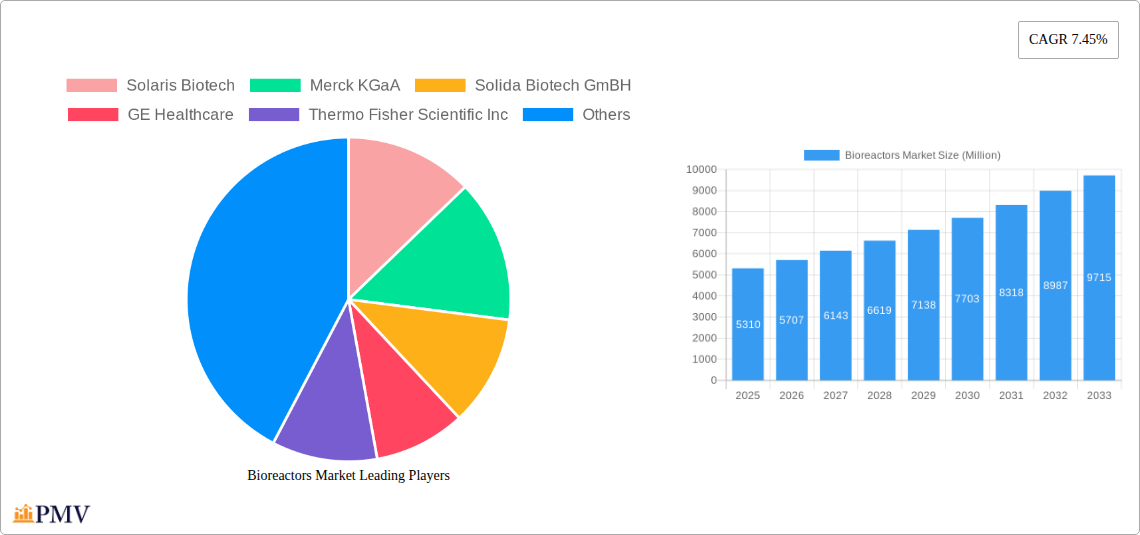
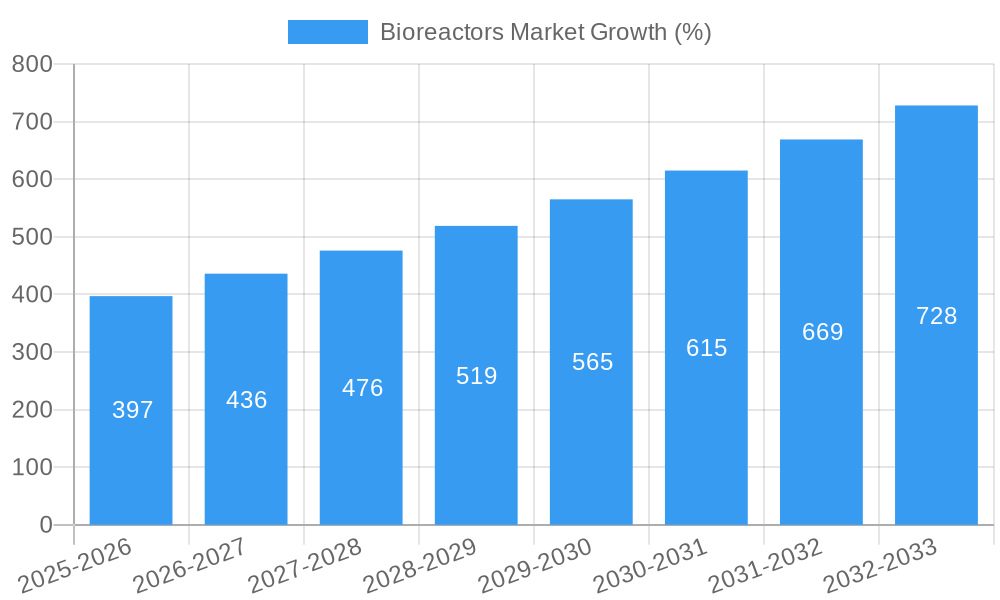
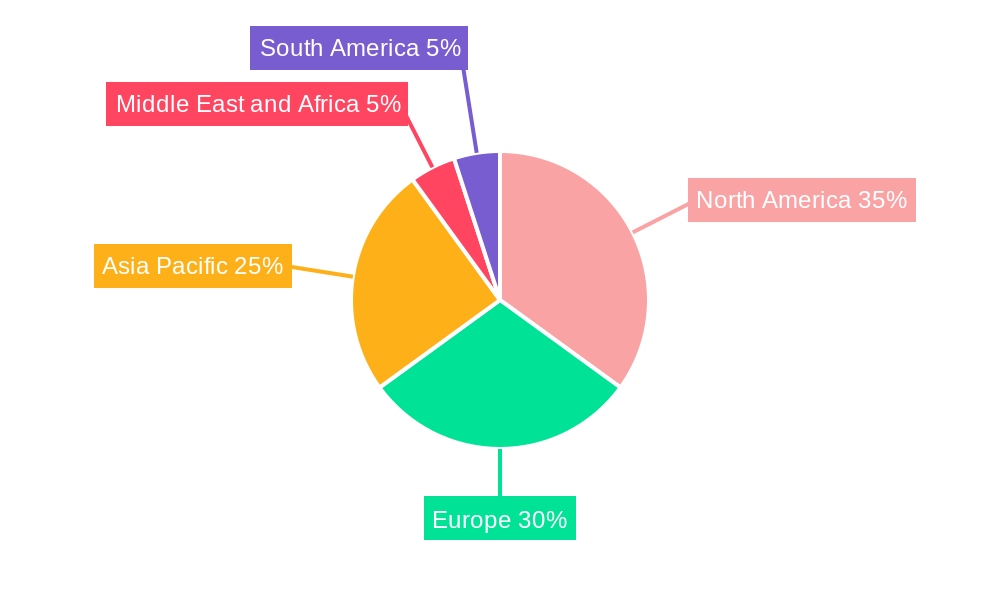
The global bioreactors market, valued at $5.31 billion in 2025, is projected to experience robust growth, driven by a compound annual growth rate (CAGR) of 7.45% from 2025 to 2033. This expansion is fueled by several key factors. Increased demand for biopharmaceuticals, including monoclonal antibodies and vaccines, necessitates efficient and scalable bioprocessing technologies. Advancements in bioreactor design, such as the development of single-use bioreactors and automated systems (MFCs), are enhancing productivity and reducing operational costs. The rising prevalence of chronic diseases globally is further stimulating the demand for biologics, driving the adoption of bioreactors across various scales of production – from lab-scale research to large-scale commercial manufacturing. Furthermore, stringent regulatory requirements regarding biopharmaceutical production are encouraging the adoption of sophisticated, validated bioreactor systems. The market segmentation reveals a strong preference towards automated systems, reflecting industry trends toward improved efficiency and reduced human error. Stainless steel bioreactors currently dominate the market in terms of material, but single-use bioreactors are gaining traction owing to their cost-effectiveness and reduced risk of contamination. Geographically, North America and Europe are currently leading the market, owing to strong pharmaceutical industries and established research infrastructure. However, Asia-Pacific is poised for significant growth, driven by increasing investments in biotechnology and pharmaceutical manufacturing in countries like China and India.
The competitive landscape features a mix of established players such as Thermo Fisher Scientific, Sartorius, and GE Healthcare, alongside specialized biotech companies like Solaris Biotech and Infors HT. These companies are actively engaged in R&D, strategic partnerships, and acquisitions to solidify their market positions and cater to the evolving needs of the biopharmaceutical industry. Future growth is expected to be influenced by factors like the development of innovative bioreactor technologies, the increasing adoption of continuous manufacturing processes, and the ongoing rise in personalized medicine, all contributing to the market's dynamic and promising future. The forecast period from 2025-2033 signifies a period of sustained growth, driven by ongoing technological innovations, expanding application areas, and the continuous rise in the demand for biologics.
This detailed report provides a comprehensive analysis of the global bioreactors market, offering valuable insights for stakeholders across the industry. With a study period spanning 2019-2033, a base year of 2025, and an estimated and forecast period of 2025-2033, this report delivers actionable intelligence on market trends, segmentation, competitive dynamics, and future growth prospects. The market is expected to reach xx Million by 2033, exhibiting a CAGR of xx% during the forecast period.
Bioreactors Market Market Structure & Competitive Dynamics
The bioreactors market is characterized by a moderately consolidated structure with several key players holding significant market share. The market concentration is influenced by factors such as technological advancements, regulatory approvals, and the increasing demand for biopharmaceutical products. Innovation ecosystems play a crucial role, with companies investing heavily in R&D to develop advanced bioreactor technologies, including single-use systems and automated control systems. Regulatory frameworks, particularly those governing biopharmaceutical manufacturing, significantly impact market growth. The market also faces competition from substitute technologies, although their market penetration remains limited. End-user trends, including the growing adoption of cell therapy and personalized medicine, are driving market expansion. M&A activities have played a role in shaping the competitive landscape, with deal values reaching xx Million in recent years. Some key players have a significant market share, while others are focusing on niche applications. For example, the market share of the top 5 players is estimated at xx%.
- Market Concentration: Moderately Consolidated
- Innovation Ecosystems: High R&D investment driving advancements in single-use and automated systems.
- Regulatory Frameworks: Stringent regulations governing biopharmaceutical manufacturing.
- Product Substitutes: Limited impact, but alternative technologies are being explored.
- End-User Trends: Growing demand driven by cell therapy and personalized medicine.
- M&A Activities: Significant activity observed in recent years, with deal values reaching xx Million.
Bioreactors Market Industry Trends & Insights
The bioreactors market is experiencing robust growth, fueled by several key factors. Technological advancements, such as the development of single-use bioreactors and advanced process control systems, are significantly enhancing efficiency and reducing manufacturing costs. The increasing demand for biopharmaceuticals, particularly biologics, is a major growth driver. Consumer preferences are shifting towards more personalized and targeted therapies, further fueling demand. Competitive dynamics are shaping the market, with companies focusing on innovation, strategic partnerships, and acquisitions to gain a competitive edge. The market penetration of advanced bioreactor technologies is gradually increasing, with a projected xx% penetration by 2033. The market is also witnessing a shift towards larger scale production to meet the growing demand.
Dominant Markets & Segments in Bioreactors Market
The North American region currently dominates the bioreactors market, driven by factors such as strong regulatory frameworks supporting biopharmaceutical development, high healthcare expenditure, and a robust research infrastructure. Within the market segments, automated (MFCs) control type holds a significant share owing to its advantages in terms of precision and efficiency. Stainless steel bioreactors maintain a dominant position due to their durability and suitability for various applications, although single-use systems are gaining traction due to reduced cleaning validation time and contamination risk. Full-scale production is the largest segment due to the scale of manufacturing required for large-scale drug production. The 200L-1,500L scale segment holds the largest share due to the balance between scalability and cost-effectiveness.
Key Drivers for North American Dominance:
- Strong regulatory frameworks
- High healthcare expenditure
- Robust research infrastructure
Dominant Segments:
- Control Type: Automated (MFCs)
- Type: Stainless Steel
- Usage: Full-scale Production
- Scale: 200L-1,500L
Bioreactors Market Product Innovations
Recent innovations in bioreactors include the development of single-use systems that offer enhanced flexibility and reduced contamination risks. Miniaturized bioreactors are gaining traction for research and development applications, while advancements in process control systems are improving efficiency and yield. These innovations cater to the increasing demand for faster, more cost-effective biopharmaceutical production. The focus on scalability and automation is expected to shape future product developments.
Report Segmentation & Scope
This report segments the bioreactors market based on control type (Manual, Automated (MFCs)), type (Glass, Stainless Steel, Single-use), usage (Lab-scale Production, Pilot-scale Production, Full-scale Production), and scale (5L-20L, 20L-200L, 200L-1,500L, Above 1,500L). Each segment is analyzed in detail, providing insights into its growth projections, market size, and competitive dynamics. The single-use segment is expected to exhibit the highest growth rate, driven by its inherent advantages. The automated bioreactor segment is expected to dominate the market, owing to its precision and efficiency.
Key Drivers of Bioreactors Market Growth
Technological advancements in bioreactor design and automation are a primary growth driver, increasing efficiency and reducing costs. The growing demand for biopharmaceuticals, particularly biologics, fuels market expansion. Favorable regulatory environments supporting biopharmaceutical development in key regions also contribute. Furthermore, increasing investments in R&D and collaborations are enhancing innovation.
Challenges in the Bioreactors Market Sector
High initial investment costs for advanced bioreactor systems can pose a challenge for smaller companies. Stringent regulatory requirements for biopharmaceutical manufacturing increase development time and costs. Supply chain disruptions can impact the availability of critical components, potentially causing delays in production. Intense competition from established players also creates challenges for new entrants.
Leading Players in the Bioreactors Market Market
- Solaris Biotech
- Merck KGaA
- Solida Biotech GmBH
- GE Healthcare
- Thermo Fisher Scientific Inc
- Eppendorf AG
- Bioengineering AG
- Pall Corporation (Danaher Corporation)
- Sartorius AG
- Getinge AB
- Esco Lifesciences Group Ltd
- Infors HT
Key Developments in Bioreactors Market Sector
- October 2022: Getinge AB announced that their bioreactors will support the Dutch government's initiative to produce animal products such as meat and milk proteins directly from animal and microbial cells. This highlights the expanding applications of bioreactors beyond traditional pharmaceuticals.
- May 2022: Pall Corporation announced that its ICELL nano bioreactor helped the Institute of Biomedicine of Seville (IBIS) develop viral vectors for CAR-T therapy. This demonstrates the role of advanced bioreactor technologies in cutting-edge therapies.
Strategic Bioreactors Market Market Outlook
The future of the bioreactors market looks promising, driven by ongoing technological advancements, increasing demand for biopharmaceuticals, and the expansion of applications into new areas such as cell-based meat production. Strategic opportunities exist for companies that can effectively leverage innovation, establish strong partnerships, and adapt to evolving regulatory landscapes. Focus on scalability, automation, and single-use systems will be crucial for future success.
Bioreactors Market Segmentation
-
1. Type
- 1.1. Glass
- 1.2. Stainless Steel
- 1.3. Single-use
-
2. Usage
- 2.1. Lab-scale Production
- 2.2. Pilot-scale Production
- 2.3. Full-scale Production
-
3. Scale
- 3.1. 5L-20L
- 3.2. 20L-200L
- 3.3. 200L-1,500L
- 3.4. Above 1,500L
-
4. Control Type
- 4.1. Manual
- 4.2. Automated (MFCs)
Bioreactors Market Segmentation By Geography
-
1. North America
- 1.1. United States
- 1.2. Canada
- 1.3. Mexico
-
2. Europe
- 2.1. Germany
- 2.2. United Kingdom
- 2.3. France
- 2.4. Italy
- 2.5. Spain
- 2.6. Rest of Europe
-
3. Asia Pacific
- 3.1. China
- 3.2. Japan
- 3.3. India
- 3.4. Australia
- 3.5. South Korea
- 3.6. Rest of Asia Pacific
-
4. Middle East and Africa
- 4.1. GCC
- 4.2. South Africa
- 4.3. Rest of Middle East and Africa
-
5. South America
- 5.1. Brazil
- 5.2. Argentina
- 5.3. Rest of South America
Bioreactors Market REPORT HIGHLIGHTS
| Aspects | Details |
|---|---|
| Study Period | 2019-2033 |
| Base Year | 2024 |
| Estimated Year | 2025 |
| Forecast Period | 2025-2033 |
| Historical Period | 2019-2024 |
| Growth Rate | CAGR of 7.45% from 2019-2033 |
| Segmentation |
|
Table of Contents
- 1. Introduction
- 1.1. Research Scope
- 1.2. Market Segmentation
- 1.3. Research Methodology
- 1.4. Definitions and Assumptions
- 2. Executive Summary
- 2.1. Introduction
- 3. Market Dynamics
- 3.1. Introduction
- 3.2. Market Drivers
- 3.2.1. Growth of Bioreactors in Pharmaceuticals; Technological Advancements in Bioreactors; Adoption of Single-use bioreactors (SUBs) and Hybrid Bioreactors
- 3.3. Market Restrains
- 3.3.1. Concerns Regarding the Use of Single-use Bioreactors (SUBs); Limited Storage Capacity
- 3.4. Market Trends
- 3.4.1. The Single-use Bioreactors Segment is Expected to Have A High Growth Rate During the Forecast Period
- 4. Market Factor Analysis
- 4.1. Porters Five Forces
- 4.2. Supply/Value Chain
- 4.3. PESTEL analysis
- 4.4. Market Entropy
- 4.5. Patent/Trademark Analysis
- 5. Global Bioreactors Market Analysis, Insights and Forecast, 2019-2031
- 5.1. Market Analysis, Insights and Forecast - by Type
- 5.1.1. Glass
- 5.1.2. Stainless Steel
- 5.1.3. Single-use
- 5.2. Market Analysis, Insights and Forecast - by Usage
- 5.2.1. Lab-scale Production
- 5.2.2. Pilot-scale Production
- 5.2.3. Full-scale Production
- 5.3. Market Analysis, Insights and Forecast - by Scale
- 5.3.1. 5L-20L
- 5.3.2. 20L-200L
- 5.3.3. 200L-1,500L
- 5.3.4. Above 1,500L
- 5.4. Market Analysis, Insights and Forecast - by Control Type
- 5.4.1. Manual
- 5.4.2. Automated (MFCs)
- 5.5. Market Analysis, Insights and Forecast - by Region
- 5.5.1. North America
- 5.5.2. Europe
- 5.5.3. Asia Pacific
- 5.5.4. Middle East and Africa
- 5.5.5. South America
- 5.1. Market Analysis, Insights and Forecast - by Type
- 6. North America Bioreactors Market Analysis, Insights and Forecast, 2019-2031
- 6.1. Market Analysis, Insights and Forecast - by Type
- 6.1.1. Glass
- 6.1.2. Stainless Steel
- 6.1.3. Single-use
- 6.2. Market Analysis, Insights and Forecast - by Usage
- 6.2.1. Lab-scale Production
- 6.2.2. Pilot-scale Production
- 6.2.3. Full-scale Production
- 6.3. Market Analysis, Insights and Forecast - by Scale
- 6.3.1. 5L-20L
- 6.3.2. 20L-200L
- 6.3.3. 200L-1,500L
- 6.3.4. Above 1,500L
- 6.4. Market Analysis, Insights and Forecast - by Control Type
- 6.4.1. Manual
- 6.4.2. Automated (MFCs)
- 6.1. Market Analysis, Insights and Forecast - by Type
- 7. Europe Bioreactors Market Analysis, Insights and Forecast, 2019-2031
- 7.1. Market Analysis, Insights and Forecast - by Type
- 7.1.1. Glass
- 7.1.2. Stainless Steel
- 7.1.3. Single-use
- 7.2. Market Analysis, Insights and Forecast - by Usage
- 7.2.1. Lab-scale Production
- 7.2.2. Pilot-scale Production
- 7.2.3. Full-scale Production
- 7.3. Market Analysis, Insights and Forecast - by Scale
- 7.3.1. 5L-20L
- 7.3.2. 20L-200L
- 7.3.3. 200L-1,500L
- 7.3.4. Above 1,500L
- 7.4. Market Analysis, Insights and Forecast - by Control Type
- 7.4.1. Manual
- 7.4.2. Automated (MFCs)
- 7.1. Market Analysis, Insights and Forecast - by Type
- 8. Asia Pacific Bioreactors Market Analysis, Insights and Forecast, 2019-2031
- 8.1. Market Analysis, Insights and Forecast - by Type
- 8.1.1. Glass
- 8.1.2. Stainless Steel
- 8.1.3. Single-use
- 8.2. Market Analysis, Insights and Forecast - by Usage
- 8.2.1. Lab-scale Production
- 8.2.2. Pilot-scale Production
- 8.2.3. Full-scale Production
- 8.3. Market Analysis, Insights and Forecast - by Scale
- 8.3.1. 5L-20L
- 8.3.2. 20L-200L
- 8.3.3. 200L-1,500L
- 8.3.4. Above 1,500L
- 8.4. Market Analysis, Insights and Forecast - by Control Type
- 8.4.1. Manual
- 8.4.2. Automated (MFCs)
- 8.1. Market Analysis, Insights and Forecast - by Type
- 9. Middle East and Africa Bioreactors Market Analysis, Insights and Forecast, 2019-2031
- 9.1. Market Analysis, Insights and Forecast - by Type
- 9.1.1. Glass
- 9.1.2. Stainless Steel
- 9.1.3. Single-use
- 9.2. Market Analysis, Insights and Forecast - by Usage
- 9.2.1. Lab-scale Production
- 9.2.2. Pilot-scale Production
- 9.2.3. Full-scale Production
- 9.3. Market Analysis, Insights and Forecast - by Scale
- 9.3.1. 5L-20L
- 9.3.2. 20L-200L
- 9.3.3. 200L-1,500L
- 9.3.4. Above 1,500L
- 9.4. Market Analysis, Insights and Forecast - by Control Type
- 9.4.1. Manual
- 9.4.2. Automated (MFCs)
- 9.1. Market Analysis, Insights and Forecast - by Type
- 10. South America Bioreactors Market Analysis, Insights and Forecast, 2019-2031
- 10.1. Market Analysis, Insights and Forecast - by Type
- 10.1.1. Glass
- 10.1.2. Stainless Steel
- 10.1.3. Single-use
- 10.2. Market Analysis, Insights and Forecast - by Usage
- 10.2.1. Lab-scale Production
- 10.2.2. Pilot-scale Production
- 10.2.3. Full-scale Production
- 10.3. Market Analysis, Insights and Forecast - by Scale
- 10.3.1. 5L-20L
- 10.3.2. 20L-200L
- 10.3.3. 200L-1,500L
- 10.3.4. Above 1,500L
- 10.4. Market Analysis, Insights and Forecast - by Control Type
- 10.4.1. Manual
- 10.4.2. Automated (MFCs)
- 10.1. Market Analysis, Insights and Forecast - by Type
- 11. North America Bioreactors Market Analysis, Insights and Forecast, 2019-2031
- 11.1. Market Analysis, Insights and Forecast - By Country/Sub-region
- 11.1.1 United States
- 11.1.2 Canada
- 11.1.3 Mexico
- 12. Europe Bioreactors Market Analysis, Insights and Forecast, 2019-2031
- 12.1. Market Analysis, Insights and Forecast - By Country/Sub-region
- 12.1.1 Germany
- 12.1.2 United Kingdom
- 12.1.3 France
- 12.1.4 Italy
- 12.1.5 Spain
- 12.1.6 Rest of Europe
- 13. Asia Pacific Bioreactors Market Analysis, Insights and Forecast, 2019-2031
- 13.1. Market Analysis, Insights and Forecast - By Country/Sub-region
- 13.1.1 China
- 13.1.2 Japan
- 13.1.3 India
- 13.1.4 Australia
- 13.1.5 South Korea
- 13.1.6 Rest of Asia Pacific
- 14. Middle East and Africa Bioreactors Market Analysis, Insights and Forecast, 2019-2031
- 14.1. Market Analysis, Insights and Forecast - By Country/Sub-region
- 14.1.1 GCC
- 14.1.2 South Africa
- 14.1.3 Rest of Middle East and Africa
- 15. South America Bioreactors Market Analysis, Insights and Forecast, 2019-2031
- 15.1. Market Analysis, Insights and Forecast - By Country/Sub-region
- 15.1.1 Brazil
- 15.1.2 Argentina
- 15.1.3 Rest of South America
- 16. Competitive Analysis
- 16.1. Global Market Share Analysis 2024
- 16.2. Company Profiles
- 16.2.1 Solaris Biotech
- 16.2.1.1. Overview
- 16.2.1.2. Products
- 16.2.1.3. SWOT Analysis
- 16.2.1.4. Recent Developments
- 16.2.1.5. Financials (Based on Availability)
- 16.2.2 Merck KGaA
- 16.2.2.1. Overview
- 16.2.2.2. Products
- 16.2.2.3. SWOT Analysis
- 16.2.2.4. Recent Developments
- 16.2.2.5. Financials (Based on Availability)
- 16.2.3 Solida Biotech GmBH
- 16.2.3.1. Overview
- 16.2.3.2. Products
- 16.2.3.3. SWOT Analysis
- 16.2.3.4. Recent Developments
- 16.2.3.5. Financials (Based on Availability)
- 16.2.4 GE Healthcare
- 16.2.4.1. Overview
- 16.2.4.2. Products
- 16.2.4.3. SWOT Analysis
- 16.2.4.4. Recent Developments
- 16.2.4.5. Financials (Based on Availability)
- 16.2.5 Thermo Fisher Scientific Inc
- 16.2.5.1. Overview
- 16.2.5.2. Products
- 16.2.5.3. SWOT Analysis
- 16.2.5.4. Recent Developments
- 16.2.5.5. Financials (Based on Availability)
- 16.2.6 Eppendorf AG
- 16.2.6.1. Overview
- 16.2.6.2. Products
- 16.2.6.3. SWOT Analysis
- 16.2.6.4. Recent Developments
- 16.2.6.5. Financials (Based on Availability)
- 16.2.7 Bioengineering AG
- 16.2.7.1. Overview
- 16.2.7.2. Products
- 16.2.7.3. SWOT Analysis
- 16.2.7.4. Recent Developments
- 16.2.7.5. Financials (Based on Availability)
- 16.2.8 Pall Corporation (Danaher Corporation)
- 16.2.8.1. Overview
- 16.2.8.2. Products
- 16.2.8.3. SWOT Analysis
- 16.2.8.4. Recent Developments
- 16.2.8.5. Financials (Based on Availability)
- 16.2.9 Sartorius AG
- 16.2.9.1. Overview
- 16.2.9.2. Products
- 16.2.9.3. SWOT Analysis
- 16.2.9.4. Recent Developments
- 16.2.9.5. Financials (Based on Availability)
- 16.2.10 Getinge AB
- 16.2.10.1. Overview
- 16.2.10.2. Products
- 16.2.10.3. SWOT Analysis
- 16.2.10.4. Recent Developments
- 16.2.10.5. Financials (Based on Availability)
- 16.2.11 Esco Lifesciences Group Ltd
- 16.2.11.1. Overview
- 16.2.11.2. Products
- 16.2.11.3. SWOT Analysis
- 16.2.11.4. Recent Developments
- 16.2.11.5. Financials (Based on Availability)
- 16.2.12 Infors HT
- 16.2.12.1. Overview
- 16.2.12.2. Products
- 16.2.12.3. SWOT Analysis
- 16.2.12.4. Recent Developments
- 16.2.12.5. Financials (Based on Availability)
- 16.2.1 Solaris Biotech
List of Figures
- Figure 1: Global Bioreactors Market Revenue Breakdown (Million, %) by Region 2024 & 2032
- Figure 2: North America Bioreactors Market Revenue (Million), by Country 2024 & 2032
- Figure 3: North America Bioreactors Market Revenue Share (%), by Country 2024 & 2032
- Figure 4: Europe Bioreactors Market Revenue (Million), by Country 2024 & 2032
- Figure 5: Europe Bioreactors Market Revenue Share (%), by Country 2024 & 2032
- Figure 6: Asia Pacific Bioreactors Market Revenue (Million), by Country 2024 & 2032
- Figure 7: Asia Pacific Bioreactors Market Revenue Share (%), by Country 2024 & 2032
- Figure 8: Middle East and Africa Bioreactors Market Revenue (Million), by Country 2024 & 2032
- Figure 9: Middle East and Africa Bioreactors Market Revenue Share (%), by Country 2024 & 2032
- Figure 10: South America Bioreactors Market Revenue (Million), by Country 2024 & 2032
- Figure 11: South America Bioreactors Market Revenue Share (%), by Country 2024 & 2032
- Figure 12: North America Bioreactors Market Revenue (Million), by Type 2024 & 2032
- Figure 13: North America Bioreactors Market Revenue Share (%), by Type 2024 & 2032
- Figure 14: North America Bioreactors Market Revenue (Million), by Usage 2024 & 2032
- Figure 15: North America Bioreactors Market Revenue Share (%), by Usage 2024 & 2032
- Figure 16: North America Bioreactors Market Revenue (Million), by Scale 2024 & 2032
- Figure 17: North America Bioreactors Market Revenue Share (%), by Scale 2024 & 2032
- Figure 18: North America Bioreactors Market Revenue (Million), by Control Type 2024 & 2032
- Figure 19: North America Bioreactors Market Revenue Share (%), by Control Type 2024 & 2032
- Figure 20: North America Bioreactors Market Revenue (Million), by Country 2024 & 2032
- Figure 21: North America Bioreactors Market Revenue Share (%), by Country 2024 & 2032
- Figure 22: Europe Bioreactors Market Revenue (Million), by Type 2024 & 2032
- Figure 23: Europe Bioreactors Market Revenue Share (%), by Type 2024 & 2032
- Figure 24: Europe Bioreactors Market Revenue (Million), by Usage 2024 & 2032
- Figure 25: Europe Bioreactors Market Revenue Share (%), by Usage 2024 & 2032
- Figure 26: Europe Bioreactors Market Revenue (Million), by Scale 2024 & 2032
- Figure 27: Europe Bioreactors Market Revenue Share (%), by Scale 2024 & 2032
- Figure 28: Europe Bioreactors Market Revenue (Million), by Control Type 2024 & 2032
- Figure 29: Europe Bioreactors Market Revenue Share (%), by Control Type 2024 & 2032
- Figure 30: Europe Bioreactors Market Revenue (Million), by Country 2024 & 2032
- Figure 31: Europe Bioreactors Market Revenue Share (%), by Country 2024 & 2032
- Figure 32: Asia Pacific Bioreactors Market Revenue (Million), by Type 2024 & 2032
- Figure 33: Asia Pacific Bioreactors Market Revenue Share (%), by Type 2024 & 2032
- Figure 34: Asia Pacific Bioreactors Market Revenue (Million), by Usage 2024 & 2032
- Figure 35: Asia Pacific Bioreactors Market Revenue Share (%), by Usage 2024 & 2032
- Figure 36: Asia Pacific Bioreactors Market Revenue (Million), by Scale 2024 & 2032
- Figure 37: Asia Pacific Bioreactors Market Revenue Share (%), by Scale 2024 & 2032
- Figure 38: Asia Pacific Bioreactors Market Revenue (Million), by Control Type 2024 & 2032
- Figure 39: Asia Pacific Bioreactors Market Revenue Share (%), by Control Type 2024 & 2032
- Figure 40: Asia Pacific Bioreactors Market Revenue (Million), by Country 2024 & 2032
- Figure 41: Asia Pacific Bioreactors Market Revenue Share (%), by Country 2024 & 2032
- Figure 42: Middle East and Africa Bioreactors Market Revenue (Million), by Type 2024 & 2032
- Figure 43: Middle East and Africa Bioreactors Market Revenue Share (%), by Type 2024 & 2032
- Figure 44: Middle East and Africa Bioreactors Market Revenue (Million), by Usage 2024 & 2032
- Figure 45: Middle East and Africa Bioreactors Market Revenue Share (%), by Usage 2024 & 2032
- Figure 46: Middle East and Africa Bioreactors Market Revenue (Million), by Scale 2024 & 2032
- Figure 47: Middle East and Africa Bioreactors Market Revenue Share (%), by Scale 2024 & 2032
- Figure 48: Middle East and Africa Bioreactors Market Revenue (Million), by Control Type 2024 & 2032
- Figure 49: Middle East and Africa Bioreactors Market Revenue Share (%), by Control Type 2024 & 2032
- Figure 50: Middle East and Africa Bioreactors Market Revenue (Million), by Country 2024 & 2032
- Figure 51: Middle East and Africa Bioreactors Market Revenue Share (%), by Country 2024 & 2032
- Figure 52: South America Bioreactors Market Revenue (Million), by Type 2024 & 2032
- Figure 53: South America Bioreactors Market Revenue Share (%), by Type 2024 & 2032
- Figure 54: South America Bioreactors Market Revenue (Million), by Usage 2024 & 2032
- Figure 55: South America Bioreactors Market Revenue Share (%), by Usage 2024 & 2032
- Figure 56: South America Bioreactors Market Revenue (Million), by Scale 2024 & 2032
- Figure 57: South America Bioreactors Market Revenue Share (%), by Scale 2024 & 2032
- Figure 58: South America Bioreactors Market Revenue (Million), by Control Type 2024 & 2032
- Figure 59: South America Bioreactors Market Revenue Share (%), by Control Type 2024 & 2032
- Figure 60: South America Bioreactors Market Revenue (Million), by Country 2024 & 2032
- Figure 61: South America Bioreactors Market Revenue Share (%), by Country 2024 & 2032
List of Tables
- Table 1: Global Bioreactors Market Revenue Million Forecast, by Region 2019 & 2032
- Table 2: Global Bioreactors Market Revenue Million Forecast, by Type 2019 & 2032
- Table 3: Global Bioreactors Market Revenue Million Forecast, by Usage 2019 & 2032
- Table 4: Global Bioreactors Market Revenue Million Forecast, by Scale 2019 & 2032
- Table 5: Global Bioreactors Market Revenue Million Forecast, by Control Type 2019 & 2032
- Table 6: Global Bioreactors Market Revenue Million Forecast, by Region 2019 & 2032
- Table 7: Global Bioreactors Market Revenue Million Forecast, by Country 2019 & 2032
- Table 8: United States Bioreactors Market Revenue (Million) Forecast, by Application 2019 & 2032
- Table 9: Canada Bioreactors Market Revenue (Million) Forecast, by Application 2019 & 2032
- Table 10: Mexico Bioreactors Market Revenue (Million) Forecast, by Application 2019 & 2032
- Table 11: Global Bioreactors Market Revenue Million Forecast, by Country 2019 & 2032
- Table 12: Germany Bioreactors Market Revenue (Million) Forecast, by Application 2019 & 2032
- Table 13: United Kingdom Bioreactors Market Revenue (Million) Forecast, by Application 2019 & 2032
- Table 14: France Bioreactors Market Revenue (Million) Forecast, by Application 2019 & 2032
- Table 15: Italy Bioreactors Market Revenue (Million) Forecast, by Application 2019 & 2032
- Table 16: Spain Bioreactors Market Revenue (Million) Forecast, by Application 2019 & 2032
- Table 17: Rest of Europe Bioreactors Market Revenue (Million) Forecast, by Application 2019 & 2032
- Table 18: Global Bioreactors Market Revenue Million Forecast, by Country 2019 & 2032
- Table 19: China Bioreactors Market Revenue (Million) Forecast, by Application 2019 & 2032
- Table 20: Japan Bioreactors Market Revenue (Million) Forecast, by Application 2019 & 2032
- Table 21: India Bioreactors Market Revenue (Million) Forecast, by Application 2019 & 2032
- Table 22: Australia Bioreactors Market Revenue (Million) Forecast, by Application 2019 & 2032
- Table 23: South Korea Bioreactors Market Revenue (Million) Forecast, by Application 2019 & 2032
- Table 24: Rest of Asia Pacific Bioreactors Market Revenue (Million) Forecast, by Application 2019 & 2032
- Table 25: Global Bioreactors Market Revenue Million Forecast, by Country 2019 & 2032
- Table 26: GCC Bioreactors Market Revenue (Million) Forecast, by Application 2019 & 2032
- Table 27: South Africa Bioreactors Market Revenue (Million) Forecast, by Application 2019 & 2032
- Table 28: Rest of Middle East and Africa Bioreactors Market Revenue (Million) Forecast, by Application 2019 & 2032
- Table 29: Global Bioreactors Market Revenue Million Forecast, by Country 2019 & 2032
- Table 30: Brazil Bioreactors Market Revenue (Million) Forecast, by Application 2019 & 2032
- Table 31: Argentina Bioreactors Market Revenue (Million) Forecast, by Application 2019 & 2032
- Table 32: Rest of South America Bioreactors Market Revenue (Million) Forecast, by Application 2019 & 2032
- Table 33: Global Bioreactors Market Revenue Million Forecast, by Type 2019 & 2032
- Table 34: Global Bioreactors Market Revenue Million Forecast, by Usage 2019 & 2032
- Table 35: Global Bioreactors Market Revenue Million Forecast, by Scale 2019 & 2032
- Table 36: Global Bioreactors Market Revenue Million Forecast, by Control Type 2019 & 2032
- Table 37: Global Bioreactors Market Revenue Million Forecast, by Country 2019 & 2032
- Table 38: United States Bioreactors Market Revenue (Million) Forecast, by Application 2019 & 2032
- Table 39: Canada Bioreactors Market Revenue (Million) Forecast, by Application 2019 & 2032
- Table 40: Mexico Bioreactors Market Revenue (Million) Forecast, by Application 2019 & 2032
- Table 41: Global Bioreactors Market Revenue Million Forecast, by Type 2019 & 2032
- Table 42: Global Bioreactors Market Revenue Million Forecast, by Usage 2019 & 2032
- Table 43: Global Bioreactors Market Revenue Million Forecast, by Scale 2019 & 2032
- Table 44: Global Bioreactors Market Revenue Million Forecast, by Control Type 2019 & 2032
- Table 45: Global Bioreactors Market Revenue Million Forecast, by Country 2019 & 2032
- Table 46: Germany Bioreactors Market Revenue (Million) Forecast, by Application 2019 & 2032
- Table 47: United Kingdom Bioreactors Market Revenue (Million) Forecast, by Application 2019 & 2032
- Table 48: France Bioreactors Market Revenue (Million) Forecast, by Application 2019 & 2032
- Table 49: Italy Bioreactors Market Revenue (Million) Forecast, by Application 2019 & 2032
- Table 50: Spain Bioreactors Market Revenue (Million) Forecast, by Application 2019 & 2032
- Table 51: Rest of Europe Bioreactors Market Revenue (Million) Forecast, by Application 2019 & 2032
- Table 52: Global Bioreactors Market Revenue Million Forecast, by Type 2019 & 2032
- Table 53: Global Bioreactors Market Revenue Million Forecast, by Usage 2019 & 2032
- Table 54: Global Bioreactors Market Revenue Million Forecast, by Scale 2019 & 2032
- Table 55: Global Bioreactors Market Revenue Million Forecast, by Control Type 2019 & 2032
- Table 56: Global Bioreactors Market Revenue Million Forecast, by Country 2019 & 2032
- Table 57: China Bioreactors Market Revenue (Million) Forecast, by Application 2019 & 2032
- Table 58: Japan Bioreactors Market Revenue (Million) Forecast, by Application 2019 & 2032
- Table 59: India Bioreactors Market Revenue (Million) Forecast, by Application 2019 & 2032
- Table 60: Australia Bioreactors Market Revenue (Million) Forecast, by Application 2019 & 2032
- Table 61: South Korea Bioreactors Market Revenue (Million) Forecast, by Application 2019 & 2032
- Table 62: Rest of Asia Pacific Bioreactors Market Revenue (Million) Forecast, by Application 2019 & 2032
- Table 63: Global Bioreactors Market Revenue Million Forecast, by Type 2019 & 2032
- Table 64: Global Bioreactors Market Revenue Million Forecast, by Usage 2019 & 2032
- Table 65: Global Bioreactors Market Revenue Million Forecast, by Scale 2019 & 2032
- Table 66: Global Bioreactors Market Revenue Million Forecast, by Control Type 2019 & 2032
- Table 67: Global Bioreactors Market Revenue Million Forecast, by Country 2019 & 2032
- Table 68: GCC Bioreactors Market Revenue (Million) Forecast, by Application 2019 & 2032
- Table 69: South Africa Bioreactors Market Revenue (Million) Forecast, by Application 2019 & 2032
- Table 70: Rest of Middle East and Africa Bioreactors Market Revenue (Million) Forecast, by Application 2019 & 2032
- Table 71: Global Bioreactors Market Revenue Million Forecast, by Type 2019 & 2032
- Table 72: Global Bioreactors Market Revenue Million Forecast, by Usage 2019 & 2032
- Table 73: Global Bioreactors Market Revenue Million Forecast, by Scale 2019 & 2032
- Table 74: Global Bioreactors Market Revenue Million Forecast, by Control Type 2019 & 2032
- Table 75: Global Bioreactors Market Revenue Million Forecast, by Country 2019 & 2032
- Table 76: Brazil Bioreactors Market Revenue (Million) Forecast, by Application 2019 & 2032
- Table 77: Argentina Bioreactors Market Revenue (Million) Forecast, by Application 2019 & 2032
- Table 78: Rest of South America Bioreactors Market Revenue (Million) Forecast, by Application 2019 & 2032
Frequently Asked Questions
1. What is the projected Compound Annual Growth Rate (CAGR) of the Bioreactors Market?
The projected CAGR is approximately 7.45%.
2. Which companies are prominent players in the Bioreactors Market?
Key companies in the market include Solaris Biotech, Merck KGaA, Solida Biotech GmBH, GE Healthcare, Thermo Fisher Scientific Inc, Eppendorf AG, Bioengineering AG, Pall Corporation (Danaher Corporation), Sartorius AG, Getinge AB, Esco Lifesciences Group Ltd, Infors HT.
3. What are the main segments of the Bioreactors Market?
The market segments include Type, Usage, Scale, Control Type.
4. Can you provide details about the market size?
The market size is estimated to be USD 5.31 Million as of 2022.
5. What are some drivers contributing to market growth?
Growth of Bioreactors in Pharmaceuticals; Technological Advancements in Bioreactors; Adoption of Single-use bioreactors (SUBs) and Hybrid Bioreactors.
6. What are the notable trends driving market growth?
The Single-use Bioreactors Segment is Expected to Have A High Growth Rate During the Forecast Period.
7. Are there any restraints impacting market growth?
Concerns Regarding the Use of Single-use Bioreactors (SUBs); Limited Storage Capacity.
8. Can you provide examples of recent developments in the market?
October 2022: Getinge AB announced that their bioreactors will support the Dutch government's initiative to produce animal products such as meat and milk proteins directly from animal and microbial cells.
9. What pricing options are available for accessing the report?
Pricing options include single-user, multi-user, and enterprise licenses priced at USD 4750, USD 5250, and USD 8750 respectively.
10. Is the market size provided in terms of value or volume?
The market size is provided in terms of value, measured in Million.
11. Are there any specific market keywords associated with the report?
Yes, the market keyword associated with the report is "Bioreactors Market," which aids in identifying and referencing the specific market segment covered.
12. How do I determine which pricing option suits my needs best?
The pricing options vary based on user requirements and access needs. Individual users may opt for single-user licenses, while businesses requiring broader access may choose multi-user or enterprise licenses for cost-effective access to the report.
13. Are there any additional resources or data provided in the Bioreactors Market report?
While the report offers comprehensive insights, it's advisable to review the specific contents or supplementary materials provided to ascertain if additional resources or data are available.
14. How can I stay updated on further developments or reports in the Bioreactors Market?
To stay informed about further developments, trends, and reports in the Bioreactors Market, consider subscribing to industry newsletters, following relevant companies and organizations, or regularly checking reputable industry news sources and publications.
Methodology
Step 1 - Identification of Relevant Samples Size from Population Database


Step 2 - Approaches for Defining Global Market Size (Value, Volume* & Price*)

Note*: In applicable scenarios
Step 3 - Data Sources
Primary Research
- Web Analytics
- Survey Reports
- Research Institute
- Latest Research Reports
- Opinion Leaders
Secondary Research
- Annual Reports
- White Paper
- Latest Press Release
- Industry Association
- Paid Database
- Investor Presentations

Step 4 - Data Triangulation
Involves using different sources of information in order to increase the validity of a study
These sources are likely to be stakeholders in a program - participants, other researchers, program staff, other community members, and so on.
Then we put all data in single framework & apply various statistical tools to find out the dynamic on the market.
During the analysis stage, feedback from the stakeholder groups would be compared to determine areas of agreement as well as areas of divergence


