
Key Insights
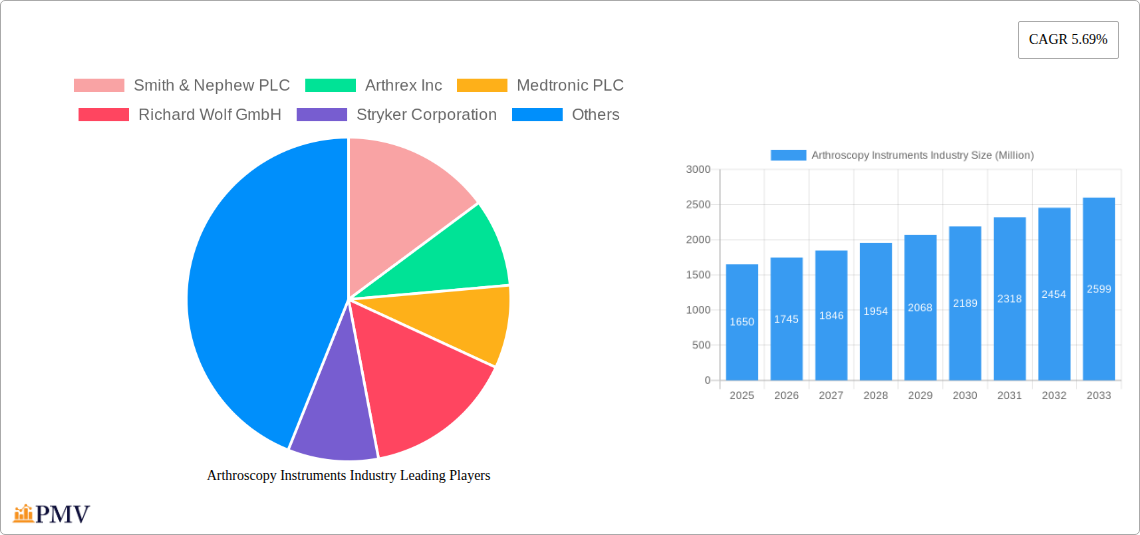
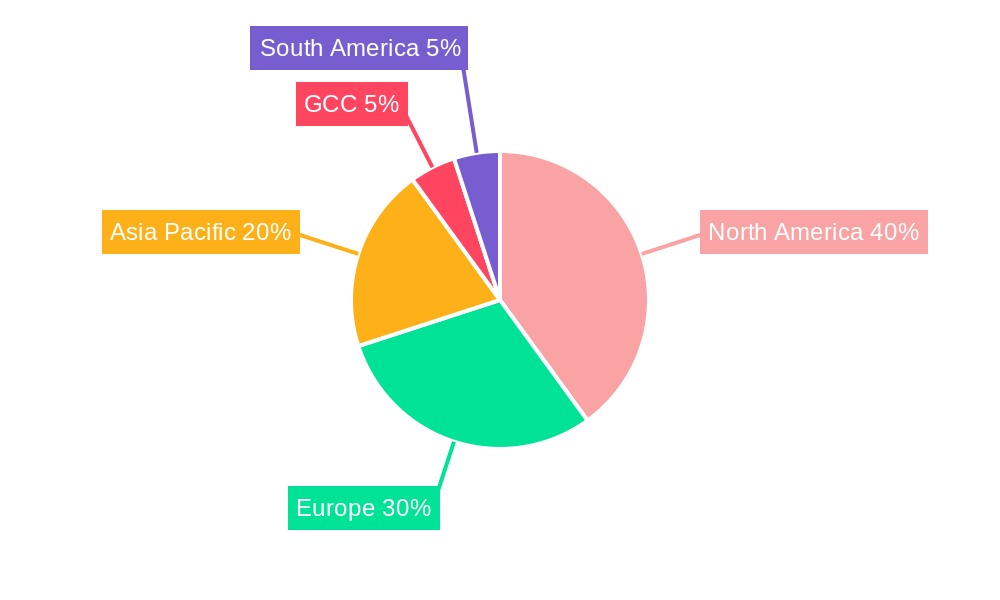
The global arthroscopy instruments market, valued at $1.65 billion in 2025, is projected to experience robust growth, driven by a rising geriatric population, increasing prevalence of osteoarthritis and sports-related injuries, and advancements in minimally invasive surgical techniques. The market's Compound Annual Growth Rate (CAGR) of 5.69% from 2019 to 2024 indicates a consistently expanding demand for arthroscopic procedures. Key product segments include arthroscopes, implants, fluid management systems, radiofrequency (RF) systems, and visualization systems, each contributing significantly to the overall market value. Knee arthroscopy remains the dominant application segment, followed by hip and shoulder arthroscopy. The increasing adoption of advanced imaging technologies and the development of less invasive instruments are key trends shaping the market. However, factors such as high procedure costs and potential risks associated with arthroscopy are expected to somewhat restrain market growth. Leading players, including Smith & Nephew, Arthrex, Medtronic, and Stryker, are actively engaged in research and development, focusing on innovative product launches and strategic partnerships to maintain their competitive edge. Geographical analysis suggests that North America and Europe currently hold the largest market shares due to well-established healthcare infrastructure and high adoption rates. However, the Asia-Pacific region is anticipated to demonstrate significant growth potential in the coming years due to rising disposable incomes and improving healthcare access.
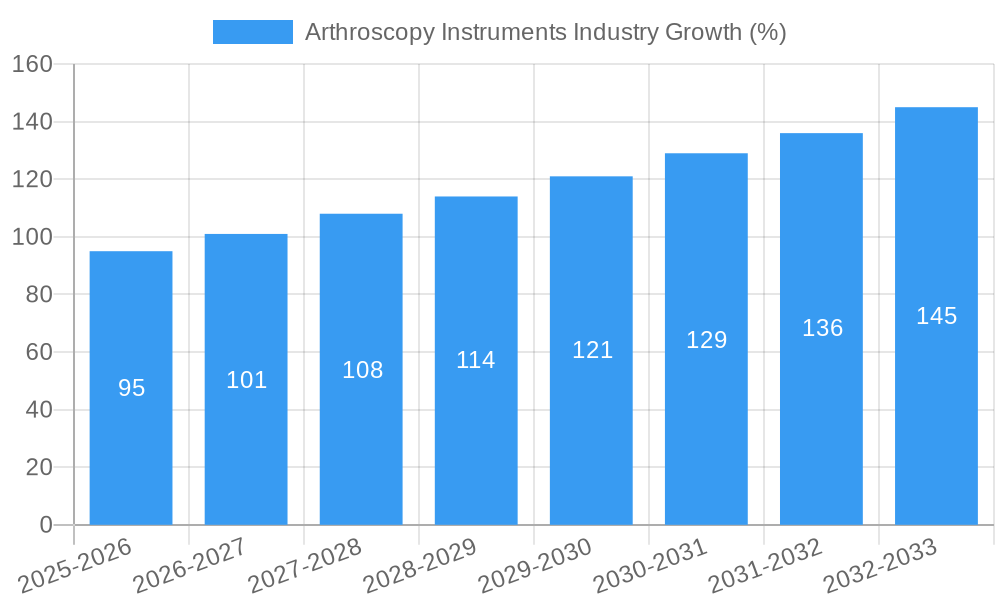
The forecast period from 2025 to 2033 promises continued expansion, with a projected market size exceeding $2.6 billion by 2033, assuming sustained CAGR and steady market penetration of minimally invasive surgical practices. This growth will be fueled by several factors, including increasing awareness of arthroscopic procedures' benefits, technological advancements leading to improved surgical outcomes, and expanding indications for arthroscopy beyond traditional applications. Competition among manufacturers will remain intense, driven by innovation, product differentiation, and geographic expansion strategies. Companies will likely focus on enhancing their product portfolios to meet the evolving needs of surgeons and patients, focusing on areas such as improved ergonomics, enhanced visualization capabilities, and integration with advanced surgical technologies.
This comprehensive report provides a detailed analysis of the Arthroscopy Instruments industry, offering actionable insights for stakeholders across the value chain. The study period spans from 2019 to 2033, with 2025 serving as the base and estimated year. The report meticulously examines market trends, competitive dynamics, segment performance, and future growth potential, empowering informed decision-making for businesses and investors. The global market is projected to reach xx Million by 2033, exhibiting a CAGR of xx% during the forecast period (2025-2033).
Arthroscopy Instruments Industry Market Structure & Competitive Dynamics
The Arthroscopy Instruments market is characterized by a moderately concentrated structure, with key players like Smith & Nephew PLC, Arthrex Inc, Medtronic PLC, Richard Wolf GmbH, Stryker Corporation, Karl Storz GmbH & Co KG, Conmed Corporation, and Johnson & Johnson holding significant market share. The competitive landscape is dynamic, driven by continuous product innovation, strategic acquisitions, and intense rivalry. Market concentration is estimated at xx% in 2025, reflecting the presence of a few dominant players.
The industry's innovation ecosystem thrives on collaborations between established players and emerging medical technology companies. Stringent regulatory frameworks, particularly concerning device safety and efficacy, govern market operations. While the industry witnesses limited direct product substitution, advancements in minimally invasive surgical techniques and alternative treatment options indirectly influence market growth. End-user preferences for advanced technologies, improved surgical outcomes, and cost-effectiveness shape market demand.
Mergers and acquisitions (M&A) have played a vital role in shaping the competitive landscape. Significant M&A activity, valued at an estimated xx Million in the past five years, reflects strategic expansion strategies among leading players. Key examples include (details on specific M&A activities would be included in the full report).
Arthroscopy Instruments Industry Industry Trends & Insights
The Arthroscopy Instruments market demonstrates robust growth, fueled by several key factors. The increasing prevalence of orthopedic conditions, coupled with the rising preference for minimally invasive surgical procedures, significantly boosts demand for arthroscopy instruments. Technological advancements, such as the development of advanced visualization systems and robotic-assisted arthroscopy, enhance surgical precision and patient outcomes, further stimulating market growth.
Consumer preferences are shifting towards more sophisticated and user-friendly instruments, leading manufacturers to prioritize ergonomics, enhanced functionalities, and improved durability in their product design. The competitive dynamics remain intense, with companies investing heavily in research and development to introduce innovative products and expand their market share. The market penetration of advanced arthroscopy instruments, such as robotic-assisted systems, is gradually increasing, with projections indicating substantial growth in the coming years. The industry's CAGR from 2019 to 2024 is estimated at xx%, showcasing its significant market growth trajectory.
Dominant Markets & Segments in Arthroscopy Instruments Industry
The North American region currently dominates the Arthroscopy Instruments market, driven by high healthcare expenditure, advanced medical infrastructure, and a sizable patient population. However, emerging economies in Asia-Pacific are demonstrating rapid growth, driven by rising disposable incomes, increasing healthcare awareness, and government initiatives to improve healthcare infrastructure.
Product Segments:
- Arthroscopes: High demand due to their indispensable role in arthroscopic procedures.
- Arthroscopic Implants: Market growth propelled by advancements in biomaterials and implant design.
- Fluid Management Systems: Essential for maintaining optimal surgical conditions, driving consistent demand.
- Radiofrequency (RF) Systems: Growing use in soft tissue ablation and other arthroscopic procedures.
- Visualization Systems: Technological advancements and improved image quality stimulate growth.
- Other Products: Includes ancillary instruments and disposables crucial for surgical workflows.
Application Segments:
- Knee Arthroscopy: The largest segment, owing to the high prevalence of knee injuries and arthritic conditions.
- Shoulder and Elbow Arthroscopy: Significant market growth fueled by increased sports participation and related injuries.
- Hip Arthroscopy: A growing segment due to rising awareness and increased use in hip-related surgeries.
- Spine Arthroscopy: Market expansion supported by growing demand for minimally invasive spine surgeries.
- Other Arthroscopy Applications: Includes specialized applications and niche procedures.
Arthroscopy Instruments Industry Product Innovations
Recent innovations focus on improving surgical precision, reducing invasiveness, and enhancing patient recovery. Smart arthroscopes with integrated imaging and data analysis capabilities, along with minimally invasive surgical instruments and advanced implant designs, are transforming arthroscopic procedures. These advancements are improving surgical outcomes, shortening recovery time, and leading to increased adoption by surgeons and medical facilities. The market is witnessing a rise in single-use arthroscopy instruments for better infection control.
Report Segmentation & Scope
The report segments the Arthroscopy Instruments market based on product type (Arthroscope, Arthroscopic Implant, Fluid Management System, Radiofrequency (RF) System, Visualization System, Other Products) and application (Knee Arthroscopy, Hip Arthroscopy, Spine Arthroscopy, Shoulder and Elbow Arthroscopy, Other Arthroscopy Applications). Each segment's market size, growth projections, and competitive dynamics are thoroughly analyzed. The report also includes regional segmentation, providing a comprehensive overview of market trends across different geographical regions. Details on projected market sizes for each segment are included in the full report.
Key Drivers of Arthroscopy Instruments Industry Growth
Technological advancements are a primary driver, leading to improved instrument designs, enhanced visualization systems, and minimally invasive surgical techniques. The rising prevalence of orthopedic conditions and an aging global population increase the demand for arthroscopic procedures. Favorable regulatory frameworks and increasing healthcare expenditure further contribute to market growth.
Challenges in the Arthroscopy Instruments Industry Sector
Stringent regulatory approvals and reimbursement policies can pose significant barriers to market entry and growth. Supply chain disruptions and price pressures from generic and low-cost alternatives can impact profitability. Intense competition and the need for continuous innovation to maintain a competitive edge present ongoing challenges. The global economic conditions can also affect the market dynamics and investment decisions.
Leading Players in the Arthroscopy Instruments Industry Market
- Smith & Nephew PLC
- Arthrex Inc
- Medtronic PLC
- Richard Wolf GmbH
- Stryker Corporation
- Karl Storz GmbH & Co KG
- Conmed Corporation
- Johnson & Johnson
Key Developments in Arthroscopy Instruments Industry Sector
- December 2020: Arthrex Inc. launched SwiveLock ACL Repair Kit, the first and only Food and Drug Administration-cleared primary repair kit for repairing anterior cruciate ligament (ACL) tears. This launch significantly impacted the ACL repair segment.
- February 2022: Formus Labs raised USD 5 Million and struck a partnership with Zimmer Biomet for the co-development and global distribution of its technology. This partnership expanded the market reach of Formus Labs' technology.
Strategic Arthroscopy Instruments Industry Market Outlook
The Arthroscopy Instruments market is poised for continued growth, driven by technological innovation and increasing demand for minimally invasive surgical procedures. Strategic opportunities exist for companies that can develop advanced instruments, expand into emerging markets, and foster collaborations to enhance their product portfolios. The focus on personalized medicine and data-driven insights will further shape the market's future trajectory.
Arthroscopy Instruments Industry Segmentation
-
1. Application
- 1.1. Knee Arthroscopy
- 1.2. Hip Arthroscopy
- 1.3. Spine Arthroscopy
- 1.4. Shoulder and Elbow Arthroscopy
- 1.5. Other Arthroscopy Applications
-
2. Product
- 2.1. Arthroscope
- 2.2. Arthroscopic Implant
- 2.3. Fluid Management System
- 2.4. Radiofrequency (RF) System
- 2.5. Visualization System
- 2.6. Other Products
Arthroscopy Instruments Industry Segmentation By Geography
-
1. North America
- 1.1. United States
- 1.2. Canada
- 1.3. Mexico
-
2. Europe
- 2.1. Germany
- 2.2. United Kingdom
- 2.3. France
- 2.4. Italy
- 2.5. Spain
- 2.6. Rest of Europe
-
3. Asia Pacific
- 3.1. China
- 3.2. Japan
- 3.3. India
- 3.4. Australia
- 3.5. South korea
- 3.6. Rest of Asia Pacific
- 4. Middle East
-
5. GCC
- 5.1. South Africa
- 5.2. Rest of Middle East
-
6. South America
- 6.1. Brazil
- 6.2. Argentina
- 6.3. Rest of South America
Arthroscopy Instruments Industry REPORT HIGHLIGHTS
| Aspects | Details |
|---|---|
| Study Period | 2019-2033 |
| Base Year | 2024 |
| Estimated Year | 2025 |
| Forecast Period | 2025-2033 |
| Historical Period | 2019-2024 |
| Growth Rate | CAGR of 5.69% from 2019-2033 |
| Segmentation |
|
Table of Contents
- 1. Introduction
- 1.1. Research Scope
- 1.2. Market Segmentation
- 1.3. Research Methodology
- 1.4. Definitions and Assumptions
- 2. Executive Summary
- 2.1. Introduction
- 3. Market Dynamics
- 3.1. Introduction
- 3.2. Market Drivers
- 3.2.1. Increasing Incidences of Sports Injuries; Rising Geriatric Population; Technological Advancements in Arthroscopic Implants
- 3.3. Market Restrains
- 3.3.1. Lack of Skilled Surgeons; Stringent Regulatory Requirements; High Cost of Arthroscopy Devices
- 3.4. Market Trends
- 3.4.1. Knee Arthroscopy Segment is Expected to Witness Growth Over the Forecast Period
- 4. Market Factor Analysis
- 4.1. Porters Five Forces
- 4.2. Supply/Value Chain
- 4.3. PESTEL analysis
- 4.4. Market Entropy
- 4.5. Patent/Trademark Analysis
- 5. Global Arthroscopy Instruments Industry Analysis, Insights and Forecast, 2019-2031
- 5.1. Market Analysis, Insights and Forecast - by Application
- 5.1.1. Knee Arthroscopy
- 5.1.2. Hip Arthroscopy
- 5.1.3. Spine Arthroscopy
- 5.1.4. Shoulder and Elbow Arthroscopy
- 5.1.5. Other Arthroscopy Applications
- 5.2. Market Analysis, Insights and Forecast - by Product
- 5.2.1. Arthroscope
- 5.2.2. Arthroscopic Implant
- 5.2.3. Fluid Management System
- 5.2.4. Radiofrequency (RF) System
- 5.2.5. Visualization System
- 5.2.6. Other Products
- 5.3. Market Analysis, Insights and Forecast - by Region
- 5.3.1. North America
- 5.3.2. Europe
- 5.3.3. Asia Pacific
- 5.3.4. Middle East
- 5.3.5. GCC
- 5.3.6. South America
- 5.1. Market Analysis, Insights and Forecast - by Application
- 6. North America Arthroscopy Instruments Industry Analysis, Insights and Forecast, 2019-2031
- 6.1. Market Analysis, Insights and Forecast - by Application
- 6.1.1. Knee Arthroscopy
- 6.1.2. Hip Arthroscopy
- 6.1.3. Spine Arthroscopy
- 6.1.4. Shoulder and Elbow Arthroscopy
- 6.1.5. Other Arthroscopy Applications
- 6.2. Market Analysis, Insights and Forecast - by Product
- 6.2.1. Arthroscope
- 6.2.2. Arthroscopic Implant
- 6.2.3. Fluid Management System
- 6.2.4. Radiofrequency (RF) System
- 6.2.5. Visualization System
- 6.2.6. Other Products
- 6.1. Market Analysis, Insights and Forecast - by Application
- 7. Europe Arthroscopy Instruments Industry Analysis, Insights and Forecast, 2019-2031
- 7.1. Market Analysis, Insights and Forecast - by Application
- 7.1.1. Knee Arthroscopy
- 7.1.2. Hip Arthroscopy
- 7.1.3. Spine Arthroscopy
- 7.1.4. Shoulder and Elbow Arthroscopy
- 7.1.5. Other Arthroscopy Applications
- 7.2. Market Analysis, Insights and Forecast - by Product
- 7.2.1. Arthroscope
- 7.2.2. Arthroscopic Implant
- 7.2.3. Fluid Management System
- 7.2.4. Radiofrequency (RF) System
- 7.2.5. Visualization System
- 7.2.6. Other Products
- 7.1. Market Analysis, Insights and Forecast - by Application
- 8. Asia Pacific Arthroscopy Instruments Industry Analysis, Insights and Forecast, 2019-2031
- 8.1. Market Analysis, Insights and Forecast - by Application
- 8.1.1. Knee Arthroscopy
- 8.1.2. Hip Arthroscopy
- 8.1.3. Spine Arthroscopy
- 8.1.4. Shoulder and Elbow Arthroscopy
- 8.1.5. Other Arthroscopy Applications
- 8.2. Market Analysis, Insights and Forecast - by Product
- 8.2.1. Arthroscope
- 8.2.2. Arthroscopic Implant
- 8.2.3. Fluid Management System
- 8.2.4. Radiofrequency (RF) System
- 8.2.5. Visualization System
- 8.2.6. Other Products
- 8.1. Market Analysis, Insights and Forecast - by Application
- 9. Middle East Arthroscopy Instruments Industry Analysis, Insights and Forecast, 2019-2031
- 9.1. Market Analysis, Insights and Forecast - by Application
- 9.1.1. Knee Arthroscopy
- 9.1.2. Hip Arthroscopy
- 9.1.3. Spine Arthroscopy
- 9.1.4. Shoulder and Elbow Arthroscopy
- 9.1.5. Other Arthroscopy Applications
- 9.2. Market Analysis, Insights and Forecast - by Product
- 9.2.1. Arthroscope
- 9.2.2. Arthroscopic Implant
- 9.2.3. Fluid Management System
- 9.2.4. Radiofrequency (RF) System
- 9.2.5. Visualization System
- 9.2.6. Other Products
- 9.1. Market Analysis, Insights and Forecast - by Application
- 10. GCC Arthroscopy Instruments Industry Analysis, Insights and Forecast, 2019-2031
- 10.1. Market Analysis, Insights and Forecast - by Application
- 10.1.1. Knee Arthroscopy
- 10.1.2. Hip Arthroscopy
- 10.1.3. Spine Arthroscopy
- 10.1.4. Shoulder and Elbow Arthroscopy
- 10.1.5. Other Arthroscopy Applications
- 10.2. Market Analysis, Insights and Forecast - by Product
- 10.2.1. Arthroscope
- 10.2.2. Arthroscopic Implant
- 10.2.3. Fluid Management System
- 10.2.4. Radiofrequency (RF) System
- 10.2.5. Visualization System
- 10.2.6. Other Products
- 10.1. Market Analysis, Insights and Forecast - by Application
- 11. South America Arthroscopy Instruments Industry Analysis, Insights and Forecast, 2019-2031
- 11.1. Market Analysis, Insights and Forecast - by Application
- 11.1.1. Knee Arthroscopy
- 11.1.2. Hip Arthroscopy
- 11.1.3. Spine Arthroscopy
- 11.1.4. Shoulder and Elbow Arthroscopy
- 11.1.5. Other Arthroscopy Applications
- 11.2. Market Analysis, Insights and Forecast - by Product
- 11.2.1. Arthroscope
- 11.2.2. Arthroscopic Implant
- 11.2.3. Fluid Management System
- 11.2.4. Radiofrequency (RF) System
- 11.2.5. Visualization System
- 11.2.6. Other Products
- 11.1. Market Analysis, Insights and Forecast - by Application
- 12. North America Arthroscopy Instruments Industry Analysis, Insights and Forecast, 2019-2031
- 12.1. Market Analysis, Insights and Forecast - By Country/Sub-region
- 12.1.1. undefined
- 13. Europe Arthroscopy Instruments Industry Analysis, Insights and Forecast, 2019-2031
- 13.1. Market Analysis, Insights and Forecast - By Country/Sub-region
- 13.1.1. undefined
- 14. Asia Pacific Arthroscopy Instruments Industry Analysis, Insights and Forecast, 2019-2031
- 14.1. Market Analysis, Insights and Forecast - By Country/Sub-region
- 14.1.1. undefined
- 15. GCC Arthroscopy Instruments Industry Analysis, Insights and Forecast, 2019-2031
- 15.1. Market Analysis, Insights and Forecast - By Country/Sub-region
- 15.1.1. undefined
- 16. South America Arthroscopy Instruments Industry Analysis, Insights and Forecast, 2019-2031
- 16.1. Market Analysis, Insights and Forecast - By Country/Sub-region
- 16.1.1. undefined
- 17. Competitive Analysis
- 17.1. Global Market Share Analysis 2024
- 17.2. Company Profiles
- 17.2.1 Smith & Nephew PLC
- 17.2.1.1. Overview
- 17.2.1.2. Products
- 17.2.1.3. SWOT Analysis
- 17.2.1.4. Recent Developments
- 17.2.1.5. Financials (Based on Availability)
- 17.2.2 Arthrex Inc
- 17.2.2.1. Overview
- 17.2.2.2. Products
- 17.2.2.3. SWOT Analysis
- 17.2.2.4. Recent Developments
- 17.2.2.5. Financials (Based on Availability)
- 17.2.3 Medtronic PLC
- 17.2.3.1. Overview
- 17.2.3.2. Products
- 17.2.3.3. SWOT Analysis
- 17.2.3.4. Recent Developments
- 17.2.3.5. Financials (Based on Availability)
- 17.2.4 Richard Wolf GmbH
- 17.2.4.1. Overview
- 17.2.4.2. Products
- 17.2.4.3. SWOT Analysis
- 17.2.4.4. Recent Developments
- 17.2.4.5. Financials (Based on Availability)
- 17.2.5 Stryker Corporation
- 17.2.5.1. Overview
- 17.2.5.2. Products
- 17.2.5.3. SWOT Analysis
- 17.2.5.4. Recent Developments
- 17.2.5.5. Financials (Based on Availability)
- 17.2.6 Karl Storz GmbH & Co KG
- 17.2.6.1. Overview
- 17.2.6.2. Products
- 17.2.6.3. SWOT Analysis
- 17.2.6.4. Recent Developments
- 17.2.6.5. Financials (Based on Availability)
- 17.2.7 Conmed Corporation
- 17.2.7.1. Overview
- 17.2.7.2. Products
- 17.2.7.3. SWOT Analysis
- 17.2.7.4. Recent Developments
- 17.2.7.5. Financials (Based on Availability)
- 17.2.8 Johnson & Johnson
- 17.2.8.1. Overview
- 17.2.8.2. Products
- 17.2.8.3. SWOT Analysis
- 17.2.8.4. Recent Developments
- 17.2.8.5. Financials (Based on Availability)
- 17.2.1 Smith & Nephew PLC
List of Figures
- Figure 1: Global Arthroscopy Instruments Industry Revenue Breakdown (Million, %) by Region 2024 & 2032
- Figure 2: Global Arthroscopy Instruments Industry Volume Breakdown (K Unit, %) by Region 2024 & 2032
- Figure 3: North America Arthroscopy Instruments Industry Revenue (Million), by Country 2024 & 2032
- Figure 4: North America Arthroscopy Instruments Industry Volume (K Unit), by Country 2024 & 2032
- Figure 5: North America Arthroscopy Instruments Industry Revenue Share (%), by Country 2024 & 2032
- Figure 6: North America Arthroscopy Instruments Industry Volume Share (%), by Country 2024 & 2032
- Figure 7: Europe Arthroscopy Instruments Industry Revenue (Million), by Country 2024 & 2032
- Figure 8: Europe Arthroscopy Instruments Industry Volume (K Unit), by Country 2024 & 2032
- Figure 9: Europe Arthroscopy Instruments Industry Revenue Share (%), by Country 2024 & 2032
- Figure 10: Europe Arthroscopy Instruments Industry Volume Share (%), by Country 2024 & 2032
- Figure 11: Asia Pacific Arthroscopy Instruments Industry Revenue (Million), by Country 2024 & 2032
- Figure 12: Asia Pacific Arthroscopy Instruments Industry Volume (K Unit), by Country 2024 & 2032
- Figure 13: Asia Pacific Arthroscopy Instruments Industry Revenue Share (%), by Country 2024 & 2032
- Figure 14: Asia Pacific Arthroscopy Instruments Industry Volume Share (%), by Country 2024 & 2032
- Figure 15: GCC Arthroscopy Instruments Industry Revenue (Million), by Country 2024 & 2032
- Figure 16: GCC Arthroscopy Instruments Industry Volume (K Unit), by Country 2024 & 2032
- Figure 17: GCC Arthroscopy Instruments Industry Revenue Share (%), by Country 2024 & 2032
- Figure 18: GCC Arthroscopy Instruments Industry Volume Share (%), by Country 2024 & 2032
- Figure 19: South America Arthroscopy Instruments Industry Revenue (Million), by Country 2024 & 2032
- Figure 20: South America Arthroscopy Instruments Industry Volume (K Unit), by Country 2024 & 2032
- Figure 21: South America Arthroscopy Instruments Industry Revenue Share (%), by Country 2024 & 2032
- Figure 22: South America Arthroscopy Instruments Industry Volume Share (%), by Country 2024 & 2032
- Figure 23: North America Arthroscopy Instruments Industry Revenue (Million), by Application 2024 & 2032
- Figure 24: North America Arthroscopy Instruments Industry Volume (K Unit), by Application 2024 & 2032
- Figure 25: North America Arthroscopy Instruments Industry Revenue Share (%), by Application 2024 & 2032
- Figure 26: North America Arthroscopy Instruments Industry Volume Share (%), by Application 2024 & 2032
- Figure 27: North America Arthroscopy Instruments Industry Revenue (Million), by Product 2024 & 2032
- Figure 28: North America Arthroscopy Instruments Industry Volume (K Unit), by Product 2024 & 2032
- Figure 29: North America Arthroscopy Instruments Industry Revenue Share (%), by Product 2024 & 2032
- Figure 30: North America Arthroscopy Instruments Industry Volume Share (%), by Product 2024 & 2032
- Figure 31: North America Arthroscopy Instruments Industry Revenue (Million), by Country 2024 & 2032
- Figure 32: North America Arthroscopy Instruments Industry Volume (K Unit), by Country 2024 & 2032
- Figure 33: North America Arthroscopy Instruments Industry Revenue Share (%), by Country 2024 & 2032
- Figure 34: North America Arthroscopy Instruments Industry Volume Share (%), by Country 2024 & 2032
- Figure 35: Europe Arthroscopy Instruments Industry Revenue (Million), by Application 2024 & 2032
- Figure 36: Europe Arthroscopy Instruments Industry Volume (K Unit), by Application 2024 & 2032
- Figure 37: Europe Arthroscopy Instruments Industry Revenue Share (%), by Application 2024 & 2032
- Figure 38: Europe Arthroscopy Instruments Industry Volume Share (%), by Application 2024 & 2032
- Figure 39: Europe Arthroscopy Instruments Industry Revenue (Million), by Product 2024 & 2032
- Figure 40: Europe Arthroscopy Instruments Industry Volume (K Unit), by Product 2024 & 2032
- Figure 41: Europe Arthroscopy Instruments Industry Revenue Share (%), by Product 2024 & 2032
- Figure 42: Europe Arthroscopy Instruments Industry Volume Share (%), by Product 2024 & 2032
- Figure 43: Europe Arthroscopy Instruments Industry Revenue (Million), by Country 2024 & 2032
- Figure 44: Europe Arthroscopy Instruments Industry Volume (K Unit), by Country 2024 & 2032
- Figure 45: Europe Arthroscopy Instruments Industry Revenue Share (%), by Country 2024 & 2032
- Figure 46: Europe Arthroscopy Instruments Industry Volume Share (%), by Country 2024 & 2032
- Figure 47: Asia Pacific Arthroscopy Instruments Industry Revenue (Million), by Application 2024 & 2032
- Figure 48: Asia Pacific Arthroscopy Instruments Industry Volume (K Unit), by Application 2024 & 2032
- Figure 49: Asia Pacific Arthroscopy Instruments Industry Revenue Share (%), by Application 2024 & 2032
- Figure 50: Asia Pacific Arthroscopy Instruments Industry Volume Share (%), by Application 2024 & 2032
- Figure 51: Asia Pacific Arthroscopy Instruments Industry Revenue (Million), by Product 2024 & 2032
- Figure 52: Asia Pacific Arthroscopy Instruments Industry Volume (K Unit), by Product 2024 & 2032
- Figure 53: Asia Pacific Arthroscopy Instruments Industry Revenue Share (%), by Product 2024 & 2032
- Figure 54: Asia Pacific Arthroscopy Instruments Industry Volume Share (%), by Product 2024 & 2032
- Figure 55: Asia Pacific Arthroscopy Instruments Industry Revenue (Million), by Country 2024 & 2032
- Figure 56: Asia Pacific Arthroscopy Instruments Industry Volume (K Unit), by Country 2024 & 2032
- Figure 57: Asia Pacific Arthroscopy Instruments Industry Revenue Share (%), by Country 2024 & 2032
- Figure 58: Asia Pacific Arthroscopy Instruments Industry Volume Share (%), by Country 2024 & 2032
- Figure 59: Middle East Arthroscopy Instruments Industry Revenue (Million), by Application 2024 & 2032
- Figure 60: Middle East Arthroscopy Instruments Industry Volume (K Unit), by Application 2024 & 2032
- Figure 61: Middle East Arthroscopy Instruments Industry Revenue Share (%), by Application 2024 & 2032
- Figure 62: Middle East Arthroscopy Instruments Industry Volume Share (%), by Application 2024 & 2032
- Figure 63: Middle East Arthroscopy Instruments Industry Revenue (Million), by Product 2024 & 2032
- Figure 64: Middle East Arthroscopy Instruments Industry Volume (K Unit), by Product 2024 & 2032
- Figure 65: Middle East Arthroscopy Instruments Industry Revenue Share (%), by Product 2024 & 2032
- Figure 66: Middle East Arthroscopy Instruments Industry Volume Share (%), by Product 2024 & 2032
- Figure 67: Middle East Arthroscopy Instruments Industry Revenue (Million), by Country 2024 & 2032
- Figure 68: Middle East Arthroscopy Instruments Industry Volume (K Unit), by Country 2024 & 2032
- Figure 69: Middle East Arthroscopy Instruments Industry Revenue Share (%), by Country 2024 & 2032
- Figure 70: Middle East Arthroscopy Instruments Industry Volume Share (%), by Country 2024 & 2032
- Figure 71: GCC Arthroscopy Instruments Industry Revenue (Million), by Application 2024 & 2032
- Figure 72: GCC Arthroscopy Instruments Industry Volume (K Unit), by Application 2024 & 2032
- Figure 73: GCC Arthroscopy Instruments Industry Revenue Share (%), by Application 2024 & 2032
- Figure 74: GCC Arthroscopy Instruments Industry Volume Share (%), by Application 2024 & 2032
- Figure 75: GCC Arthroscopy Instruments Industry Revenue (Million), by Product 2024 & 2032
- Figure 76: GCC Arthroscopy Instruments Industry Volume (K Unit), by Product 2024 & 2032
- Figure 77: GCC Arthroscopy Instruments Industry Revenue Share (%), by Product 2024 & 2032
- Figure 78: GCC Arthroscopy Instruments Industry Volume Share (%), by Product 2024 & 2032
- Figure 79: GCC Arthroscopy Instruments Industry Revenue (Million), by Country 2024 & 2032
- Figure 80: GCC Arthroscopy Instruments Industry Volume (K Unit), by Country 2024 & 2032
- Figure 81: GCC Arthroscopy Instruments Industry Revenue Share (%), by Country 2024 & 2032
- Figure 82: GCC Arthroscopy Instruments Industry Volume Share (%), by Country 2024 & 2032
- Figure 83: South America Arthroscopy Instruments Industry Revenue (Million), by Application 2024 & 2032
- Figure 84: South America Arthroscopy Instruments Industry Volume (K Unit), by Application 2024 & 2032
- Figure 85: South America Arthroscopy Instruments Industry Revenue Share (%), by Application 2024 & 2032
- Figure 86: South America Arthroscopy Instruments Industry Volume Share (%), by Application 2024 & 2032
- Figure 87: South America Arthroscopy Instruments Industry Revenue (Million), by Product 2024 & 2032
- Figure 88: South America Arthroscopy Instruments Industry Volume (K Unit), by Product 2024 & 2032
- Figure 89: South America Arthroscopy Instruments Industry Revenue Share (%), by Product 2024 & 2032
- Figure 90: South America Arthroscopy Instruments Industry Volume Share (%), by Product 2024 & 2032
- Figure 91: South America Arthroscopy Instruments Industry Revenue (Million), by Country 2024 & 2032
- Figure 92: South America Arthroscopy Instruments Industry Volume (K Unit), by Country 2024 & 2032
- Figure 93: South America Arthroscopy Instruments Industry Revenue Share (%), by Country 2024 & 2032
- Figure 94: South America Arthroscopy Instruments Industry Volume Share (%), by Country 2024 & 2032
List of Tables
- Table 1: Global Arthroscopy Instruments Industry Revenue Million Forecast, by Region 2019 & 2032
- Table 2: Global Arthroscopy Instruments Industry Volume K Unit Forecast, by Region 2019 & 2032
- Table 3: Global Arthroscopy Instruments Industry Revenue Million Forecast, by Application 2019 & 2032
- Table 4: Global Arthroscopy Instruments Industry Volume K Unit Forecast, by Application 2019 & 2032
- Table 5: Global Arthroscopy Instruments Industry Revenue Million Forecast, by Product 2019 & 2032
- Table 6: Global Arthroscopy Instruments Industry Volume K Unit Forecast, by Product 2019 & 2032
- Table 7: Global Arthroscopy Instruments Industry Revenue Million Forecast, by Region 2019 & 2032
- Table 8: Global Arthroscopy Instruments Industry Volume K Unit Forecast, by Region 2019 & 2032
- Table 9: Global Arthroscopy Instruments Industry Revenue Million Forecast, by Country 2019 & 2032
- Table 10: Global Arthroscopy Instruments Industry Volume K Unit Forecast, by Country 2019 & 2032
- Table 11: Global Arthroscopy Instruments Industry Revenue Million Forecast, by Country 2019 & 2032
- Table 12: Global Arthroscopy Instruments Industry Volume K Unit Forecast, by Country 2019 & 2032
- Table 13: Global Arthroscopy Instruments Industry Revenue Million Forecast, by Country 2019 & 2032
- Table 14: Global Arthroscopy Instruments Industry Volume K Unit Forecast, by Country 2019 & 2032
- Table 15: Global Arthroscopy Instruments Industry Revenue Million Forecast, by Country 2019 & 2032
- Table 16: Global Arthroscopy Instruments Industry Volume K Unit Forecast, by Country 2019 & 2032
- Table 17: Global Arthroscopy Instruments Industry Revenue Million Forecast, by Country 2019 & 2032
- Table 18: Global Arthroscopy Instruments Industry Volume K Unit Forecast, by Country 2019 & 2032
- Table 19: Global Arthroscopy Instruments Industry Revenue Million Forecast, by Application 2019 & 2032
- Table 20: Global Arthroscopy Instruments Industry Volume K Unit Forecast, by Application 2019 & 2032
- Table 21: Global Arthroscopy Instruments Industry Revenue Million Forecast, by Product 2019 & 2032
- Table 22: Global Arthroscopy Instruments Industry Volume K Unit Forecast, by Product 2019 & 2032
- Table 23: Global Arthroscopy Instruments Industry Revenue Million Forecast, by Country 2019 & 2032
- Table 24: Global Arthroscopy Instruments Industry Volume K Unit Forecast, by Country 2019 & 2032
- Table 25: United States Arthroscopy Instruments Industry Revenue (Million) Forecast, by Application 2019 & 2032
- Table 26: United States Arthroscopy Instruments Industry Volume (K Unit) Forecast, by Application 2019 & 2032
- Table 27: Canada Arthroscopy Instruments Industry Revenue (Million) Forecast, by Application 2019 & 2032
- Table 28: Canada Arthroscopy Instruments Industry Volume (K Unit) Forecast, by Application 2019 & 2032
- Table 29: Mexico Arthroscopy Instruments Industry Revenue (Million) Forecast, by Application 2019 & 2032
- Table 30: Mexico Arthroscopy Instruments Industry Volume (K Unit) Forecast, by Application 2019 & 2032
- Table 31: Global Arthroscopy Instruments Industry Revenue Million Forecast, by Application 2019 & 2032
- Table 32: Global Arthroscopy Instruments Industry Volume K Unit Forecast, by Application 2019 & 2032
- Table 33: Global Arthroscopy Instruments Industry Revenue Million Forecast, by Product 2019 & 2032
- Table 34: Global Arthroscopy Instruments Industry Volume K Unit Forecast, by Product 2019 & 2032
- Table 35: Global Arthroscopy Instruments Industry Revenue Million Forecast, by Country 2019 & 2032
- Table 36: Global Arthroscopy Instruments Industry Volume K Unit Forecast, by Country 2019 & 2032
- Table 37: Germany Arthroscopy Instruments Industry Revenue (Million) Forecast, by Application 2019 & 2032
- Table 38: Germany Arthroscopy Instruments Industry Volume (K Unit) Forecast, by Application 2019 & 2032
- Table 39: United Kingdom Arthroscopy Instruments Industry Revenue (Million) Forecast, by Application 2019 & 2032
- Table 40: United Kingdom Arthroscopy Instruments Industry Volume (K Unit) Forecast, by Application 2019 & 2032
- Table 41: France Arthroscopy Instruments Industry Revenue (Million) Forecast, by Application 2019 & 2032
- Table 42: France Arthroscopy Instruments Industry Volume (K Unit) Forecast, by Application 2019 & 2032
- Table 43: Italy Arthroscopy Instruments Industry Revenue (Million) Forecast, by Application 2019 & 2032
- Table 44: Italy Arthroscopy Instruments Industry Volume (K Unit) Forecast, by Application 2019 & 2032
- Table 45: Spain Arthroscopy Instruments Industry Revenue (Million) Forecast, by Application 2019 & 2032
- Table 46: Spain Arthroscopy Instruments Industry Volume (K Unit) Forecast, by Application 2019 & 2032
- Table 47: Rest of Europe Arthroscopy Instruments Industry Revenue (Million) Forecast, by Application 2019 & 2032
- Table 48: Rest of Europe Arthroscopy Instruments Industry Volume (K Unit) Forecast, by Application 2019 & 2032
- Table 49: Global Arthroscopy Instruments Industry Revenue Million Forecast, by Application 2019 & 2032
- Table 50: Global Arthroscopy Instruments Industry Volume K Unit Forecast, by Application 2019 & 2032
- Table 51: Global Arthroscopy Instruments Industry Revenue Million Forecast, by Product 2019 & 2032
- Table 52: Global Arthroscopy Instruments Industry Volume K Unit Forecast, by Product 2019 & 2032
- Table 53: Global Arthroscopy Instruments Industry Revenue Million Forecast, by Country 2019 & 2032
- Table 54: Global Arthroscopy Instruments Industry Volume K Unit Forecast, by Country 2019 & 2032
- Table 55: China Arthroscopy Instruments Industry Revenue (Million) Forecast, by Application 2019 & 2032
- Table 56: China Arthroscopy Instruments Industry Volume (K Unit) Forecast, by Application 2019 & 2032
- Table 57: Japan Arthroscopy Instruments Industry Revenue (Million) Forecast, by Application 2019 & 2032
- Table 58: Japan Arthroscopy Instruments Industry Volume (K Unit) Forecast, by Application 2019 & 2032
- Table 59: India Arthroscopy Instruments Industry Revenue (Million) Forecast, by Application 2019 & 2032
- Table 60: India Arthroscopy Instruments Industry Volume (K Unit) Forecast, by Application 2019 & 2032
- Table 61: Australia Arthroscopy Instruments Industry Revenue (Million) Forecast, by Application 2019 & 2032
- Table 62: Australia Arthroscopy Instruments Industry Volume (K Unit) Forecast, by Application 2019 & 2032
- Table 63: South korea Arthroscopy Instruments Industry Revenue (Million) Forecast, by Application 2019 & 2032
- Table 64: South korea Arthroscopy Instruments Industry Volume (K Unit) Forecast, by Application 2019 & 2032
- Table 65: Rest of Asia Pacific Arthroscopy Instruments Industry Revenue (Million) Forecast, by Application 2019 & 2032
- Table 66: Rest of Asia Pacific Arthroscopy Instruments Industry Volume (K Unit) Forecast, by Application 2019 & 2032
- Table 67: Global Arthroscopy Instruments Industry Revenue Million Forecast, by Application 2019 & 2032
- Table 68: Global Arthroscopy Instruments Industry Volume K Unit Forecast, by Application 2019 & 2032
- Table 69: Global Arthroscopy Instruments Industry Revenue Million Forecast, by Product 2019 & 2032
- Table 70: Global Arthroscopy Instruments Industry Volume K Unit Forecast, by Product 2019 & 2032
- Table 71: Global Arthroscopy Instruments Industry Revenue Million Forecast, by Country 2019 & 2032
- Table 72: Global Arthroscopy Instruments Industry Volume K Unit Forecast, by Country 2019 & 2032
- Table 73: Global Arthroscopy Instruments Industry Revenue Million Forecast, by Application 2019 & 2032
- Table 74: Global Arthroscopy Instruments Industry Volume K Unit Forecast, by Application 2019 & 2032
- Table 75: Global Arthroscopy Instruments Industry Revenue Million Forecast, by Product 2019 & 2032
- Table 76: Global Arthroscopy Instruments Industry Volume K Unit Forecast, by Product 2019 & 2032
- Table 77: Global Arthroscopy Instruments Industry Revenue Million Forecast, by Country 2019 & 2032
- Table 78: Global Arthroscopy Instruments Industry Volume K Unit Forecast, by Country 2019 & 2032
- Table 79: South Africa Arthroscopy Instruments Industry Revenue (Million) Forecast, by Application 2019 & 2032
- Table 80: South Africa Arthroscopy Instruments Industry Volume (K Unit) Forecast, by Application 2019 & 2032
- Table 81: Rest of Middle East Arthroscopy Instruments Industry Revenue (Million) Forecast, by Application 2019 & 2032
- Table 82: Rest of Middle East Arthroscopy Instruments Industry Volume (K Unit) Forecast, by Application 2019 & 2032
- Table 83: Global Arthroscopy Instruments Industry Revenue Million Forecast, by Application 2019 & 2032
- Table 84: Global Arthroscopy Instruments Industry Volume K Unit Forecast, by Application 2019 & 2032
- Table 85: Global Arthroscopy Instruments Industry Revenue Million Forecast, by Product 2019 & 2032
- Table 86: Global Arthroscopy Instruments Industry Volume K Unit Forecast, by Product 2019 & 2032
- Table 87: Global Arthroscopy Instruments Industry Revenue Million Forecast, by Country 2019 & 2032
- Table 88: Global Arthroscopy Instruments Industry Volume K Unit Forecast, by Country 2019 & 2032
- Table 89: Brazil Arthroscopy Instruments Industry Revenue (Million) Forecast, by Application 2019 & 2032
- Table 90: Brazil Arthroscopy Instruments Industry Volume (K Unit) Forecast, by Application 2019 & 2032
- Table 91: Argentina Arthroscopy Instruments Industry Revenue (Million) Forecast, by Application 2019 & 2032
- Table 92: Argentina Arthroscopy Instruments Industry Volume (K Unit) Forecast, by Application 2019 & 2032
- Table 93: Rest of South America Arthroscopy Instruments Industry Revenue (Million) Forecast, by Application 2019 & 2032
- Table 94: Rest of South America Arthroscopy Instruments Industry Volume (K Unit) Forecast, by Application 2019 & 2032
Frequently Asked Questions
1. What is the projected Compound Annual Growth Rate (CAGR) of the Arthroscopy Instruments Industry?
The projected CAGR is approximately 5.69%.
2. Which companies are prominent players in the Arthroscopy Instruments Industry?
Key companies in the market include Smith & Nephew PLC, Arthrex Inc, Medtronic PLC, Richard Wolf GmbH, Stryker Corporation, Karl Storz GmbH & Co KG, Conmed Corporation, Johnson & Johnson.
3. What are the main segments of the Arthroscopy Instruments Industry?
The market segments include Application, Product.
4. Can you provide details about the market size?
The market size is estimated to be USD 1.65 Million as of 2022.
5. What are some drivers contributing to market growth?
Increasing Incidences of Sports Injuries; Rising Geriatric Population; Technological Advancements in Arthroscopic Implants.
6. What are the notable trends driving market growth?
Knee Arthroscopy Segment is Expected to Witness Growth Over the Forecast Period.
7. Are there any restraints impacting market growth?
Lack of Skilled Surgeons; Stringent Regulatory Requirements; High Cost of Arthroscopy Devices.
8. Can you provide examples of recent developments in the market?
In February 2022, Formus Labs raised USD 5 million and struck a partnership with Zimmer Biomet for the co-development and global distribution of its technology.
9. What pricing options are available for accessing the report?
Pricing options include single-user, multi-user, and enterprise licenses priced at USD 4750, USD 5250, and USD 8750 respectively.
10. Is the market size provided in terms of value or volume?
The market size is provided in terms of value, measured in Million and volume, measured in K Unit.
11. Are there any specific market keywords associated with the report?
Yes, the market keyword associated with the report is "Arthroscopy Instruments Industry," which aids in identifying and referencing the specific market segment covered.
12. How do I determine which pricing option suits my needs best?
The pricing options vary based on user requirements and access needs. Individual users may opt for single-user licenses, while businesses requiring broader access may choose multi-user or enterprise licenses for cost-effective access to the report.
13. Are there any additional resources or data provided in the Arthroscopy Instruments Industry report?
While the report offers comprehensive insights, it's advisable to review the specific contents or supplementary materials provided to ascertain if additional resources or data are available.
14. How can I stay updated on further developments or reports in the Arthroscopy Instruments Industry?
To stay informed about further developments, trends, and reports in the Arthroscopy Instruments Industry, consider subscribing to industry newsletters, following relevant companies and organizations, or regularly checking reputable industry news sources and publications.
Methodology
Step 1 - Identification of Relevant Samples Size from Population Database


Step 2 - Approaches for Defining Global Market Size (Value, Volume* & Price*)

Note*: In applicable scenarios
Step 3 - Data Sources
Primary Research
- Web Analytics
- Survey Reports
- Research Institute
- Latest Research Reports
- Opinion Leaders
Secondary Research
- Annual Reports
- White Paper
- Latest Press Release
- Industry Association
- Paid Database
- Investor Presentations

Step 4 - Data Triangulation
Involves using different sources of information in order to increase the validity of a study
These sources are likely to be stakeholders in a program - participants, other researchers, program staff, other community members, and so on.
Then we put all data in single framework & apply various statistical tools to find out the dynamic on the market.
During the analysis stage, feedback from the stakeholder groups would be compared to determine areas of agreement as well as areas of divergence


