
Key Insights
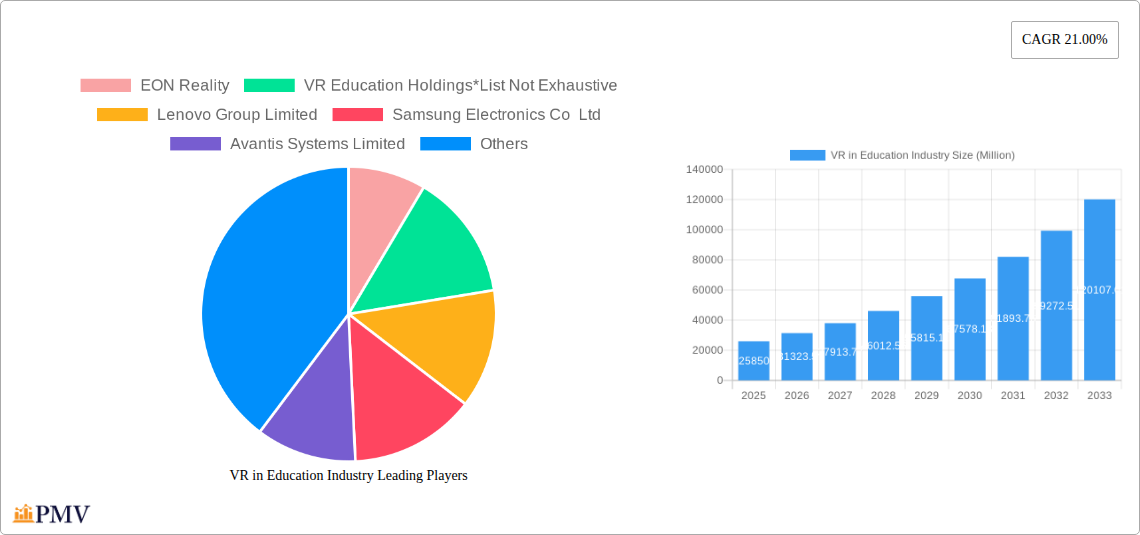
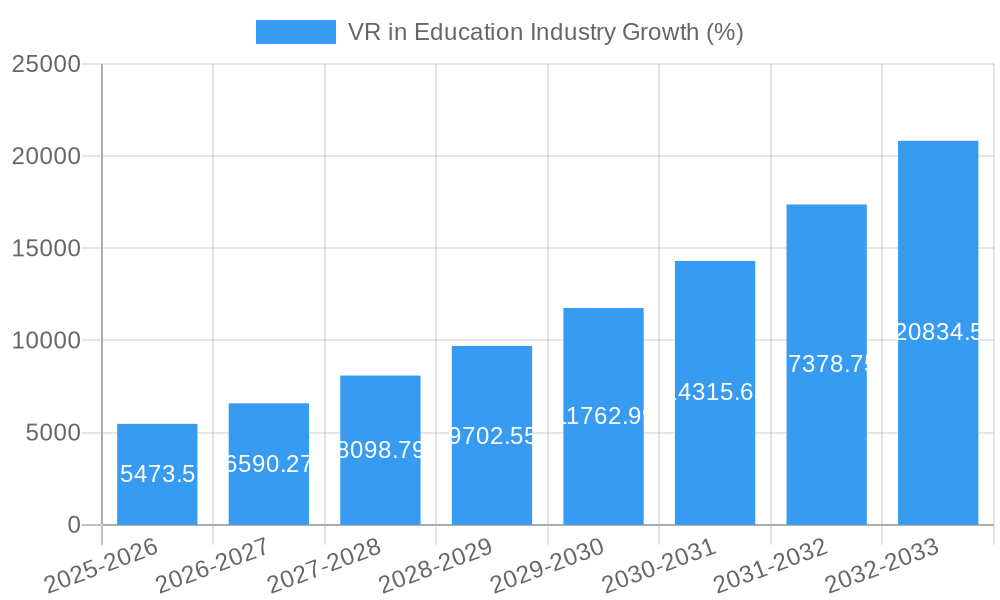
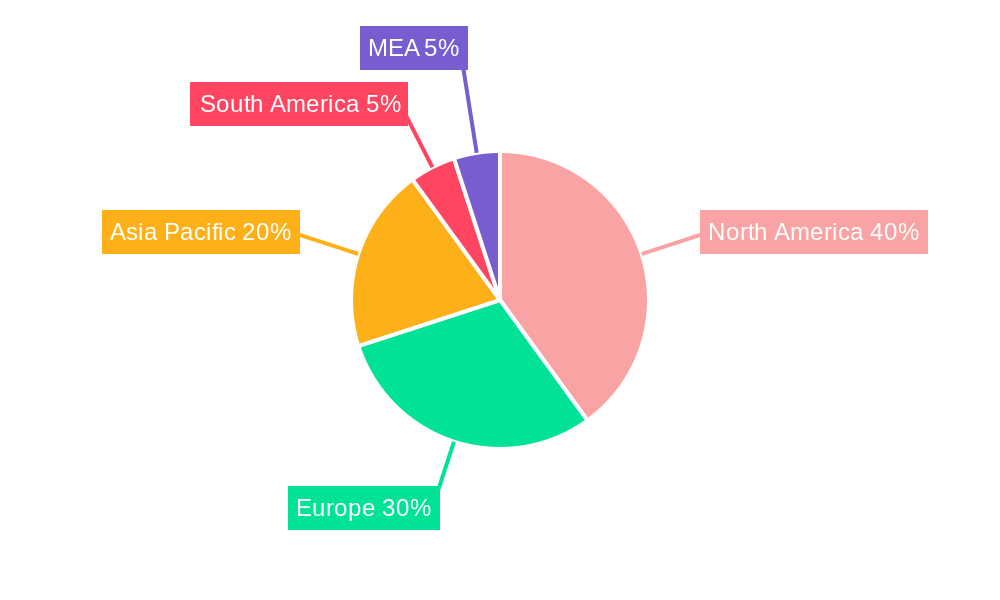
The VR in Education market is experiencing significant growth, projected at a Compound Annual Growth Rate (CAGR) of 21% from 2025 to 2033, expanding from a market size of $25.85 billion in 2025. Several factors contribute to this expansion. The increasing adoption of immersive technologies in educational settings stems from a growing understanding of VR's effectiveness in enhancing engagement, knowledge retention, and practical skills development across various disciplines. Hardware advancements, offering more affordable and user-friendly VR headsets and supporting software, are lowering the barrier to entry for educational institutions. Furthermore, the rise of cloud-based VR platforms simplifies deployment and management, making the technology more accessible to schools with limited IT resources. The market is segmented by type (hardware, software, and services including training, consulting, and managed services) and end-user (academic institutions, higher education, and corporate training). The strong growth in the services segment is driven by the need for specialized support and training to effectively integrate VR into the curriculum. Geographic distribution reveals a strong presence across North America, Europe, and Asia Pacific, with each region exhibiting unique growth trajectories influenced by factors such as technological adoption rates, government initiatives, and the presence of key players. The strong presence of established tech companies like Microsoft and Meta, alongside specialized educational VR providers, points to a robust and competitive market landscape.
The continued growth trajectory is expected to be influenced by ongoing technological advancements, such as the development of more sophisticated haptic feedback systems and improved content creation tools. Increased investment in educational VR research and development is also expected to drive innovation and expand the application of VR across various subjects and learning styles. While challenges such as the initial investment costs for hardware and software, along with the need for teacher training and curriculum integration, might pose restraints, the overall market sentiment indicates a strong positive outlook for VR in education in the coming years. The market is poised for significant expansion as more educational institutions recognize the transformative potential of VR technology to improve student learning outcomes.
VR in Education Industry: A Comprehensive Market Report (2019-2033)
This in-depth report provides a comprehensive analysis of the Virtual Reality (VR) in Education market, projecting a market value exceeding $XX Million by 2033. The study covers the period 2019-2033, with a base year of 2025 and a forecast period of 2025-2033. This report is crucial for investors, educators, technology providers, and anyone seeking to understand the transformative potential of VR in education. We delve into market structure, competitive dynamics, key trends, dominant segments, and leading players, offering actionable insights for strategic decision-making.
VR in Education Industry Market Structure & Competitive Dynamics
The VR in Education market exhibits a moderately fragmented structure, with several major players and numerous smaller niche competitors. Market concentration is relatively low, allowing for innovation and disruption. Key players like EON Reality, VR Education Holdings, Lenovo Group Limited, Samsung Electronics Co Ltd, and Meta Platforms Inc. hold significant market share, but the landscape is dynamic due to continuous technological advancements and entry of new players. Innovation ecosystems are flourishing, with partnerships between educational institutions, technology companies, and content creators driving growth. Regulatory frameworks are still evolving, with varying levels of adoption and support across different regions. Product substitutes, such as traditional teaching methods and augmented reality (AR) solutions, exist but VR's immersive nature offers unique advantages. End-user trends indicate a growing preference for interactive and engaging learning experiences, fueling VR adoption. M&A activity is prevalent, with deals involving both large established companies and startups. Recent M&A deal values have ranged from $XX Million to $XX Million, reflecting substantial investments in the sector.
VR in Education Industry Industry Trends & Insights
The VR in Education market is experiencing significant growth, driven by several key factors. Technological advancements, such as improved VR headsets, more intuitive software, and affordable solutions, have significantly lowered the barrier to entry for educational institutions. The global compound annual growth rate (CAGR) is projected to be XX% during the forecast period. Market penetration is increasing rapidly, particularly in higher education and corporate training segments. Consumer preferences are shifting towards personalized and immersive learning experiences, leading to a surge in demand for VR-based educational content. The competitive landscape is highly dynamic, with ongoing innovation and the emergence of new players. However, the relatively high initial investment cost for VR equipment and the need for high-quality educational content remain key challenges. Current market size is estimated to be $XX Million in 2025.
Dominant Markets & Segments in VR in Education Industry
Leading Region/Country: North America currently holds the largest market share, driven by substantial investments in educational technology and the presence of major technology companies. However, Asia-Pacific is expected to witness significant growth in the coming years due to increasing government initiatives and rising adoption of technology in education.
Dominant Segments:
Hardware: Headsets, sensors, and other peripherals dominate this segment. Growth is fueled by technological advancements and decreasing prices.
Software: Educational applications and platforms are crucial for delivering VR-based learning experiences. This segment is characterized by high competition and a focus on content quality and user experience.
Services: Training and consulting services play a vital role in assisting institutions in implementing VR solutions. Managed services further support the seamless operation and maintenance of VR infrastructure.
End-User: Higher education institutions currently represent the largest end-user segment, followed by corporate training programs. Academic institutions at all levels are rapidly adopting VR for improved engagement and outcomes. Key drivers include increasing government funding, growing recognition of VR's educational benefits, and the availability of affordable solutions.
VR in Education Industry Product Innovations
Recent product innovations include more affordable and user-friendly VR headsets, the development of immersive and interactive educational content, and the integration of VR with other educational technologies. This has broadened the accessibility of VR in education, making it suitable for a wider range of institutions and learners. The focus is on creating engaging and effective learning experiences that cater to diverse learning styles and needs. These innovations are driving wider adoption and market growth.
Report Segmentation & Scope
This report segments the VR in Education market based on type (Hardware, Software, Services), and end-user (Academic Institutions, Higher Education, Corporate Training). Each segment is analyzed in detail, providing insights into market size, growth projections, and competitive dynamics. For example, the Software segment is expected to experience significant growth due to the increasing demand for high-quality educational content. Similarly, the Higher Education end-user segment is projected to dominate the market due to increased investments in technology and the growing emphasis on interactive learning.
Key Drivers of VR in Education Industry Growth
Technological advancements, increasing government funding for educational technology, and the growing recognition of VR's effectiveness in enhancing learning outcomes are key growth drivers. The rising demand for personalized learning experiences and the ability of VR to create immersive and engaging environments further contribute to market expansion. Furthermore, supportive regulatory frameworks in certain regions are facilitating wider adoption.
Challenges in the VR in Education Industry Sector
High initial investment costs for VR equipment, the need for high-quality educational content, and the lack of skilled personnel to implement and maintain VR systems pose significant challenges. Concerns regarding the potential for motion sickness and other adverse effects on users, and the need for robust cybersecurity measures to protect sensitive data, further hinder widespread adoption. These factors currently restrict the market's potential.
Leading Players in the VR in Education Industry Market
- EON Reality
- VR Education Holdings
- Lenovo Group Limited
- Samsung Electronics Co Ltd
- Avantis Systems Limited
- Virtalis Holdings Limited
- Unity Teach
- Microsoft Corporation
- zSpace Inc
- Nearpod Inc
- Veative Labs
- Alchemy VR Limited
- Meta Platforms Inc
- HTC Corporation
Key Developments in VR in Education Industry Sector
- May 2022: XR Immersive Tech Inc.'s Synthesis VR Inc. partnered with VictoryXR to distribute educational VR content globally. This significantly expands the reach of VR educational materials.
- October 2022: Jolly Good Inc.'s collaboration with Juntendo University and Mahidol University introduces VR medical education in Thailand, establishing a model for self-produced VR teaching materials. This demonstrates the potential for VR to address specific educational needs in diverse contexts.
Strategic VR in Education Industry Market Outlook
The VR in Education market holds immense potential for future growth. Continued technological advancements, decreasing hardware costs, and the increasing availability of high-quality educational content will drive market expansion. Strategic partnerships between technology companies and educational institutions are crucial for fostering innovation and accelerating adoption. Focusing on addressing current challenges, such as cost and accessibility, will unlock even greater market potential in the coming years.
VR in Education Industry Segmentation
-
1. Type
- 1.1. Hardware
- 1.2. Software
- 1.3. Services
-
2. End User
-
2.1. Academic Institutions
- 2.1.1. K-12 Learning
- 2.1.2. Higher Education
-
2.2. Corporate Training
- 2.2.1. IT and Telecom
- 2.2.2. Healthcare
- 2.2.3. Retail and E-commerce
- 2.2.4. Other End users
-
2.1. Academic Institutions
VR in Education Industry Segmentation By Geography
- 1. North America
- 2. Europe
- 3. Asia Pacific
- 4. Rest of the World
VR in Education Industry REPORT HIGHLIGHTS
| Aspects | Details |
|---|---|
| Study Period | 2019-2033 |
| Base Year | 2024 |
| Estimated Year | 2025 |
| Forecast Period | 2025-2033 |
| Historical Period | 2019-2024 |
| Growth Rate | CAGR of 21.00% from 2019-2033 |
| Segmentation |
|
Table of Contents
- 1. Introduction
- 1.1. Research Scope
- 1.2. Market Segmentation
- 1.3. Research Methodology
- 1.4. Definitions and Assumptions
- 2. Executive Summary
- 2.1. Introduction
- 3. Market Dynamics
- 3.1. Introduction
- 3.2. Market Drivers
- 3.2.1. Increasing demand for interactive and personalized learning experience; Higher acceptance among stakeholders owing to higher engagement and scope for blended learning technology; VR-based technology benefits from being the first entrant in the education & corporate category; The role of education and training among corporates has transformed with the growth in digital engagement and compelling content
- 3.3. Market Restrains
- 3.3.1 Limited content and cost efficiency of consumer-grade applications; Dependence on external factors
- 3.3.2 such as bandwidth and network
- 3.3.3 for ensuring optimal experience
- 3.4. Market Trends
- 3.4.1. Increasing Demand For Interactive and Personalized Learning Experience
- 4. Market Factor Analysis
- 4.1. Porters Five Forces
- 4.2. Supply/Value Chain
- 4.3. PESTEL analysis
- 4.4. Market Entropy
- 4.5. Patent/Trademark Analysis
- 5. Global VR in Education Industry Analysis, Insights and Forecast, 2019-2031
- 5.1. Market Analysis, Insights and Forecast - by Type
- 5.1.1. Hardware
- 5.1.2. Software
- 5.1.3. Services
- 5.2. Market Analysis, Insights and Forecast - by End User
- 5.2.1. Academic Institutions
- 5.2.1.1. K-12 Learning
- 5.2.1.2. Higher Education
- 5.2.2. Corporate Training
- 5.2.2.1. IT and Telecom
- 5.2.2.2. Healthcare
- 5.2.2.3. Retail and E-commerce
- 5.2.2.4. Other End users
- 5.2.1. Academic Institutions
- 5.3. Market Analysis, Insights and Forecast - by Region
- 5.3.1. North America
- 5.3.2. Europe
- 5.3.3. Asia Pacific
- 5.3.4. Rest of the World
- 5.1. Market Analysis, Insights and Forecast - by Type
- 6. North America VR in Education Industry Analysis, Insights and Forecast, 2019-2031
- 6.1. Market Analysis, Insights and Forecast - by Type
- 6.1.1. Hardware
- 6.1.2. Software
- 6.1.3. Services
- 6.2. Market Analysis, Insights and Forecast - by End User
- 6.2.1. Academic Institutions
- 6.2.1.1. K-12 Learning
- 6.2.1.2. Higher Education
- 6.2.2. Corporate Training
- 6.2.2.1. IT and Telecom
- 6.2.2.2. Healthcare
- 6.2.2.3. Retail and E-commerce
- 6.2.2.4. Other End users
- 6.2.1. Academic Institutions
- 6.1. Market Analysis, Insights and Forecast - by Type
- 7. Europe VR in Education Industry Analysis, Insights and Forecast, 2019-2031
- 7.1. Market Analysis, Insights and Forecast - by Type
- 7.1.1. Hardware
- 7.1.2. Software
- 7.1.3. Services
- 7.2. Market Analysis, Insights and Forecast - by End User
- 7.2.1. Academic Institutions
- 7.2.1.1. K-12 Learning
- 7.2.1.2. Higher Education
- 7.2.2. Corporate Training
- 7.2.2.1. IT and Telecom
- 7.2.2.2. Healthcare
- 7.2.2.3. Retail and E-commerce
- 7.2.2.4. Other End users
- 7.2.1. Academic Institutions
- 7.1. Market Analysis, Insights and Forecast - by Type
- 8. Asia Pacific VR in Education Industry Analysis, Insights and Forecast, 2019-2031
- 8.1. Market Analysis, Insights and Forecast - by Type
- 8.1.1. Hardware
- 8.1.2. Software
- 8.1.3. Services
- 8.2. Market Analysis, Insights and Forecast - by End User
- 8.2.1. Academic Institutions
- 8.2.1.1. K-12 Learning
- 8.2.1.2. Higher Education
- 8.2.2. Corporate Training
- 8.2.2.1. IT and Telecom
- 8.2.2.2. Healthcare
- 8.2.2.3. Retail and E-commerce
- 8.2.2.4. Other End users
- 8.2.1. Academic Institutions
- 8.1. Market Analysis, Insights and Forecast - by Type
- 9. Rest of the World VR in Education Industry Analysis, Insights and Forecast, 2019-2031
- 9.1. Market Analysis, Insights and Forecast - by Type
- 9.1.1. Hardware
- 9.1.2. Software
- 9.1.3. Services
- 9.2. Market Analysis, Insights and Forecast - by End User
- 9.2.1. Academic Institutions
- 9.2.1.1. K-12 Learning
- 9.2.1.2. Higher Education
- 9.2.2. Corporate Training
- 9.2.2.1. IT and Telecom
- 9.2.2.2. Healthcare
- 9.2.2.3. Retail and E-commerce
- 9.2.2.4. Other End users
- 9.2.1. Academic Institutions
- 9.1. Market Analysis, Insights and Forecast - by Type
- 10. North America VR in Education Industry Analysis, Insights and Forecast, 2019-2031
- 10.1. Market Analysis, Insights and Forecast - By Country/Sub-region
- 10.1.1 United States
- 10.1.2 Canada
- 10.1.3 Mexico
- 11. Europe VR in Education Industry Analysis, Insights and Forecast, 2019-2031
- 11.1. Market Analysis, Insights and Forecast - By Country/Sub-region
- 11.1.1 Germany
- 11.1.2 United Kingdom
- 11.1.3 France
- 11.1.4 Spain
- 11.1.5 Italy
- 11.1.6 Spain
- 11.1.7 Belgium
- 11.1.8 Netherland
- 11.1.9 Nordics
- 11.1.10 Rest of Europe
- 12. Asia Pacific VR in Education Industry Analysis, Insights and Forecast, 2019-2031
- 12.1. Market Analysis, Insights and Forecast - By Country/Sub-region
- 12.1.1 China
- 12.1.2 Japan
- 12.1.3 India
- 12.1.4 South Korea
- 12.1.5 Southeast Asia
- 12.1.6 Australia
- 12.1.7 Indonesia
- 12.1.8 Phillipes
- 12.1.9 Singapore
- 12.1.10 Thailandc
- 12.1.11 Rest of Asia Pacific
- 13. South America VR in Education Industry Analysis, Insights and Forecast, 2019-2031
- 13.1. Market Analysis, Insights and Forecast - By Country/Sub-region
- 13.1.1 Brazil
- 13.1.2 Argentina
- 13.1.3 Peru
- 13.1.4 Chile
- 13.1.5 Colombia
- 13.1.6 Ecuador
- 13.1.7 Venezuela
- 13.1.8 Rest of South America
- 14. North America VR in Education Industry Analysis, Insights and Forecast, 2019-2031
- 14.1. Market Analysis, Insights and Forecast - By Country/Sub-region
- 14.1.1 United States
- 14.1.2 Canada
- 14.1.3 Mexico
- 15. MEA VR in Education Industry Analysis, Insights and Forecast, 2019-2031
- 15.1. Market Analysis, Insights and Forecast - By Country/Sub-region
- 15.1.1 United Arab Emirates
- 15.1.2 Saudi Arabia
- 15.1.3 South Africa
- 15.1.4 Rest of Middle East and Africa
- 16. Competitive Analysis
- 16.1. Global Market Share Analysis 2024
- 16.2. Company Profiles
- 16.2.1 EON Reality
- 16.2.1.1. Overview
- 16.2.1.2. Products
- 16.2.1.3. SWOT Analysis
- 16.2.1.4. Recent Developments
- 16.2.1.5. Financials (Based on Availability)
- 16.2.2 VR Education Holdings*List Not Exhaustive
- 16.2.2.1. Overview
- 16.2.2.2. Products
- 16.2.2.3. SWOT Analysis
- 16.2.2.4. Recent Developments
- 16.2.2.5. Financials (Based on Availability)
- 16.2.3 Lenovo Group Limited
- 16.2.3.1. Overview
- 16.2.3.2. Products
- 16.2.3.3. SWOT Analysis
- 16.2.3.4. Recent Developments
- 16.2.3.5. Financials (Based on Availability)
- 16.2.4 Samsung Electronics Co Ltd
- 16.2.4.1. Overview
- 16.2.4.2. Products
- 16.2.4.3. SWOT Analysis
- 16.2.4.4. Recent Developments
- 16.2.4.5. Financials (Based on Availability)
- 16.2.5 Avantis Systems Limited
- 16.2.5.1. Overview
- 16.2.5.2. Products
- 16.2.5.3. SWOT Analysis
- 16.2.5.4. Recent Developments
- 16.2.5.5. Financials (Based on Availability)
- 16.2.6 Virtalis Holdings Limited
- 16.2.6.1. Overview
- 16.2.6.2. Products
- 16.2.6.3. SWOT Analysis
- 16.2.6.4. Recent Developments
- 16.2.6.5. Financials (Based on Availability)
- 16.2.7 Unity Teach
- 16.2.7.1. Overview
- 16.2.7.2. Products
- 16.2.7.3. SWOT Analysis
- 16.2.7.4. Recent Developments
- 16.2.7.5. Financials (Based on Availability)
- 16.2.8 Microsoft Corporation
- 16.2.8.1. Overview
- 16.2.8.2. Products
- 16.2.8.3. SWOT Analysis
- 16.2.8.4. Recent Developments
- 16.2.8.5. Financials (Based on Availability)
- 16.2.9 zSpace Inc
- 16.2.9.1. Overview
- 16.2.9.2. Products
- 16.2.9.3. SWOT Analysis
- 16.2.9.4. Recent Developments
- 16.2.9.5. Financials (Based on Availability)
- 16.2.10 Nearpod Inc
- 16.2.10.1. Overview
- 16.2.10.2. Products
- 16.2.10.3. SWOT Analysis
- 16.2.10.4. Recent Developments
- 16.2.10.5. Financials (Based on Availability)
- 16.2.11 Veative Labs
- 16.2.11.1. Overview
- 16.2.11.2. Products
- 16.2.11.3. SWOT Analysis
- 16.2.11.4. Recent Developments
- 16.2.11.5. Financials (Based on Availability)
- 16.2.12 Alchemy VR Limited
- 16.2.12.1. Overview
- 16.2.12.2. Products
- 16.2.12.3. SWOT Analysis
- 16.2.12.4. Recent Developments
- 16.2.12.5. Financials (Based on Availability)
- 16.2.13 Meta Platforms Inc
- 16.2.13.1. Overview
- 16.2.13.2. Products
- 16.2.13.3. SWOT Analysis
- 16.2.13.4. Recent Developments
- 16.2.13.5. Financials (Based on Availability)
- 16.2.14 HTC Corporation
- 16.2.14.1. Overview
- 16.2.14.2. Products
- 16.2.14.3. SWOT Analysis
- 16.2.14.4. Recent Developments
- 16.2.14.5. Financials (Based on Availability)
- 16.2.1 EON Reality
List of Figures
- Figure 1: Global VR in Education Industry Revenue Breakdown (Million, %) by Region 2024 & 2032
- Figure 2: North America VR in Education Industry Revenue (Million), by Country 2024 & 2032
- Figure 3: North America VR in Education Industry Revenue Share (%), by Country 2024 & 2032
- Figure 4: Europe VR in Education Industry Revenue (Million), by Country 2024 & 2032
- Figure 5: Europe VR in Education Industry Revenue Share (%), by Country 2024 & 2032
- Figure 6: Asia Pacific VR in Education Industry Revenue (Million), by Country 2024 & 2032
- Figure 7: Asia Pacific VR in Education Industry Revenue Share (%), by Country 2024 & 2032
- Figure 8: South America VR in Education Industry Revenue (Million), by Country 2024 & 2032
- Figure 9: South America VR in Education Industry Revenue Share (%), by Country 2024 & 2032
- Figure 10: North America VR in Education Industry Revenue (Million), by Country 2024 & 2032
- Figure 11: North America VR in Education Industry Revenue Share (%), by Country 2024 & 2032
- Figure 12: MEA VR in Education Industry Revenue (Million), by Country 2024 & 2032
- Figure 13: MEA VR in Education Industry Revenue Share (%), by Country 2024 & 2032
- Figure 14: North America VR in Education Industry Revenue (Million), by Type 2024 & 2032
- Figure 15: North America VR in Education Industry Revenue Share (%), by Type 2024 & 2032
- Figure 16: North America VR in Education Industry Revenue (Million), by End User 2024 & 2032
- Figure 17: North America VR in Education Industry Revenue Share (%), by End User 2024 & 2032
- Figure 18: North America VR in Education Industry Revenue (Million), by Country 2024 & 2032
- Figure 19: North America VR in Education Industry Revenue Share (%), by Country 2024 & 2032
- Figure 20: Europe VR in Education Industry Revenue (Million), by Type 2024 & 2032
- Figure 21: Europe VR in Education Industry Revenue Share (%), by Type 2024 & 2032
- Figure 22: Europe VR in Education Industry Revenue (Million), by End User 2024 & 2032
- Figure 23: Europe VR in Education Industry Revenue Share (%), by End User 2024 & 2032
- Figure 24: Europe VR in Education Industry Revenue (Million), by Country 2024 & 2032
- Figure 25: Europe VR in Education Industry Revenue Share (%), by Country 2024 & 2032
- Figure 26: Asia Pacific VR in Education Industry Revenue (Million), by Type 2024 & 2032
- Figure 27: Asia Pacific VR in Education Industry Revenue Share (%), by Type 2024 & 2032
- Figure 28: Asia Pacific VR in Education Industry Revenue (Million), by End User 2024 & 2032
- Figure 29: Asia Pacific VR in Education Industry Revenue Share (%), by End User 2024 & 2032
- Figure 30: Asia Pacific VR in Education Industry Revenue (Million), by Country 2024 & 2032
- Figure 31: Asia Pacific VR in Education Industry Revenue Share (%), by Country 2024 & 2032
- Figure 32: Rest of the World VR in Education Industry Revenue (Million), by Type 2024 & 2032
- Figure 33: Rest of the World VR in Education Industry Revenue Share (%), by Type 2024 & 2032
- Figure 34: Rest of the World VR in Education Industry Revenue (Million), by End User 2024 & 2032
- Figure 35: Rest of the World VR in Education Industry Revenue Share (%), by End User 2024 & 2032
- Figure 36: Rest of the World VR in Education Industry Revenue (Million), by Country 2024 & 2032
- Figure 37: Rest of the World VR in Education Industry Revenue Share (%), by Country 2024 & 2032
List of Tables
- Table 1: Global VR in Education Industry Revenue Million Forecast, by Region 2019 & 2032
- Table 2: Global VR in Education Industry Revenue Million Forecast, by Type 2019 & 2032
- Table 3: Global VR in Education Industry Revenue Million Forecast, by End User 2019 & 2032
- Table 4: Global VR in Education Industry Revenue Million Forecast, by Region 2019 & 2032
- Table 5: Global VR in Education Industry Revenue Million Forecast, by Country 2019 & 2032
- Table 6: United States VR in Education Industry Revenue (Million) Forecast, by Application 2019 & 2032
- Table 7: Canada VR in Education Industry Revenue (Million) Forecast, by Application 2019 & 2032
- Table 8: Mexico VR in Education Industry Revenue (Million) Forecast, by Application 2019 & 2032
- Table 9: Global VR in Education Industry Revenue Million Forecast, by Country 2019 & 2032
- Table 10: Germany VR in Education Industry Revenue (Million) Forecast, by Application 2019 & 2032
- Table 11: United Kingdom VR in Education Industry Revenue (Million) Forecast, by Application 2019 & 2032
- Table 12: France VR in Education Industry Revenue (Million) Forecast, by Application 2019 & 2032
- Table 13: Spain VR in Education Industry Revenue (Million) Forecast, by Application 2019 & 2032
- Table 14: Italy VR in Education Industry Revenue (Million) Forecast, by Application 2019 & 2032
- Table 15: Spain VR in Education Industry Revenue (Million) Forecast, by Application 2019 & 2032
- Table 16: Belgium VR in Education Industry Revenue (Million) Forecast, by Application 2019 & 2032
- Table 17: Netherland VR in Education Industry Revenue (Million) Forecast, by Application 2019 & 2032
- Table 18: Nordics VR in Education Industry Revenue (Million) Forecast, by Application 2019 & 2032
- Table 19: Rest of Europe VR in Education Industry Revenue (Million) Forecast, by Application 2019 & 2032
- Table 20: Global VR in Education Industry Revenue Million Forecast, by Country 2019 & 2032
- Table 21: China VR in Education Industry Revenue (Million) Forecast, by Application 2019 & 2032
- Table 22: Japan VR in Education Industry Revenue (Million) Forecast, by Application 2019 & 2032
- Table 23: India VR in Education Industry Revenue (Million) Forecast, by Application 2019 & 2032
- Table 24: South Korea VR in Education Industry Revenue (Million) Forecast, by Application 2019 & 2032
- Table 25: Southeast Asia VR in Education Industry Revenue (Million) Forecast, by Application 2019 & 2032
- Table 26: Australia VR in Education Industry Revenue (Million) Forecast, by Application 2019 & 2032
- Table 27: Indonesia VR in Education Industry Revenue (Million) Forecast, by Application 2019 & 2032
- Table 28: Phillipes VR in Education Industry Revenue (Million) Forecast, by Application 2019 & 2032
- Table 29: Singapore VR in Education Industry Revenue (Million) Forecast, by Application 2019 & 2032
- Table 30: Thailandc VR in Education Industry Revenue (Million) Forecast, by Application 2019 & 2032
- Table 31: Rest of Asia Pacific VR in Education Industry Revenue (Million) Forecast, by Application 2019 & 2032
- Table 32: Global VR in Education Industry Revenue Million Forecast, by Country 2019 & 2032
- Table 33: Brazil VR in Education Industry Revenue (Million) Forecast, by Application 2019 & 2032
- Table 34: Argentina VR in Education Industry Revenue (Million) Forecast, by Application 2019 & 2032
- Table 35: Peru VR in Education Industry Revenue (Million) Forecast, by Application 2019 & 2032
- Table 36: Chile VR in Education Industry Revenue (Million) Forecast, by Application 2019 & 2032
- Table 37: Colombia VR in Education Industry Revenue (Million) Forecast, by Application 2019 & 2032
- Table 38: Ecuador VR in Education Industry Revenue (Million) Forecast, by Application 2019 & 2032
- Table 39: Venezuela VR in Education Industry Revenue (Million) Forecast, by Application 2019 & 2032
- Table 40: Rest of South America VR in Education Industry Revenue (Million) Forecast, by Application 2019 & 2032
- Table 41: Global VR in Education Industry Revenue Million Forecast, by Country 2019 & 2032
- Table 42: United States VR in Education Industry Revenue (Million) Forecast, by Application 2019 & 2032
- Table 43: Canada VR in Education Industry Revenue (Million) Forecast, by Application 2019 & 2032
- Table 44: Mexico VR in Education Industry Revenue (Million) Forecast, by Application 2019 & 2032
- Table 45: Global VR in Education Industry Revenue Million Forecast, by Country 2019 & 2032
- Table 46: United Arab Emirates VR in Education Industry Revenue (Million) Forecast, by Application 2019 & 2032
- Table 47: Saudi Arabia VR in Education Industry Revenue (Million) Forecast, by Application 2019 & 2032
- Table 48: South Africa VR in Education Industry Revenue (Million) Forecast, by Application 2019 & 2032
- Table 49: Rest of Middle East and Africa VR in Education Industry Revenue (Million) Forecast, by Application 2019 & 2032
- Table 50: Global VR in Education Industry Revenue Million Forecast, by Type 2019 & 2032
- Table 51: Global VR in Education Industry Revenue Million Forecast, by End User 2019 & 2032
- Table 52: Global VR in Education Industry Revenue Million Forecast, by Country 2019 & 2032
- Table 53: Global VR in Education Industry Revenue Million Forecast, by Type 2019 & 2032
- Table 54: Global VR in Education Industry Revenue Million Forecast, by End User 2019 & 2032
- Table 55: Global VR in Education Industry Revenue Million Forecast, by Country 2019 & 2032
- Table 56: Global VR in Education Industry Revenue Million Forecast, by Type 2019 & 2032
- Table 57: Global VR in Education Industry Revenue Million Forecast, by End User 2019 & 2032
- Table 58: Global VR in Education Industry Revenue Million Forecast, by Country 2019 & 2032
- Table 59: Global VR in Education Industry Revenue Million Forecast, by Type 2019 & 2032
- Table 60: Global VR in Education Industry Revenue Million Forecast, by End User 2019 & 2032
- Table 61: Global VR in Education Industry Revenue Million Forecast, by Country 2019 & 2032
Frequently Asked Questions
1. What is the projected Compound Annual Growth Rate (CAGR) of the VR in Education Industry?
The projected CAGR is approximately 21.00%.
2. Which companies are prominent players in the VR in Education Industry?
Key companies in the market include EON Reality, VR Education Holdings*List Not Exhaustive, Lenovo Group Limited, Samsung Electronics Co Ltd, Avantis Systems Limited, Virtalis Holdings Limited, Unity Teach, Microsoft Corporation, zSpace Inc, Nearpod Inc, Veative Labs, Alchemy VR Limited, Meta Platforms Inc, HTC Corporation.
3. What are the main segments of the VR in Education Industry?
The market segments include Type, End User.
4. Can you provide details about the market size?
The market size is estimated to be USD 25.85 Million as of 2022.
5. What are some drivers contributing to market growth?
Increasing demand for interactive and personalized learning experience; Higher acceptance among stakeholders owing to higher engagement and scope for blended learning technology; VR-based technology benefits from being the first entrant in the education & corporate category; The role of education and training among corporates has transformed with the growth in digital engagement and compelling content.
6. What are the notable trends driving market growth?
Increasing Demand For Interactive and Personalized Learning Experience.
7. Are there any restraints impacting market growth?
Limited content and cost efficiency of consumer-grade applications; Dependence on external factors. such as bandwidth and network. for ensuring optimal experience.
8. Can you provide examples of recent developments in the market?
October 2022: Japanese startup Jolly Good Inc., in partnership with Juntendo University, will commence a demonstration project to introduce medical education with virtual reality (VR) and develop human medical resources through VR at Royal Mahidol University and throughout Thailand. The company will provide Mahidol University with VR teaching material production facilities and VR experience equipment to create an environment that enables the self-production of VR teaching materials for infectious disease treatment education at the university.
9. What pricing options are available for accessing the report?
Pricing options include single-user, multi-user, and enterprise licenses priced at USD 4750, USD 5250, and USD 8750 respectively.
10. Is the market size provided in terms of value or volume?
The market size is provided in terms of value, measured in Million.
11. Are there any specific market keywords associated with the report?
Yes, the market keyword associated with the report is "VR in Education Industry," which aids in identifying and referencing the specific market segment covered.
12. How do I determine which pricing option suits my needs best?
The pricing options vary based on user requirements and access needs. Individual users may opt for single-user licenses, while businesses requiring broader access may choose multi-user or enterprise licenses for cost-effective access to the report.
13. Are there any additional resources or data provided in the VR in Education Industry report?
While the report offers comprehensive insights, it's advisable to review the specific contents or supplementary materials provided to ascertain if additional resources or data are available.
14. How can I stay updated on further developments or reports in the VR in Education Industry?
To stay informed about further developments, trends, and reports in the VR in Education Industry, consider subscribing to industry newsletters, following relevant companies and organizations, or regularly checking reputable industry news sources and publications.
Methodology
Step 1 - Identification of Relevant Samples Size from Population Database


Step 2 - Approaches for Defining Global Market Size (Value, Volume* & Price*)

Note*: In applicable scenarios
Step 3 - Data Sources
Primary Research
- Web Analytics
- Survey Reports
- Research Institute
- Latest Research Reports
- Opinion Leaders
Secondary Research
- Annual Reports
- White Paper
- Latest Press Release
- Industry Association
- Paid Database
- Investor Presentations

Step 4 - Data Triangulation
Involves using different sources of information in order to increase the validity of a study
These sources are likely to be stakeholders in a program - participants, other researchers, program staff, other community members, and so on.
Then we put all data in single framework & apply various statistical tools to find out the dynamic on the market.
During the analysis stage, feedback from the stakeholder groups would be compared to determine areas of agreement as well as areas of divergence


