
Key Insights
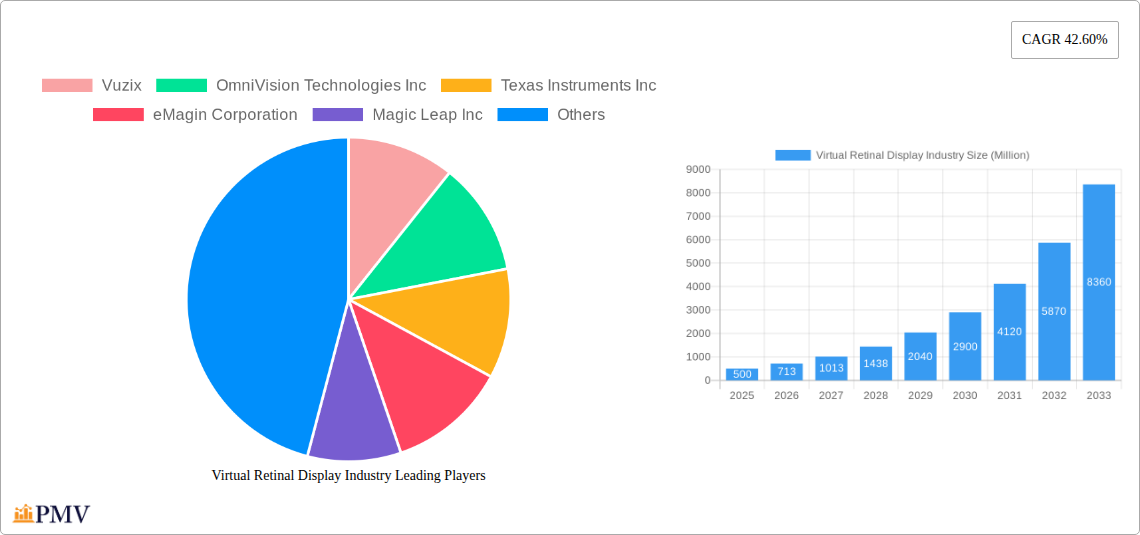
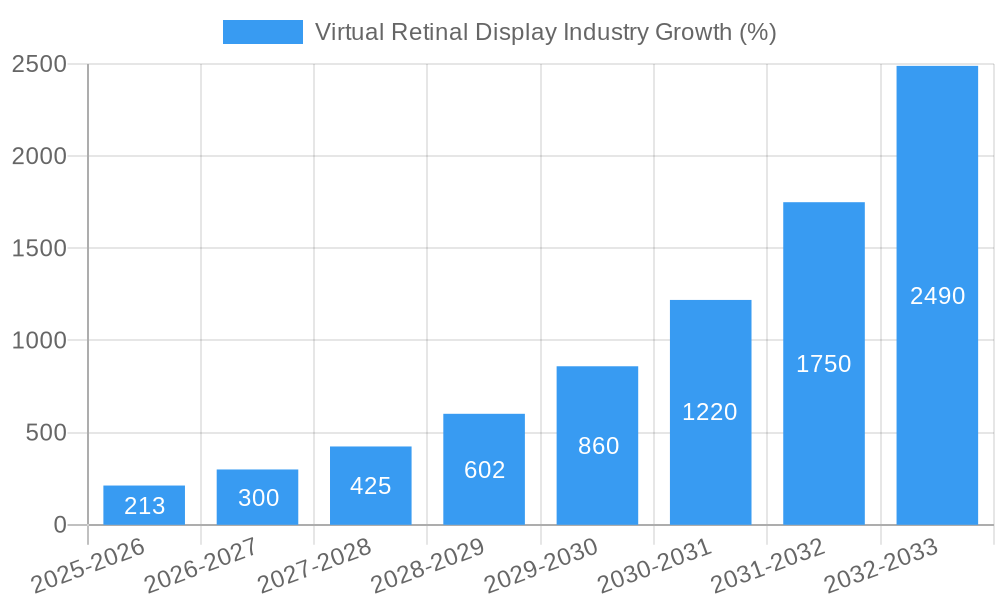
The Virtual Retinal Display (VRD) market is experiencing rapid expansion, projected to reach a substantial size and maintain a robust Compound Annual Growth Rate (CAGR) of 42.60% from 2025 to 2033. This explosive growth is fueled by several key drivers. The increasing demand for advanced display technologies across diverse sectors, including medical & life sciences (for surgical visualization and minimally invasive procedures), aerospace & defense (for heads-up displays and pilot training simulations), and media & entertainment (for immersive gaming and virtual reality experiences), is a major catalyst. Furthermore, ongoing technological advancements leading to improved image quality, resolution, and miniaturization of VRD devices are significantly contributing to market expansion. While challenges like high manufacturing costs and the need for further technological refinement exist, the overall market trajectory remains strongly positive. The competitive landscape is dynamic, with key players like Vuzix, OmniVision Technologies, and Texas Instruments actively innovating and vying for market share. Geographical expansion, particularly in rapidly developing economies of Asia-Pacific and other regions, further boosts market potential.
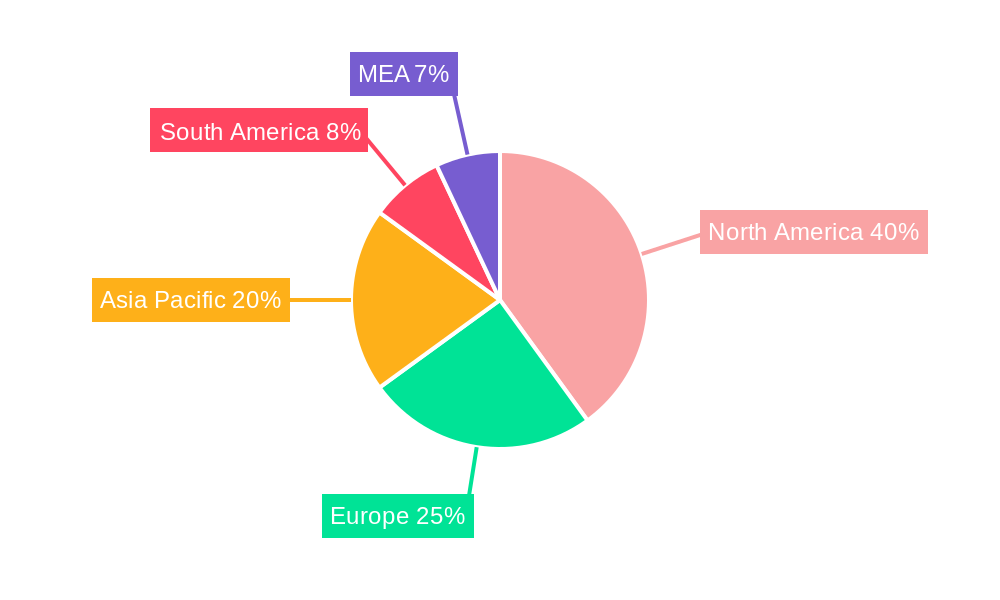
The segmentation analysis reveals the dominance of the Medical & Life Sciences sector in adopting VRD technology due to its potential to revolutionize surgical procedures and medical imaging. The Aerospace and Defense sector's integration of VRD for enhanced situational awareness and training contributes significantly to market growth. The Media and Entertainment sector's embrace of VRD for immersive and interactive experiences is another major driving force. North America currently holds a leading market share, fueled by robust technological advancements and high adoption rates. However, Asia-Pacific is expected to witness the fastest growth over the forecast period, driven by increasing investments in R&D and rising consumer demand for advanced display solutions. The market's future success hinges on sustained technological improvements, strategic collaborations between key players, and continued investment in research and development to address existing limitations and expand application possibilities.
Virtual Retinal Display Industry Market Report: 2019-2033
This comprehensive report provides an in-depth analysis of the Virtual Retinal Display industry, covering market size, segmentation, competitive landscape, and future growth prospects from 2019 to 2033. With a focus on key players like Vuzix, OmniVision Technologies Inc, and Texas Instruments Inc, this report offers actionable insights for businesses and investors seeking to navigate this dynamic market. The study period covers 2019-2033, with 2025 as the base and estimated year. The forecast period spans 2025-2033 and the historical period 2019-2024. Expect detailed analysis of key segments including Medical & Lifesciences, Aerospace & Defense, Media & Entertainment, and other end-user verticals. The report incorporates recent industry developments, including breakthroughs in pixel density (PPD) and advancements in OLED microdisplay technology. The global market is projected to reach xx Million by 2033.
Virtual Retinal Display Industry Market Structure & Competitive Dynamics
The virtual retinal display (VRD) market is characterized by moderate concentration, with several key players vying for market share. Innovation ecosystems are crucial, driven by advancements in microdisplay technology, optics, and processing power. Regulatory frameworks, particularly concerning safety and data privacy, are evolving and impacting market dynamics. Product substitutes, such as traditional displays and other augmented/virtual reality technologies, pose a competitive challenge. End-user trends, particularly in the medical and entertainment sectors, are driving demand for higher resolution and improved field-of-view displays.
- Market Concentration: The top five players hold an estimated xx% market share in 2025.
- M&A Activity: The industry has witnessed xx Million in M&A deals since 2019, with a focus on consolidating technological capabilities and expanding market reach. These activities have driven innovation, particularly in higher resolution displays and advanced optics systems.
- Innovation Ecosystems: Collaborative partnerships between display manufacturers, semiconductor companies, and software developers are driving innovation in VRD technology.
- Regulatory Landscape: Emerging regulations concerning data privacy and eye safety are creating both opportunities and challenges for VRD manufacturers.
Virtual Retinal Display Industry Industry Trends & Insights
The VRD market is experiencing significant growth, driven by technological advancements, increasing consumer demand for immersive experiences, and expanding applications across diverse industries. The Compound Annual Growth Rate (CAGR) from 2025 to 2033 is projected to be xx%, indicating substantial market expansion. Market penetration is increasing across various sectors, with notable growth in medical applications and the gaming/entertainment markets. Technological disruptions, such as advancements in OLED microdisplays and improved optics, are constantly pushing the boundaries of VRD technology, enhancing resolution, field of view, and overall user experience.
Several factors fuel this growth. Increased investments in research and development are leading to breakthroughs in display resolution and miniaturization. Furthermore, growing consumer demand for immersive entertainment, gaming, and interactive experiences are driving adoption in the entertainment sector. The medical sector also displays significant growth potential, driven by the increasing need for minimally invasive surgical procedures and advanced medical imaging techniques. The increasing demand for advanced display systems in the aerospace and defense sectors is another key factor contributing to the market's expansion. Competitive dynamics are also shaping the industry, as major players invest heavily in R&D and strategic acquisitions to gain a competitive edge.
Dominant Markets & Segments in Virtual Retinal Display Industry
The Medical & Lifesciences sector currently dominates the VRD market, accounting for xx% of global revenue in 2025. This is primarily due to the increasing adoption of VRD technology in minimally invasive surgeries, retinal imaging, and other medical procedures.
- Key Drivers in Medical & Lifesciences:
- Advancements in minimally invasive surgical techniques
- Growing demand for improved diagnostic tools
- Increased adoption in ophthalmology applications
- Government funding and support for medical technology innovation
The Aerospace and Defense sector is also showing promising growth, primarily driven by the need for advanced head-up displays and high-resolution imaging systems for defense applications.
- Key Drivers in Aerospace & Defense:
- Demand for advanced cockpit displays for enhanced pilot situational awareness
- Increasing use of VRD technology in defense and security applications
- Investment in next-generation military equipment
The Media and Entertainment segment demonstrates substantial growth potential, fueled by the rising demand for virtual and augmented reality experiences.
- Key Drivers in Media & Entertainment:
- Increased consumer interest in immersive gaming and entertainment
- Advancements in VR/AR technologies
- Growth in the adoption of virtual reality headsets
Virtual Retinal Display Industry Product Innovations
Recent innovations focus on increasing pixel density (PPD), expanding the field of view (FOV), and reducing the size and weight of VRD devices. Meta's pursuit of a Retina-resolution VR headset highlights the industry's drive towards higher resolutions exceeding 60 PPD. eMagin Corporation's OLED microdisplays showcase advancements in color gamut, contrast, and resolution, particularly suitable for medical applications like retinal surgery and imaging. These developments directly translate into superior user experiences, increased market penetration, and strengthened competitive positioning for leading manufacturers.
Report Segmentation & Scope
The report segments the VRD market primarily by end-user industry:
Medical & Lifesciences: This segment is projected to reach xx Million by 2033, driven by the increasing adoption of VRD technology in medical imaging and minimally invasive surgeries. The competitive landscape is highly fragmented, with several companies offering specialized solutions.
Aerospace and Defense: This segment is expected to witness xx Million in revenue by 2033, fuelled by the demand for advanced head-up displays and high-resolution imaging systems for defense applications. The market is relatively concentrated, with a few major players supplying this specialized niche.
Media and Entertainment: This rapidly growing segment is projected to reach xx Million by 2033, driven by increasing demand for immersive gaming and entertainment experiences in VR and AR applications. The market features fierce competition between established players and emerging startups.
Other End-user Verticals: This segment includes applications in industrial, automotive, and other sectors, and it's expected to contribute xx Million to the overall market revenue by 2033.
Key Drivers of Virtual Retinal Display Industry Growth
Technological advancements, particularly in microdisplay technology and optics, are driving VRD market growth. The increasing demand for immersive experiences across various sectors, such as gaming, entertainment, and healthcare, fuels further adoption. Supportive government policies and initiatives promoting technological innovation create a favorable environment for industry development. Moreover, rising investments in R&D among key players are fueling product development and expanding applications of VRD technology.
Challenges in the Virtual Retinal Display Industry Sector
High manufacturing costs and the complexity of VRD technology present significant challenges. Regulatory hurdles, including safety standards and data privacy concerns, can hinder market expansion. Supply chain disruptions, particularly concerning critical components like microdisplays and specialized optics, can impact production and market availability. Intense competition among established players and emerging startups places downward pressure on pricing and profit margins. These challenges can have quantifiable impacts on market growth, limiting the rate of expansion.
Leading Players in the Virtual Retinal Display Industry Market
- Vuzix
- OmniVision Technologies Inc
- Texas Instruments Inc
- eMagin Corporation
- Magic Leap Inc
- Optivent
- Human Interface Technology Laboratory
- Avegant Corporation
- Movidius Inc (Intel Corporation)
- QD Laser Co Ltd
- Analogix Semiconductor Inc
- Himax Technologies Inc
Key Developments in Virtual Retinal Display Industry Sector
December 2022: Meta announces plans for a Retina-resolution VR headset (around 60 PPD), highlighting the industry's push for higher resolution and improved visual fidelity. The company's Quest Pro boasts 22 PPD, surpassing its predecessor, Meta Quest 2.
December 2022: eMagin Corporation's participation at the 10th International Congress on OCT and OCT Angiography showcases the company's high-resolution OLED microdisplays and their applications in ophthalmology, solidifying their position in the medical VRD sector. The wide color gamut and high contrast of these displays further enhance diagnostic and surgical capabilities.
Summer 2022: The Butterscotch prototype achieves 55 PPD, a notable advancement but with limitations in field of view compared to current market leaders. This underlines the ongoing race for higher resolution while balancing other critical performance metrics.
Strategic Virtual Retinal Display Industry Market Outlook
The virtual retinal display market holds significant future potential driven by ongoing technological advancements, expanding applications across diverse industries, and increasing consumer demand. Strategic opportunities lie in developing high-resolution displays with wider fields of view, optimizing for specific applications such as medical imaging and augmented reality, and establishing strategic partnerships to leverage technological synergies. The market is poised for sustained growth as technological breakthroughs continue to drive improvements in display quality and affordability, making VRD technology more accessible to a broader range of applications and consumers.
Virtual Retinal Display Industry Segmentation
-
1. End-user Industry
- 1.1. Medical & Lifesciences
- 1.2. Aerospace and Defense
- 1.3. Media and Entertainment
- 1.4. Other End-user Verticals
Virtual Retinal Display Industry Segmentation By Geography
- 1. North America
- 2. Europe
- 3. Asia Pacific
- 4. Latin America
- 5. Middle East
Virtual Retinal Display Industry REPORT HIGHLIGHTS
| Aspects | Details |
|---|---|
| Study Period | 2019-2033 |
| Base Year | 2024 |
| Estimated Year | 2025 |
| Forecast Period | 2025-2033 |
| Historical Period | 2019-2024 |
| Growth Rate | CAGR of 42.60% from 2019-2033 |
| Segmentation |
|
Table of Contents
- 1. Introduction
- 1.1. Research Scope
- 1.2. Market Segmentation
- 1.3. Research Methodology
- 1.4. Definitions and Assumptions
- 2. Executive Summary
- 2.1. Introduction
- 3. Market Dynamics
- 3.1. Introduction
- 3.2. Market Drivers
- 3.2.1. Technical Advantages Over Screen-Based Devices
- 3.3. Market Restrains
- 3.3.1. Security Concerns Regarding Cloud-based Solutions
- 3.4. Market Trends
- 3.4.1. Virtual Reality and Augmented Reality are Gaining Surging Demand from the Entertainment Industry
- 4. Market Factor Analysis
- 4.1. Porters Five Forces
- 4.2. Supply/Value Chain
- 4.3. PESTEL analysis
- 4.4. Market Entropy
- 4.5. Patent/Trademark Analysis
- 5. Global Virtual Retinal Display Industry Analysis, Insights and Forecast, 2019-2031
- 5.1. Market Analysis, Insights and Forecast - by End-user Industry
- 5.1.1. Medical & Lifesciences
- 5.1.2. Aerospace and Defense
- 5.1.3. Media and Entertainment
- 5.1.4. Other End-user Verticals
- 5.2. Market Analysis, Insights and Forecast - by Region
- 5.2.1. North America
- 5.2.2. Europe
- 5.2.3. Asia Pacific
- 5.2.4. Latin America
- 5.2.5. Middle East
- 5.1. Market Analysis, Insights and Forecast - by End-user Industry
- 6. North America Virtual Retinal Display Industry Analysis, Insights and Forecast, 2019-2031
- 6.1. Market Analysis, Insights and Forecast - by End-user Industry
- 6.1.1. Medical & Lifesciences
- 6.1.2. Aerospace and Defense
- 6.1.3. Media and Entertainment
- 6.1.4. Other End-user Verticals
- 6.1. Market Analysis, Insights and Forecast - by End-user Industry
- 7. Europe Virtual Retinal Display Industry Analysis, Insights and Forecast, 2019-2031
- 7.1. Market Analysis, Insights and Forecast - by End-user Industry
- 7.1.1. Medical & Lifesciences
- 7.1.2. Aerospace and Defense
- 7.1.3. Media and Entertainment
- 7.1.4. Other End-user Verticals
- 7.1. Market Analysis, Insights and Forecast - by End-user Industry
- 8. Asia Pacific Virtual Retinal Display Industry Analysis, Insights and Forecast, 2019-2031
- 8.1. Market Analysis, Insights and Forecast - by End-user Industry
- 8.1.1. Medical & Lifesciences
- 8.1.2. Aerospace and Defense
- 8.1.3. Media and Entertainment
- 8.1.4. Other End-user Verticals
- 8.1. Market Analysis, Insights and Forecast - by End-user Industry
- 9. Latin America Virtual Retinal Display Industry Analysis, Insights and Forecast, 2019-2031
- 9.1. Market Analysis, Insights and Forecast - by End-user Industry
- 9.1.1. Medical & Lifesciences
- 9.1.2. Aerospace and Defense
- 9.1.3. Media and Entertainment
- 9.1.4. Other End-user Verticals
- 9.1. Market Analysis, Insights and Forecast - by End-user Industry
- 10. Middle East Virtual Retinal Display Industry Analysis, Insights and Forecast, 2019-2031
- 10.1. Market Analysis, Insights and Forecast - by End-user Industry
- 10.1.1. Medical & Lifesciences
- 10.1.2. Aerospace and Defense
- 10.1.3. Media and Entertainment
- 10.1.4. Other End-user Verticals
- 10.1. Market Analysis, Insights and Forecast - by End-user Industry
- 11. North America Virtual Retinal Display Industry Analysis, Insights and Forecast, 2019-2031
- 11.1. Market Analysis, Insights and Forecast - By Country/Sub-region
- 11.1.1 United States
- 11.1.2 Canada
- 11.1.3 Mexico
- 12. Europe Virtual Retinal Display Industry Analysis, Insights and Forecast, 2019-2031
- 12.1. Market Analysis, Insights and Forecast - By Country/Sub-region
- 12.1.1 Germany
- 12.1.2 United Kingdom
- 12.1.3 France
- 12.1.4 Spain
- 12.1.5 Italy
- 12.1.6 Spain
- 12.1.7 Belgium
- 12.1.8 Netherland
- 12.1.9 Nordics
- 12.1.10 Rest of Europe
- 13. Asia Pacific Virtual Retinal Display Industry Analysis, Insights and Forecast, 2019-2031
- 13.1. Market Analysis, Insights and Forecast - By Country/Sub-region
- 13.1.1 China
- 13.1.2 Japan
- 13.1.3 India
- 13.1.4 South Korea
- 13.1.5 Southeast Asia
- 13.1.6 Australia
- 13.1.7 Indonesia
- 13.1.8 Phillipes
- 13.1.9 Singapore
- 13.1.10 Thailandc
- 13.1.11 Rest of Asia Pacific
- 14. South America Virtual Retinal Display Industry Analysis, Insights and Forecast, 2019-2031
- 14.1. Market Analysis, Insights and Forecast - By Country/Sub-region
- 14.1.1 Brazil
- 14.1.2 Argentina
- 14.1.3 Peru
- 14.1.4 Chile
- 14.1.5 Colombia
- 14.1.6 Ecuador
- 14.1.7 Venezuela
- 14.1.8 Rest of South America
- 15. North America Virtual Retinal Display Industry Analysis, Insights and Forecast, 2019-2031
- 15.1. Market Analysis, Insights and Forecast - By Country/Sub-region
- 15.1.1 United States
- 15.1.2 Canada
- 15.1.3 Mexico
- 16. MEA Virtual Retinal Display Industry Analysis, Insights and Forecast, 2019-2031
- 16.1. Market Analysis, Insights and Forecast - By Country/Sub-region
- 16.1.1 United Arab Emirates
- 16.1.2 Saudi Arabia
- 16.1.3 South Africa
- 16.1.4 Rest of Middle East and Africa
- 17. Competitive Analysis
- 17.1. Global Market Share Analysis 2024
- 17.2. Company Profiles
- 17.2.1 Vuzix
- 17.2.1.1. Overview
- 17.2.1.2. Products
- 17.2.1.3. SWOT Analysis
- 17.2.1.4. Recent Developments
- 17.2.1.5. Financials (Based on Availability)
- 17.2.2 OmniVision Technologies Inc
- 17.2.2.1. Overview
- 17.2.2.2. Products
- 17.2.2.3. SWOT Analysis
- 17.2.2.4. Recent Developments
- 17.2.2.5. Financials (Based on Availability)
- 17.2.3 Texas Instruments Inc
- 17.2.3.1. Overview
- 17.2.3.2. Products
- 17.2.3.3. SWOT Analysis
- 17.2.3.4. Recent Developments
- 17.2.3.5. Financials (Based on Availability)
- 17.2.4 eMagin Corporation
- 17.2.4.1. Overview
- 17.2.4.2. Products
- 17.2.4.3. SWOT Analysis
- 17.2.4.4. Recent Developments
- 17.2.4.5. Financials (Based on Availability)
- 17.2.5 Magic Leap Inc
- 17.2.5.1. Overview
- 17.2.5.2. Products
- 17.2.5.3. SWOT Analysis
- 17.2.5.4. Recent Developments
- 17.2.5.5. Financials (Based on Availability)
- 17.2.6 Optivent
- 17.2.6.1. Overview
- 17.2.6.2. Products
- 17.2.6.3. SWOT Analysis
- 17.2.6.4. Recent Developments
- 17.2.6.5. Financials (Based on Availability)
- 17.2.7 Human Interface Technology Laboratory
- 17.2.7.1. Overview
- 17.2.7.2. Products
- 17.2.7.3. SWOT Analysis
- 17.2.7.4. Recent Developments
- 17.2.7.5. Financials (Based on Availability)
- 17.2.8 Avegant Corporation
- 17.2.8.1. Overview
- 17.2.8.2. Products
- 17.2.8.3. SWOT Analysis
- 17.2.8.4. Recent Developments
- 17.2.8.5. Financials (Based on Availability)
- 17.2.9 Movidius Inc (Intel Corporation)
- 17.2.9.1. Overview
- 17.2.9.2. Products
- 17.2.9.3. SWOT Analysis
- 17.2.9.4. Recent Developments
- 17.2.9.5. Financials (Based on Availability)
- 17.2.10 QD Laser Co Ltd
- 17.2.10.1. Overview
- 17.2.10.2. Products
- 17.2.10.3. SWOT Analysis
- 17.2.10.4. Recent Developments
- 17.2.10.5. Financials (Based on Availability)
- 17.2.11 Analogix Semiconductor Inc
- 17.2.11.1. Overview
- 17.2.11.2. Products
- 17.2.11.3. SWOT Analysis
- 17.2.11.4. Recent Developments
- 17.2.11.5. Financials (Based on Availability)
- 17.2.12 Himax Technologies Inc
- 17.2.12.1. Overview
- 17.2.12.2. Products
- 17.2.12.3. SWOT Analysis
- 17.2.12.4. Recent Developments
- 17.2.12.5. Financials (Based on Availability)
- 17.2.1 Vuzix
List of Figures
- Figure 1: Global Virtual Retinal Display Industry Revenue Breakdown (Million, %) by Region 2024 & 2032
- Figure 2: Global Virtual Retinal Display Industry Volume Breakdown (K Unit, %) by Region 2024 & 2032
- Figure 3: North America Virtual Retinal Display Industry Revenue (Million), by Country 2024 & 2032
- Figure 4: North America Virtual Retinal Display Industry Volume (K Unit), by Country 2024 & 2032
- Figure 5: North America Virtual Retinal Display Industry Revenue Share (%), by Country 2024 & 2032
- Figure 6: North America Virtual Retinal Display Industry Volume Share (%), by Country 2024 & 2032
- Figure 7: Europe Virtual Retinal Display Industry Revenue (Million), by Country 2024 & 2032
- Figure 8: Europe Virtual Retinal Display Industry Volume (K Unit), by Country 2024 & 2032
- Figure 9: Europe Virtual Retinal Display Industry Revenue Share (%), by Country 2024 & 2032
- Figure 10: Europe Virtual Retinal Display Industry Volume Share (%), by Country 2024 & 2032
- Figure 11: Asia Pacific Virtual Retinal Display Industry Revenue (Million), by Country 2024 & 2032
- Figure 12: Asia Pacific Virtual Retinal Display Industry Volume (K Unit), by Country 2024 & 2032
- Figure 13: Asia Pacific Virtual Retinal Display Industry Revenue Share (%), by Country 2024 & 2032
- Figure 14: Asia Pacific Virtual Retinal Display Industry Volume Share (%), by Country 2024 & 2032
- Figure 15: South America Virtual Retinal Display Industry Revenue (Million), by Country 2024 & 2032
- Figure 16: South America Virtual Retinal Display Industry Volume (K Unit), by Country 2024 & 2032
- Figure 17: South America Virtual Retinal Display Industry Revenue Share (%), by Country 2024 & 2032
- Figure 18: South America Virtual Retinal Display Industry Volume Share (%), by Country 2024 & 2032
- Figure 19: North America Virtual Retinal Display Industry Revenue (Million), by Country 2024 & 2032
- Figure 20: North America Virtual Retinal Display Industry Volume (K Unit), by Country 2024 & 2032
- Figure 21: North America Virtual Retinal Display Industry Revenue Share (%), by Country 2024 & 2032
- Figure 22: North America Virtual Retinal Display Industry Volume Share (%), by Country 2024 & 2032
- Figure 23: MEA Virtual Retinal Display Industry Revenue (Million), by Country 2024 & 2032
- Figure 24: MEA Virtual Retinal Display Industry Volume (K Unit), by Country 2024 & 2032
- Figure 25: MEA Virtual Retinal Display Industry Revenue Share (%), by Country 2024 & 2032
- Figure 26: MEA Virtual Retinal Display Industry Volume Share (%), by Country 2024 & 2032
- Figure 27: North America Virtual Retinal Display Industry Revenue (Million), by End-user Industry 2024 & 2032
- Figure 28: North America Virtual Retinal Display Industry Volume (K Unit), by End-user Industry 2024 & 2032
- Figure 29: North America Virtual Retinal Display Industry Revenue Share (%), by End-user Industry 2024 & 2032
- Figure 30: North America Virtual Retinal Display Industry Volume Share (%), by End-user Industry 2024 & 2032
- Figure 31: North America Virtual Retinal Display Industry Revenue (Million), by Country 2024 & 2032
- Figure 32: North America Virtual Retinal Display Industry Volume (K Unit), by Country 2024 & 2032
- Figure 33: North America Virtual Retinal Display Industry Revenue Share (%), by Country 2024 & 2032
- Figure 34: North America Virtual Retinal Display Industry Volume Share (%), by Country 2024 & 2032
- Figure 35: Europe Virtual Retinal Display Industry Revenue (Million), by End-user Industry 2024 & 2032
- Figure 36: Europe Virtual Retinal Display Industry Volume (K Unit), by End-user Industry 2024 & 2032
- Figure 37: Europe Virtual Retinal Display Industry Revenue Share (%), by End-user Industry 2024 & 2032
- Figure 38: Europe Virtual Retinal Display Industry Volume Share (%), by End-user Industry 2024 & 2032
- Figure 39: Europe Virtual Retinal Display Industry Revenue (Million), by Country 2024 & 2032
- Figure 40: Europe Virtual Retinal Display Industry Volume (K Unit), by Country 2024 & 2032
- Figure 41: Europe Virtual Retinal Display Industry Revenue Share (%), by Country 2024 & 2032
- Figure 42: Europe Virtual Retinal Display Industry Volume Share (%), by Country 2024 & 2032
- Figure 43: Asia Pacific Virtual Retinal Display Industry Revenue (Million), by End-user Industry 2024 & 2032
- Figure 44: Asia Pacific Virtual Retinal Display Industry Volume (K Unit), by End-user Industry 2024 & 2032
- Figure 45: Asia Pacific Virtual Retinal Display Industry Revenue Share (%), by End-user Industry 2024 & 2032
- Figure 46: Asia Pacific Virtual Retinal Display Industry Volume Share (%), by End-user Industry 2024 & 2032
- Figure 47: Asia Pacific Virtual Retinal Display Industry Revenue (Million), by Country 2024 & 2032
- Figure 48: Asia Pacific Virtual Retinal Display Industry Volume (K Unit), by Country 2024 & 2032
- Figure 49: Asia Pacific Virtual Retinal Display Industry Revenue Share (%), by Country 2024 & 2032
- Figure 50: Asia Pacific Virtual Retinal Display Industry Volume Share (%), by Country 2024 & 2032
- Figure 51: Latin America Virtual Retinal Display Industry Revenue (Million), by End-user Industry 2024 & 2032
- Figure 52: Latin America Virtual Retinal Display Industry Volume (K Unit), by End-user Industry 2024 & 2032
- Figure 53: Latin America Virtual Retinal Display Industry Revenue Share (%), by End-user Industry 2024 & 2032
- Figure 54: Latin America Virtual Retinal Display Industry Volume Share (%), by End-user Industry 2024 & 2032
- Figure 55: Latin America Virtual Retinal Display Industry Revenue (Million), by Country 2024 & 2032
- Figure 56: Latin America Virtual Retinal Display Industry Volume (K Unit), by Country 2024 & 2032
- Figure 57: Latin America Virtual Retinal Display Industry Revenue Share (%), by Country 2024 & 2032
- Figure 58: Latin America Virtual Retinal Display Industry Volume Share (%), by Country 2024 & 2032
- Figure 59: Middle East Virtual Retinal Display Industry Revenue (Million), by End-user Industry 2024 & 2032
- Figure 60: Middle East Virtual Retinal Display Industry Volume (K Unit), by End-user Industry 2024 & 2032
- Figure 61: Middle East Virtual Retinal Display Industry Revenue Share (%), by End-user Industry 2024 & 2032
- Figure 62: Middle East Virtual Retinal Display Industry Volume Share (%), by End-user Industry 2024 & 2032
- Figure 63: Middle East Virtual Retinal Display Industry Revenue (Million), by Country 2024 & 2032
- Figure 64: Middle East Virtual Retinal Display Industry Volume (K Unit), by Country 2024 & 2032
- Figure 65: Middle East Virtual Retinal Display Industry Revenue Share (%), by Country 2024 & 2032
- Figure 66: Middle East Virtual Retinal Display Industry Volume Share (%), by Country 2024 & 2032
List of Tables
- Table 1: Global Virtual Retinal Display Industry Revenue Million Forecast, by Region 2019 & 2032
- Table 2: Global Virtual Retinal Display Industry Volume K Unit Forecast, by Region 2019 & 2032
- Table 3: Global Virtual Retinal Display Industry Revenue Million Forecast, by End-user Industry 2019 & 2032
- Table 4: Global Virtual Retinal Display Industry Volume K Unit Forecast, by End-user Industry 2019 & 2032
- Table 5: Global Virtual Retinal Display Industry Revenue Million Forecast, by Region 2019 & 2032
- Table 6: Global Virtual Retinal Display Industry Volume K Unit Forecast, by Region 2019 & 2032
- Table 7: Global Virtual Retinal Display Industry Revenue Million Forecast, by Country 2019 & 2032
- Table 8: Global Virtual Retinal Display Industry Volume K Unit Forecast, by Country 2019 & 2032
- Table 9: United States Virtual Retinal Display Industry Revenue (Million) Forecast, by Application 2019 & 2032
- Table 10: United States Virtual Retinal Display Industry Volume (K Unit) Forecast, by Application 2019 & 2032
- Table 11: Canada Virtual Retinal Display Industry Revenue (Million) Forecast, by Application 2019 & 2032
- Table 12: Canada Virtual Retinal Display Industry Volume (K Unit) Forecast, by Application 2019 & 2032
- Table 13: Mexico Virtual Retinal Display Industry Revenue (Million) Forecast, by Application 2019 & 2032
- Table 14: Mexico Virtual Retinal Display Industry Volume (K Unit) Forecast, by Application 2019 & 2032
- Table 15: Global Virtual Retinal Display Industry Revenue Million Forecast, by Country 2019 & 2032
- Table 16: Global Virtual Retinal Display Industry Volume K Unit Forecast, by Country 2019 & 2032
- Table 17: Germany Virtual Retinal Display Industry Revenue (Million) Forecast, by Application 2019 & 2032
- Table 18: Germany Virtual Retinal Display Industry Volume (K Unit) Forecast, by Application 2019 & 2032
- Table 19: United Kingdom Virtual Retinal Display Industry Revenue (Million) Forecast, by Application 2019 & 2032
- Table 20: United Kingdom Virtual Retinal Display Industry Volume (K Unit) Forecast, by Application 2019 & 2032
- Table 21: France Virtual Retinal Display Industry Revenue (Million) Forecast, by Application 2019 & 2032
- Table 22: France Virtual Retinal Display Industry Volume (K Unit) Forecast, by Application 2019 & 2032
- Table 23: Spain Virtual Retinal Display Industry Revenue (Million) Forecast, by Application 2019 & 2032
- Table 24: Spain Virtual Retinal Display Industry Volume (K Unit) Forecast, by Application 2019 & 2032
- Table 25: Italy Virtual Retinal Display Industry Revenue (Million) Forecast, by Application 2019 & 2032
- Table 26: Italy Virtual Retinal Display Industry Volume (K Unit) Forecast, by Application 2019 & 2032
- Table 27: Spain Virtual Retinal Display Industry Revenue (Million) Forecast, by Application 2019 & 2032
- Table 28: Spain Virtual Retinal Display Industry Volume (K Unit) Forecast, by Application 2019 & 2032
- Table 29: Belgium Virtual Retinal Display Industry Revenue (Million) Forecast, by Application 2019 & 2032
- Table 30: Belgium Virtual Retinal Display Industry Volume (K Unit) Forecast, by Application 2019 & 2032
- Table 31: Netherland Virtual Retinal Display Industry Revenue (Million) Forecast, by Application 2019 & 2032
- Table 32: Netherland Virtual Retinal Display Industry Volume (K Unit) Forecast, by Application 2019 & 2032
- Table 33: Nordics Virtual Retinal Display Industry Revenue (Million) Forecast, by Application 2019 & 2032
- Table 34: Nordics Virtual Retinal Display Industry Volume (K Unit) Forecast, by Application 2019 & 2032
- Table 35: Rest of Europe Virtual Retinal Display Industry Revenue (Million) Forecast, by Application 2019 & 2032
- Table 36: Rest of Europe Virtual Retinal Display Industry Volume (K Unit) Forecast, by Application 2019 & 2032
- Table 37: Global Virtual Retinal Display Industry Revenue Million Forecast, by Country 2019 & 2032
- Table 38: Global Virtual Retinal Display Industry Volume K Unit Forecast, by Country 2019 & 2032
- Table 39: China Virtual Retinal Display Industry Revenue (Million) Forecast, by Application 2019 & 2032
- Table 40: China Virtual Retinal Display Industry Volume (K Unit) Forecast, by Application 2019 & 2032
- Table 41: Japan Virtual Retinal Display Industry Revenue (Million) Forecast, by Application 2019 & 2032
- Table 42: Japan Virtual Retinal Display Industry Volume (K Unit) Forecast, by Application 2019 & 2032
- Table 43: India Virtual Retinal Display Industry Revenue (Million) Forecast, by Application 2019 & 2032
- Table 44: India Virtual Retinal Display Industry Volume (K Unit) Forecast, by Application 2019 & 2032
- Table 45: South Korea Virtual Retinal Display Industry Revenue (Million) Forecast, by Application 2019 & 2032
- Table 46: South Korea Virtual Retinal Display Industry Volume (K Unit) Forecast, by Application 2019 & 2032
- Table 47: Southeast Asia Virtual Retinal Display Industry Revenue (Million) Forecast, by Application 2019 & 2032
- Table 48: Southeast Asia Virtual Retinal Display Industry Volume (K Unit) Forecast, by Application 2019 & 2032
- Table 49: Australia Virtual Retinal Display Industry Revenue (Million) Forecast, by Application 2019 & 2032
- Table 50: Australia Virtual Retinal Display Industry Volume (K Unit) Forecast, by Application 2019 & 2032
- Table 51: Indonesia Virtual Retinal Display Industry Revenue (Million) Forecast, by Application 2019 & 2032
- Table 52: Indonesia Virtual Retinal Display Industry Volume (K Unit) Forecast, by Application 2019 & 2032
- Table 53: Phillipes Virtual Retinal Display Industry Revenue (Million) Forecast, by Application 2019 & 2032
- Table 54: Phillipes Virtual Retinal Display Industry Volume (K Unit) Forecast, by Application 2019 & 2032
- Table 55: Singapore Virtual Retinal Display Industry Revenue (Million) Forecast, by Application 2019 & 2032
- Table 56: Singapore Virtual Retinal Display Industry Volume (K Unit) Forecast, by Application 2019 & 2032
- Table 57: Thailandc Virtual Retinal Display Industry Revenue (Million) Forecast, by Application 2019 & 2032
- Table 58: Thailandc Virtual Retinal Display Industry Volume (K Unit) Forecast, by Application 2019 & 2032
- Table 59: Rest of Asia Pacific Virtual Retinal Display Industry Revenue (Million) Forecast, by Application 2019 & 2032
- Table 60: Rest of Asia Pacific Virtual Retinal Display Industry Volume (K Unit) Forecast, by Application 2019 & 2032
- Table 61: Global Virtual Retinal Display Industry Revenue Million Forecast, by Country 2019 & 2032
- Table 62: Global Virtual Retinal Display Industry Volume K Unit Forecast, by Country 2019 & 2032
- Table 63: Brazil Virtual Retinal Display Industry Revenue (Million) Forecast, by Application 2019 & 2032
- Table 64: Brazil Virtual Retinal Display Industry Volume (K Unit) Forecast, by Application 2019 & 2032
- Table 65: Argentina Virtual Retinal Display Industry Revenue (Million) Forecast, by Application 2019 & 2032
- Table 66: Argentina Virtual Retinal Display Industry Volume (K Unit) Forecast, by Application 2019 & 2032
- Table 67: Peru Virtual Retinal Display Industry Revenue (Million) Forecast, by Application 2019 & 2032
- Table 68: Peru Virtual Retinal Display Industry Volume (K Unit) Forecast, by Application 2019 & 2032
- Table 69: Chile Virtual Retinal Display Industry Revenue (Million) Forecast, by Application 2019 & 2032
- Table 70: Chile Virtual Retinal Display Industry Volume (K Unit) Forecast, by Application 2019 & 2032
- Table 71: Colombia Virtual Retinal Display Industry Revenue (Million) Forecast, by Application 2019 & 2032
- Table 72: Colombia Virtual Retinal Display Industry Volume (K Unit) Forecast, by Application 2019 & 2032
- Table 73: Ecuador Virtual Retinal Display Industry Revenue (Million) Forecast, by Application 2019 & 2032
- Table 74: Ecuador Virtual Retinal Display Industry Volume (K Unit) Forecast, by Application 2019 & 2032
- Table 75: Venezuela Virtual Retinal Display Industry Revenue (Million) Forecast, by Application 2019 & 2032
- Table 76: Venezuela Virtual Retinal Display Industry Volume (K Unit) Forecast, by Application 2019 & 2032
- Table 77: Rest of South America Virtual Retinal Display Industry Revenue (Million) Forecast, by Application 2019 & 2032
- Table 78: Rest of South America Virtual Retinal Display Industry Volume (K Unit) Forecast, by Application 2019 & 2032
- Table 79: Global Virtual Retinal Display Industry Revenue Million Forecast, by Country 2019 & 2032
- Table 80: Global Virtual Retinal Display Industry Volume K Unit Forecast, by Country 2019 & 2032
- Table 81: United States Virtual Retinal Display Industry Revenue (Million) Forecast, by Application 2019 & 2032
- Table 82: United States Virtual Retinal Display Industry Volume (K Unit) Forecast, by Application 2019 & 2032
- Table 83: Canada Virtual Retinal Display Industry Revenue (Million) Forecast, by Application 2019 & 2032
- Table 84: Canada Virtual Retinal Display Industry Volume (K Unit) Forecast, by Application 2019 & 2032
- Table 85: Mexico Virtual Retinal Display Industry Revenue (Million) Forecast, by Application 2019 & 2032
- Table 86: Mexico Virtual Retinal Display Industry Volume (K Unit) Forecast, by Application 2019 & 2032
- Table 87: Global Virtual Retinal Display Industry Revenue Million Forecast, by Country 2019 & 2032
- Table 88: Global Virtual Retinal Display Industry Volume K Unit Forecast, by Country 2019 & 2032
- Table 89: United Arab Emirates Virtual Retinal Display Industry Revenue (Million) Forecast, by Application 2019 & 2032
- Table 90: United Arab Emirates Virtual Retinal Display Industry Volume (K Unit) Forecast, by Application 2019 & 2032
- Table 91: Saudi Arabia Virtual Retinal Display Industry Revenue (Million) Forecast, by Application 2019 & 2032
- Table 92: Saudi Arabia Virtual Retinal Display Industry Volume (K Unit) Forecast, by Application 2019 & 2032
- Table 93: South Africa Virtual Retinal Display Industry Revenue (Million) Forecast, by Application 2019 & 2032
- Table 94: South Africa Virtual Retinal Display Industry Volume (K Unit) Forecast, by Application 2019 & 2032
- Table 95: Rest of Middle East and Africa Virtual Retinal Display Industry Revenue (Million) Forecast, by Application 2019 & 2032
- Table 96: Rest of Middle East and Africa Virtual Retinal Display Industry Volume (K Unit) Forecast, by Application 2019 & 2032
- Table 97: Global Virtual Retinal Display Industry Revenue Million Forecast, by End-user Industry 2019 & 2032
- Table 98: Global Virtual Retinal Display Industry Volume K Unit Forecast, by End-user Industry 2019 & 2032
- Table 99: Global Virtual Retinal Display Industry Revenue Million Forecast, by Country 2019 & 2032
- Table 100: Global Virtual Retinal Display Industry Volume K Unit Forecast, by Country 2019 & 2032
- Table 101: Global Virtual Retinal Display Industry Revenue Million Forecast, by End-user Industry 2019 & 2032
- Table 102: Global Virtual Retinal Display Industry Volume K Unit Forecast, by End-user Industry 2019 & 2032
- Table 103: Global Virtual Retinal Display Industry Revenue Million Forecast, by Country 2019 & 2032
- Table 104: Global Virtual Retinal Display Industry Volume K Unit Forecast, by Country 2019 & 2032
- Table 105: Global Virtual Retinal Display Industry Revenue Million Forecast, by End-user Industry 2019 & 2032
- Table 106: Global Virtual Retinal Display Industry Volume K Unit Forecast, by End-user Industry 2019 & 2032
- Table 107: Global Virtual Retinal Display Industry Revenue Million Forecast, by Country 2019 & 2032
- Table 108: Global Virtual Retinal Display Industry Volume K Unit Forecast, by Country 2019 & 2032
- Table 109: Global Virtual Retinal Display Industry Revenue Million Forecast, by End-user Industry 2019 & 2032
- Table 110: Global Virtual Retinal Display Industry Volume K Unit Forecast, by End-user Industry 2019 & 2032
- Table 111: Global Virtual Retinal Display Industry Revenue Million Forecast, by Country 2019 & 2032
- Table 112: Global Virtual Retinal Display Industry Volume K Unit Forecast, by Country 2019 & 2032
- Table 113: Global Virtual Retinal Display Industry Revenue Million Forecast, by End-user Industry 2019 & 2032
- Table 114: Global Virtual Retinal Display Industry Volume K Unit Forecast, by End-user Industry 2019 & 2032
- Table 115: Global Virtual Retinal Display Industry Revenue Million Forecast, by Country 2019 & 2032
- Table 116: Global Virtual Retinal Display Industry Volume K Unit Forecast, by Country 2019 & 2032
Frequently Asked Questions
1. What is the projected Compound Annual Growth Rate (CAGR) of the Virtual Retinal Display Industry?
The projected CAGR is approximately 42.60%.
2. Which companies are prominent players in the Virtual Retinal Display Industry?
Key companies in the market include Vuzix, OmniVision Technologies Inc, Texas Instruments Inc, eMagin Corporation, Magic Leap Inc, Optivent, Human Interface Technology Laboratory, Avegant Corporation, Movidius Inc (Intel Corporation), QD Laser Co Ltd, Analogix Semiconductor Inc, Himax Technologies Inc.
3. What are the main segments of the Virtual Retinal Display Industry?
The market segments include End-user Industry.
4. Can you provide details about the market size?
The market size is estimated to be USD XX Million as of 2022.
5. What are some drivers contributing to market growth?
Technical Advantages Over Screen-Based Devices.
6. What are the notable trends driving market growth?
Virtual Reality and Augmented Reality are Gaining Surging Demand from the Entertainment Industry.
7. Are there any restraints impacting market growth?
Security Concerns Regarding Cloud-based Solutions.
8. Can you provide examples of recent developments in the market?
December 2022: Meta confirms that it plans to bring a Retina-resolution VR headset to product maturity. Quest Pro has ten percent more PPD than Meta Quest 2, according to Meta (22 vs. 20 PPD). The PPD value takes the screen and the optics into account and measures the number of pixels within 1° of the field of view. For comparison, the Retina's 'resolution' is around 60 PPD, which is also the value Meta is aiming In the summer, display researchers presented the Butterscotch prototype, which achieves 55 PPD, but only has half the field of view of Meta Quest 2.
9. What pricing options are available for accessing the report?
Pricing options include single-user, multi-user, and enterprise licenses priced at USD 4750, USD 5250, and USD 8750 respectively.
10. Is the market size provided in terms of value or volume?
The market size is provided in terms of value, measured in Million and volume, measured in K Unit.
11. Are there any specific market keywords associated with the report?
Yes, the market keyword associated with the report is "Virtual Retinal Display Industry," which aids in identifying and referencing the specific market segment covered.
12. How do I determine which pricing option suits my needs best?
The pricing options vary based on user requirements and access needs. Individual users may opt for single-user licenses, while businesses requiring broader access may choose multi-user or enterprise licenses for cost-effective access to the report.
13. Are there any additional resources or data provided in the Virtual Retinal Display Industry report?
While the report offers comprehensive insights, it's advisable to review the specific contents or supplementary materials provided to ascertain if additional resources or data are available.
14. How can I stay updated on further developments or reports in the Virtual Retinal Display Industry?
To stay informed about further developments, trends, and reports in the Virtual Retinal Display Industry, consider subscribing to industry newsletters, following relevant companies and organizations, or regularly checking reputable industry news sources and publications.
Methodology
Step 1 - Identification of Relevant Samples Size from Population Database


Step 2 - Approaches for Defining Global Market Size (Value, Volume* & Price*)

Note*: In applicable scenarios
Step 3 - Data Sources
Primary Research
- Web Analytics
- Survey Reports
- Research Institute
- Latest Research Reports
- Opinion Leaders
Secondary Research
- Annual Reports
- White Paper
- Latest Press Release
- Industry Association
- Paid Database
- Investor Presentations

Step 4 - Data Triangulation
Involves using different sources of information in order to increase the validity of a study
These sources are likely to be stakeholders in a program - participants, other researchers, program staff, other community members, and so on.
Then we put all data in single framework & apply various statistical tools to find out the dynamic on the market.
During the analysis stage, feedback from the stakeholder groups would be compared to determine areas of agreement as well as areas of divergence


