
Key Insights
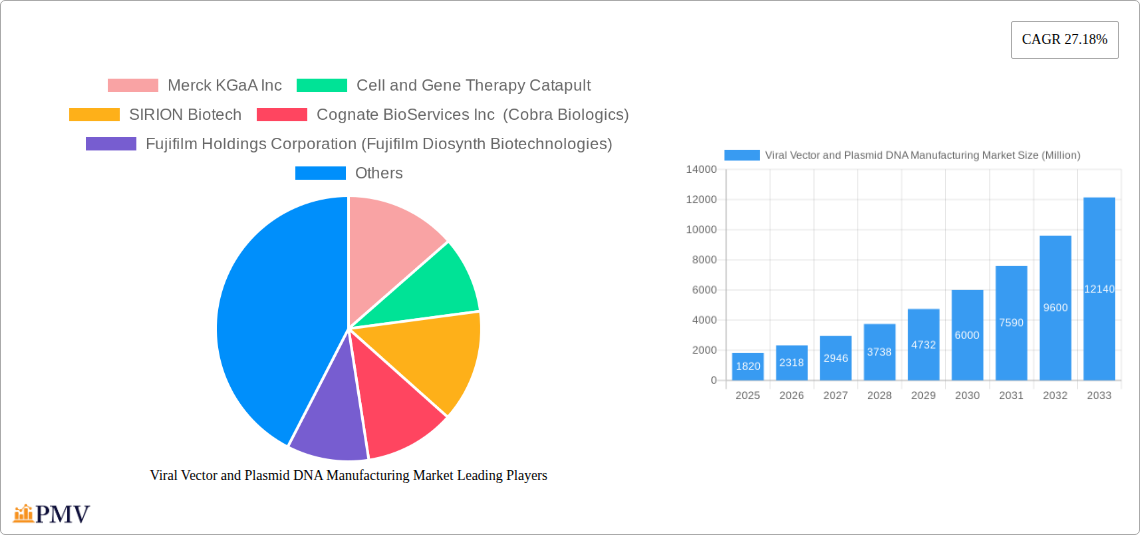
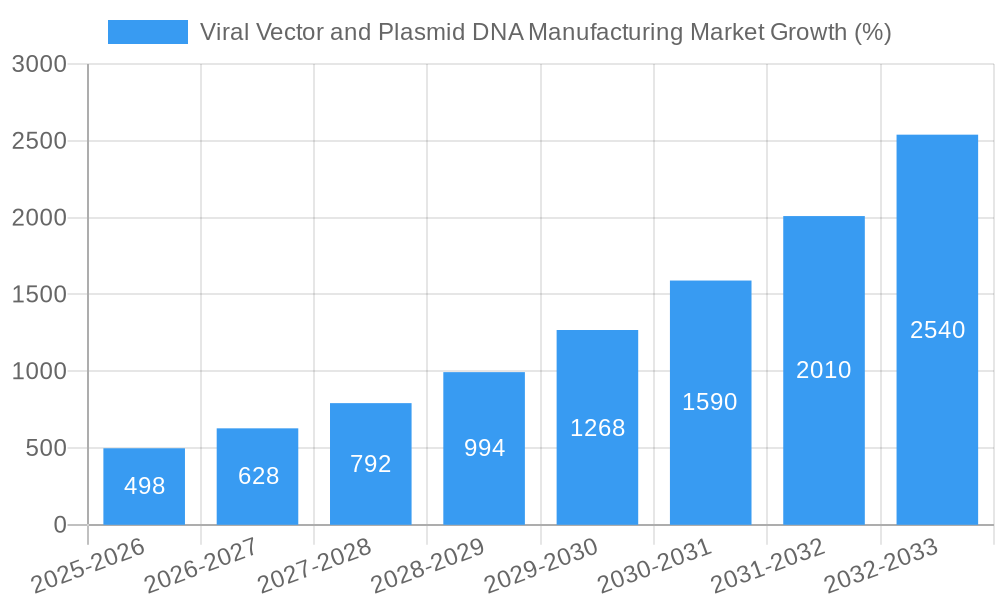
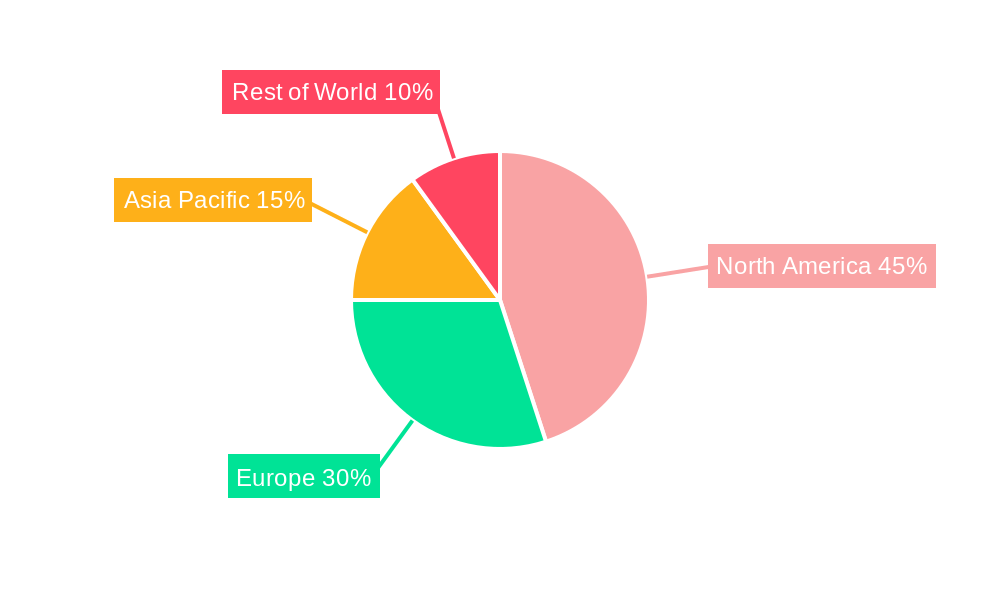
The viral vector and plasmid DNA manufacturing market is experiencing robust growth, driven by the burgeoning cell and gene therapy industry. The market, valued at $1.82 billion in 2025, is projected to expand significantly over the forecast period (2025-2033), fueled by a remarkable compound annual growth rate (CAGR) of 27.18%. This expansion is primarily attributed to the increasing prevalence of genetic disorders and cancer, coupled with the rising demand for personalized medicine. Advancements in viral vector and plasmid DNA technologies, including improved manufacturing processes and enhanced safety profiles, further contribute to market growth. Significant investments in research and development by pharmaceutical and biotechnology companies, along with strategic collaborations and partnerships, are accelerating the development and commercialization of novel cell and gene therapies, thereby stimulating demand for high-quality viral vectors and plasmid DNA. The market segmentation reveals strong demand across various applications, notably cancer therapies, which currently constitute a significant portion of the market, followed by genetic disorders and infectious disease treatments. North America and Europe currently hold the largest market shares, driven by robust regulatory frameworks, advanced healthcare infrastructure, and a high concentration of key players. However, the Asia-Pacific region is expected to witness substantial growth in the coming years due to increasing investments in healthcare infrastructure and growing awareness of advanced therapies.
The competitive landscape is characterized by a mix of established pharmaceutical companies and specialized biotechnology firms. Key players are focusing on strategic collaborations, acquisitions, and capacity expansions to meet the rising demand. The market is also witnessing increased adoption of innovative manufacturing technologies to improve efficiency, reduce costs, and enhance product quality. Challenges remain, including the high cost of manufacturing, stringent regulatory requirements, and potential safety concerns associated with certain viral vectors. However, ongoing research and development efforts are addressing these challenges, paving the way for sustained market growth and wider accessibility of cell and gene therapies in the years to come. The market's future trajectory is heavily reliant on continued innovation, regulatory approvals, and successful clinical trials of novel cell and gene therapies.
Viral Vector and Plasmid DNA Manufacturing Market: A Comprehensive Report (2019-2033)
This comprehensive report provides a detailed analysis of the Viral Vector and Plasmid DNA Manufacturing Market, offering invaluable insights for industry stakeholders, investors, and researchers. The report covers the period from 2019 to 2033, with a base year of 2025 and a forecast period extending to 2033. The market is segmented by product type (Plasmid DNA, Viral Vector, Non-viral Vector) and application (Cancer, Genetic Disorder, Infectious Disease, Other Applications). The report projects a market value of xx Million by 2033, exhibiting a CAGR of xx% during the forecast period.
Viral Vector and Plasmid DNA Manufacturing Market Market Structure & Competitive Dynamics
The Viral Vector and Plasmid DNA Manufacturing Market is characterized by a moderately consolidated structure, with several key players holding significant market share. The market exhibits a dynamic competitive landscape fueled by continuous innovation, strategic mergers and acquisitions (M&A), and evolving regulatory frameworks. Leading players are actively investing in research and development to enhance production efficiency, improve product quality, and expand their service offerings. The market also witnesses collaborations and partnerships to leverage complementary expertise and expand market reach.
Market concentration is moderate, with the top five players accounting for approximately xx% of the global market share in 2024. Recent M&A activity highlights the industry's consolidation trend, with deal values ranging from xx Million to xx Million. Examples include the acquisition of Genopis Inc. by Wacker in February 2021. Product substitutes, primarily focusing on alternative gene delivery methods, present a challenge to market participants. End-user trends, particularly the increasing demand for personalized medicine and advanced therapies, are driving market growth. The regulatory landscape, encompassing stringent quality control and safety standards, significantly influences market dynamics.
Viral Vector and Plasmid DNA Manufacturing Market Industry Trends & Insights
The Viral Vector and Plasmid DNA Manufacturing Market is experiencing robust growth, driven by several key factors. The increasing prevalence of chronic diseases, particularly cancer and genetic disorders, is fueling demand for advanced therapies. Technological advancements, including the development of novel vector systems and efficient manufacturing processes, are enhancing production capabilities and reducing costs. The rising adoption of gene therapy and cell therapy is a major catalyst, expanding the market for viral vectors and plasmid DNA. Furthermore, the increasing investment in research and development by both established players and emerging biotech companies is fostering innovation and expanding the therapeutic applications of these technologies. The market also benefits from favorable regulatory policies in key regions, including the United States and Europe, supporting the development and commercialization of novel therapies. The market is expected to witness a CAGR of xx% during the forecast period, with a significant increase in market penetration across various therapeutic areas.
Dominant Markets & Segments in Viral Vector and Plasmid DNA Manufacturing Market
The North American market holds the largest share in the Viral Vector and Plasmid DNA Manufacturing Market, driven by a robust life sciences ecosystem, significant investments in research and development, and a favorable regulatory environment. The strong presence of major players, including Merck KGaA Inc, Catalent Inc, and Thermo Fisher Scientific, further contributes to its dominance.
- Key Drivers for North American Dominance:
- Strong government funding for research and development in gene therapy.
- High concentration of biotech and pharmaceutical companies.
- Well-established regulatory pathways for advanced therapies.
The Cancer therapy segment accounts for the largest share within the applications segment, owing to the increasing prevalence of various types of cancer and the growing success of gene and cell therapies in cancer treatment.
- Key Drivers for Cancer Therapy Segment Dominance:
- High prevalence of cancer globally.
- Significant advancements in cancer immunotherapy and targeted therapies using viral vectors.
- Growing investments in cancer research and development.
Within the product type segment, the Viral Vector segment holds the largest share, driven by the versatility of viral vectors in delivering therapeutic genes to target cells and tissues. The Plasmid DNA segment is also showing robust growth, driven by its use in DNA vaccines and other therapeutic applications.
Viral Vector and Plasmid DNA Manufacturing Market Product Innovations
Recent product innovations in the viral vector and plasmid DNA manufacturing market focus on improving production efficiency, scalability, and safety. Developments include novel vector designs, advanced transfection methods, and automated manufacturing systems. This leads to enhanced control over vector production, resulting in improved product purity and consistency. These innovations address the growing demand for high-quality viral vectors and plasmid DNA for clinical applications, while also catering to the increasing need for cost-effective manufacturing solutions. The market is witnessing a trend toward the development of GMP-compliant manufacturing facilities to meet the stringent regulatory requirements for clinical trials and commercialization.
Report Segmentation & Scope
The report segments the Viral Vector and Plasmid DNA Manufacturing Market by product type, encompassing Plasmid DNA, Viral Vector (including Adeno-associated virus (AAV), Lentivirus, Adenovirus, Retrovirus and others), and Non-viral Vector. Each segment is analyzed in terms of market size, growth projections, and competitive dynamics. The market is further segmented by application, including Cancer, Genetic Disorders, Infectious Diseases, and Other Applications. Growth projections for each segment are provided based on factors such as disease prevalence, technological advancements, and regulatory approvals. The report explores the competitive landscape within each segment, highlighting leading players, their market share, and strategic initiatives.
Key Drivers of Viral Vector and Plasmid DNA Manufacturing Market Growth
Several factors are driving the growth of the Viral Vector and Plasmid DNA Manufacturing Market. Firstly, the increasing prevalence of chronic diseases, particularly cancer and genetic disorders, creates significant demand for innovative therapies. Secondly, technological advancements leading to more efficient and scalable manufacturing processes are lowering production costs and enhancing product quality. Thirdly, favourable regulatory environments in key markets are accelerating the approval and commercialization of advanced therapies, while increased investments from both public and private sectors fuel further innovation and market expansion.
Challenges in the Viral Vector and Plasmid DNA Manufacturing Market Sector
Despite significant growth potential, the Viral Vector and Plasmid DNA Manufacturing Market faces several challenges. Stringent regulatory requirements necessitate significant investments in compliance and quality control, impacting overall profitability. The complexity of manufacturing processes and the need for specialized expertise create barriers to entry for new players. Furthermore, the supply chain for raw materials, including specialized cell lines and reagents, can be unpredictable, affecting production timelines and costs. Competitive pressures, characterized by the increasing number of players entering the market, pose a significant challenge to existing players.
Leading Players in the Viral Vector and Plasmid DNA Manufacturing Market Market
- Merck KGaA Inc
- Cell and Gene Therapy Catapult
- SIRION Biotech
- Cognate BioServices Inc (Cobra Biologics)
- Fujifilm Holdings Corporation (Fujifilm Diosynth Biotechnologies)
- MassBiologics
- Oxford Biomedica
- Uniqure NV
- Catalent Inc
- Thermo Fisher Scientific
- FinVector Vision Therapies
Key Developments in Viral Vector and Plasmid DNA Manufacturing Market Sector
- July 2021: Thermo Fisher Scientific Inc. launched a new cGMP plasmid DNA manufacturing facility in Carlsbad, California, addressing the growing demand for plasmid DNA-based therapies and mRNA vaccines.
- February 2021: Wacker acquired Genopis Inc., a major US plasmid DNA manufacturer, strengthening its position in the market.
- June 2020: Aldevron collaborated with Ziopharm Oncology to produce plasmid DNA for T-cell therapy of solid tumors, demonstrating the growing partnerships within the industry.
Strategic Viral Vector and Plasmid DNA Manufacturing Market Market Outlook
The Viral Vector and Plasmid DNA Manufacturing Market holds substantial growth potential driven by continuous technological advancements, increasing demand for gene and cell therapies, and favorable regulatory environments. Strategic opportunities exist for companies focusing on developing novel vector systems, improving manufacturing efficiencies, and expanding into new therapeutic areas. Companies adopting a collaborative approach through strategic partnerships and M&A activities are well-positioned to capitalize on the market's growth potential. The market is poised for continued expansion, offering significant opportunities for investors and industry participants alike.
Viral Vector and Plasmid DNA Manufacturing Market Segmentation
-
1. Product Type
- 1.1. Plasmid DNA
- 1.2. Viral Vector
- 1.3. Non-viral Vector
-
2. Application
- 2.1. Cancer
- 2.2. Genetic Disorder
- 2.3. Infectious Disease
- 2.4. Other Applications
Viral Vector and Plasmid DNA Manufacturing Market Segmentation By Geography
-
1. North America
- 1.1. United States
- 1.2. Canada
- 1.3. Mexico
-
2. Europe
- 2.1. United Kingdom
- 2.2. Germany
- 2.3. France
- 2.4. Italy
- 2.5. Spain
- 2.6. Rest of Europe
-
3. Asia Pacific
- 3.1. China
- 3.2. Japan
- 3.3. India
- 3.4. Australia
- 3.5. South Korea
- 3.6. Rest of Asia Pacific
-
4. Middle East and Africa
- 4.1. GCC
- 4.2. South Africa
- 4.3. Rest of Middle East and Africa
-
5. South America
- 5.1. Brazil
- 5.2. Argentina
- 5.3. Rest of South America
Viral Vector and Plasmid DNA Manufacturing Market REPORT HIGHLIGHTS
| Aspects | Details |
|---|---|
| Study Period | 2019-2033 |
| Base Year | 2024 |
| Estimated Year | 2025 |
| Forecast Period | 2025-2033 |
| Historical Period | 2019-2024 |
| Growth Rate | CAGR of 27.18% from 2019-2033 |
| Segmentation |
|
Table of Contents
- 1. Introduction
- 1.1. Research Scope
- 1.2. Market Segmentation
- 1.3. Research Methodology
- 1.4. Definitions and Assumptions
- 2. Executive Summary
- 2.1. Introduction
- 3. Market Dynamics
- 3.1. Introduction
- 3.2. Market Drivers
- 3.2.1 Rising Prevalence of Genetic Disorders
- 3.2.2 Cancer
- 3.2.3 and Infectious Diseases; Increasing Number of Clinical Studies and Availability of Funding for Gene Therapy Development; Potential Applications in Novel Drug Delivery Approaches
- 3.3. Market Restrains
- 3.3.1. High Cost of Gene Therapies; Challenges in Viral Vector Manufacturing Capacity
- 3.4. Market Trends
- 3.4.1 By Application
- 3.4.2 Cancer Segment is Expected to Register Robust Growth.
- 4. Market Factor Analysis
- 4.1. Porters Five Forces
- 4.2. Supply/Value Chain
- 4.3. PESTEL analysis
- 4.4. Market Entropy
- 4.5. Patent/Trademark Analysis
- 5. Global Viral Vector and Plasmid DNA Manufacturing Market Analysis, Insights and Forecast, 2019-2031
- 5.1. Market Analysis, Insights and Forecast - by Product Type
- 5.1.1. Plasmid DNA
- 5.1.2. Viral Vector
- 5.1.3. Non-viral Vector
- 5.2. Market Analysis, Insights and Forecast - by Application
- 5.2.1. Cancer
- 5.2.2. Genetic Disorder
- 5.2.3. Infectious Disease
- 5.2.4. Other Applications
- 5.3. Market Analysis, Insights and Forecast - by Region
- 5.3.1. North America
- 5.3.2. Europe
- 5.3.3. Asia Pacific
- 5.3.4. Middle East and Africa
- 5.3.5. South America
- 5.1. Market Analysis, Insights and Forecast - by Product Type
- 6. North America Viral Vector and Plasmid DNA Manufacturing Market Analysis, Insights and Forecast, 2019-2031
- 6.1. Market Analysis, Insights and Forecast - by Product Type
- 6.1.1. Plasmid DNA
- 6.1.2. Viral Vector
- 6.1.3. Non-viral Vector
- 6.2. Market Analysis, Insights and Forecast - by Application
- 6.2.1. Cancer
- 6.2.2. Genetic Disorder
- 6.2.3. Infectious Disease
- 6.2.4. Other Applications
- 6.1. Market Analysis, Insights and Forecast - by Product Type
- 7. Europe Viral Vector and Plasmid DNA Manufacturing Market Analysis, Insights and Forecast, 2019-2031
- 7.1. Market Analysis, Insights and Forecast - by Product Type
- 7.1.1. Plasmid DNA
- 7.1.2. Viral Vector
- 7.1.3. Non-viral Vector
- 7.2. Market Analysis, Insights and Forecast - by Application
- 7.2.1. Cancer
- 7.2.2. Genetic Disorder
- 7.2.3. Infectious Disease
- 7.2.4. Other Applications
- 7.1. Market Analysis, Insights and Forecast - by Product Type
- 8. Asia Pacific Viral Vector and Plasmid DNA Manufacturing Market Analysis, Insights and Forecast, 2019-2031
- 8.1. Market Analysis, Insights and Forecast - by Product Type
- 8.1.1. Plasmid DNA
- 8.1.2. Viral Vector
- 8.1.3. Non-viral Vector
- 8.2. Market Analysis, Insights and Forecast - by Application
- 8.2.1. Cancer
- 8.2.2. Genetic Disorder
- 8.2.3. Infectious Disease
- 8.2.4. Other Applications
- 8.1. Market Analysis, Insights and Forecast - by Product Type
- 9. Middle East and Africa Viral Vector and Plasmid DNA Manufacturing Market Analysis, Insights and Forecast, 2019-2031
- 9.1. Market Analysis, Insights and Forecast - by Product Type
- 9.1.1. Plasmid DNA
- 9.1.2. Viral Vector
- 9.1.3. Non-viral Vector
- 9.2. Market Analysis, Insights and Forecast - by Application
- 9.2.1. Cancer
- 9.2.2. Genetic Disorder
- 9.2.3. Infectious Disease
- 9.2.4. Other Applications
- 9.1. Market Analysis, Insights and Forecast - by Product Type
- 10. South America Viral Vector and Plasmid DNA Manufacturing Market Analysis, Insights and Forecast, 2019-2031
- 10.1. Market Analysis, Insights and Forecast - by Product Type
- 10.1.1. Plasmid DNA
- 10.1.2. Viral Vector
- 10.1.3. Non-viral Vector
- 10.2. Market Analysis, Insights and Forecast - by Application
- 10.2.1. Cancer
- 10.2.2. Genetic Disorder
- 10.2.3. Infectious Disease
- 10.2.4. Other Applications
- 10.1. Market Analysis, Insights and Forecast - by Product Type
- 11. North America Viral Vector and Plasmid DNA Manufacturing Market Analysis, Insights and Forecast, 2019-2031
- 11.1. Market Analysis, Insights and Forecast - By Country/Sub-region
- 11.1.1 United States
- 11.1.2 Canada
- 11.1.3 Mexico
- 12. Europe Viral Vector and Plasmid DNA Manufacturing Market Analysis, Insights and Forecast, 2019-2031
- 12.1. Market Analysis, Insights and Forecast - By Country/Sub-region
- 12.1.1 United Kingdom
- 12.1.2 Germany
- 12.1.3 France
- 12.1.4 Italy
- 12.1.5 Spain
- 12.1.6 Rest of Europe
- 13. Asia Pacific Viral Vector and Plasmid DNA Manufacturing Market Analysis, Insights and Forecast, 2019-2031
- 13.1. Market Analysis, Insights and Forecast - By Country/Sub-region
- 13.1.1 China
- 13.1.2 Japan
- 13.1.3 India
- 13.1.4 Australia
- 13.1.5 South Korea
- 13.1.6 Rest of Asia Pacific
- 14. Middle East and Africa Viral Vector and Plasmid DNA Manufacturing Market Analysis, Insights and Forecast, 2019-2031
- 14.1. Market Analysis, Insights and Forecast - By Country/Sub-region
- 14.1.1 GCC
- 14.1.2 South Africa
- 14.1.3 Rest of Middle East and Africa
- 15. South America Viral Vector and Plasmid DNA Manufacturing Market Analysis, Insights and Forecast, 2019-2031
- 15.1. Market Analysis, Insights and Forecast - By Country/Sub-region
- 15.1.1 Brazil
- 15.1.2 Argentina
- 15.1.3 Rest of South America
- 16. Competitive Analysis
- 16.1. Global Market Share Analysis 2024
- 16.2. Company Profiles
- 16.2.1 Merck KGaA Inc
- 16.2.1.1. Overview
- 16.2.1.2. Products
- 16.2.1.3. SWOT Analysis
- 16.2.1.4. Recent Developments
- 16.2.1.5. Financials (Based on Availability)
- 16.2.2 Cell and Gene Therapy Catapult
- 16.2.2.1. Overview
- 16.2.2.2. Products
- 16.2.2.3. SWOT Analysis
- 16.2.2.4. Recent Developments
- 16.2.2.5. Financials (Based on Availability)
- 16.2.3 SIRION Biotech
- 16.2.3.1. Overview
- 16.2.3.2. Products
- 16.2.3.3. SWOT Analysis
- 16.2.3.4. Recent Developments
- 16.2.3.5. Financials (Based on Availability)
- 16.2.4 Cognate BioServices Inc (Cobra Biologics)
- 16.2.4.1. Overview
- 16.2.4.2. Products
- 16.2.4.3. SWOT Analysis
- 16.2.4.4. Recent Developments
- 16.2.4.5. Financials (Based on Availability)
- 16.2.5 Fujifilm Holdings Corporation (Fujifilm Diosynth Biotechnologies)
- 16.2.5.1. Overview
- 16.2.5.2. Products
- 16.2.5.3. SWOT Analysis
- 16.2.5.4. Recent Developments
- 16.2.5.5. Financials (Based on Availability)
- 16.2.6 MassBiologics
- 16.2.6.1. Overview
- 16.2.6.2. Products
- 16.2.6.3. SWOT Analysis
- 16.2.6.4. Recent Developments
- 16.2.6.5. Financials (Based on Availability)
- 16.2.7 Oxford Biomedica
- 16.2.7.1. Overview
- 16.2.7.2. Products
- 16.2.7.3. SWOT Analysis
- 16.2.7.4. Recent Developments
- 16.2.7.5. Financials (Based on Availability)
- 16.2.8 Uniqure NV
- 16.2.8.1. Overview
- 16.2.8.2. Products
- 16.2.8.3. SWOT Analysis
- 16.2.8.4. Recent Developments
- 16.2.8.5. Financials (Based on Availability)
- 16.2.9 Catalent Inc
- 16.2.9.1. Overview
- 16.2.9.2. Products
- 16.2.9.3. SWOT Analysis
- 16.2.9.4. Recent Developments
- 16.2.9.5. Financials (Based on Availability)
- 16.2.10 Thermo Fisher Scientific
- 16.2.10.1. Overview
- 16.2.10.2. Products
- 16.2.10.3. SWOT Analysis
- 16.2.10.4. Recent Developments
- 16.2.10.5. Financials (Based on Availability)
- 16.2.11 FinVector Vision Therapies
- 16.2.11.1. Overview
- 16.2.11.2. Products
- 16.2.11.3. SWOT Analysis
- 16.2.11.4. Recent Developments
- 16.2.11.5. Financials (Based on Availability)
- 16.2.1 Merck KGaA Inc
List of Figures
- Figure 1: Global Viral Vector and Plasmid DNA Manufacturing Market Revenue Breakdown (Million, %) by Region 2024 & 2032
- Figure 2: Global Viral Vector and Plasmid DNA Manufacturing Market Volume Breakdown (K Unit, %) by Region 2024 & 2032
- Figure 3: North America Viral Vector and Plasmid DNA Manufacturing Market Revenue (Million), by Country 2024 & 2032
- Figure 4: North America Viral Vector and Plasmid DNA Manufacturing Market Volume (K Unit), by Country 2024 & 2032
- Figure 5: North America Viral Vector and Plasmid DNA Manufacturing Market Revenue Share (%), by Country 2024 & 2032
- Figure 6: North America Viral Vector and Plasmid DNA Manufacturing Market Volume Share (%), by Country 2024 & 2032
- Figure 7: Europe Viral Vector and Plasmid DNA Manufacturing Market Revenue (Million), by Country 2024 & 2032
- Figure 8: Europe Viral Vector and Plasmid DNA Manufacturing Market Volume (K Unit), by Country 2024 & 2032
- Figure 9: Europe Viral Vector and Plasmid DNA Manufacturing Market Revenue Share (%), by Country 2024 & 2032
- Figure 10: Europe Viral Vector and Plasmid DNA Manufacturing Market Volume Share (%), by Country 2024 & 2032
- Figure 11: Asia Pacific Viral Vector and Plasmid DNA Manufacturing Market Revenue (Million), by Country 2024 & 2032
- Figure 12: Asia Pacific Viral Vector and Plasmid DNA Manufacturing Market Volume (K Unit), by Country 2024 & 2032
- Figure 13: Asia Pacific Viral Vector and Plasmid DNA Manufacturing Market Revenue Share (%), by Country 2024 & 2032
- Figure 14: Asia Pacific Viral Vector and Plasmid DNA Manufacturing Market Volume Share (%), by Country 2024 & 2032
- Figure 15: Middle East and Africa Viral Vector and Plasmid DNA Manufacturing Market Revenue (Million), by Country 2024 & 2032
- Figure 16: Middle East and Africa Viral Vector and Plasmid DNA Manufacturing Market Volume (K Unit), by Country 2024 & 2032
- Figure 17: Middle East and Africa Viral Vector and Plasmid DNA Manufacturing Market Revenue Share (%), by Country 2024 & 2032
- Figure 18: Middle East and Africa Viral Vector and Plasmid DNA Manufacturing Market Volume Share (%), by Country 2024 & 2032
- Figure 19: South America Viral Vector and Plasmid DNA Manufacturing Market Revenue (Million), by Country 2024 & 2032
- Figure 20: South America Viral Vector and Plasmid DNA Manufacturing Market Volume (K Unit), by Country 2024 & 2032
- Figure 21: South America Viral Vector and Plasmid DNA Manufacturing Market Revenue Share (%), by Country 2024 & 2032
- Figure 22: South America Viral Vector and Plasmid DNA Manufacturing Market Volume Share (%), by Country 2024 & 2032
- Figure 23: North America Viral Vector and Plasmid DNA Manufacturing Market Revenue (Million), by Product Type 2024 & 2032
- Figure 24: North America Viral Vector and Plasmid DNA Manufacturing Market Volume (K Unit), by Product Type 2024 & 2032
- Figure 25: North America Viral Vector and Plasmid DNA Manufacturing Market Revenue Share (%), by Product Type 2024 & 2032
- Figure 26: North America Viral Vector and Plasmid DNA Manufacturing Market Volume Share (%), by Product Type 2024 & 2032
- Figure 27: North America Viral Vector and Plasmid DNA Manufacturing Market Revenue (Million), by Application 2024 & 2032
- Figure 28: North America Viral Vector and Plasmid DNA Manufacturing Market Volume (K Unit), by Application 2024 & 2032
- Figure 29: North America Viral Vector and Plasmid DNA Manufacturing Market Revenue Share (%), by Application 2024 & 2032
- Figure 30: North America Viral Vector and Plasmid DNA Manufacturing Market Volume Share (%), by Application 2024 & 2032
- Figure 31: North America Viral Vector and Plasmid DNA Manufacturing Market Revenue (Million), by Country 2024 & 2032
- Figure 32: North America Viral Vector and Plasmid DNA Manufacturing Market Volume (K Unit), by Country 2024 & 2032
- Figure 33: North America Viral Vector and Plasmid DNA Manufacturing Market Revenue Share (%), by Country 2024 & 2032
- Figure 34: North America Viral Vector and Plasmid DNA Manufacturing Market Volume Share (%), by Country 2024 & 2032
- Figure 35: Europe Viral Vector and Plasmid DNA Manufacturing Market Revenue (Million), by Product Type 2024 & 2032
- Figure 36: Europe Viral Vector and Plasmid DNA Manufacturing Market Volume (K Unit), by Product Type 2024 & 2032
- Figure 37: Europe Viral Vector and Plasmid DNA Manufacturing Market Revenue Share (%), by Product Type 2024 & 2032
- Figure 38: Europe Viral Vector and Plasmid DNA Manufacturing Market Volume Share (%), by Product Type 2024 & 2032
- Figure 39: Europe Viral Vector and Plasmid DNA Manufacturing Market Revenue (Million), by Application 2024 & 2032
- Figure 40: Europe Viral Vector and Plasmid DNA Manufacturing Market Volume (K Unit), by Application 2024 & 2032
- Figure 41: Europe Viral Vector and Plasmid DNA Manufacturing Market Revenue Share (%), by Application 2024 & 2032
- Figure 42: Europe Viral Vector and Plasmid DNA Manufacturing Market Volume Share (%), by Application 2024 & 2032
- Figure 43: Europe Viral Vector and Plasmid DNA Manufacturing Market Revenue (Million), by Country 2024 & 2032
- Figure 44: Europe Viral Vector and Plasmid DNA Manufacturing Market Volume (K Unit), by Country 2024 & 2032
- Figure 45: Europe Viral Vector and Plasmid DNA Manufacturing Market Revenue Share (%), by Country 2024 & 2032
- Figure 46: Europe Viral Vector and Plasmid DNA Manufacturing Market Volume Share (%), by Country 2024 & 2032
- Figure 47: Asia Pacific Viral Vector and Plasmid DNA Manufacturing Market Revenue (Million), by Product Type 2024 & 2032
- Figure 48: Asia Pacific Viral Vector and Plasmid DNA Manufacturing Market Volume (K Unit), by Product Type 2024 & 2032
- Figure 49: Asia Pacific Viral Vector and Plasmid DNA Manufacturing Market Revenue Share (%), by Product Type 2024 & 2032
- Figure 50: Asia Pacific Viral Vector and Plasmid DNA Manufacturing Market Volume Share (%), by Product Type 2024 & 2032
- Figure 51: Asia Pacific Viral Vector and Plasmid DNA Manufacturing Market Revenue (Million), by Application 2024 & 2032
- Figure 52: Asia Pacific Viral Vector and Plasmid DNA Manufacturing Market Volume (K Unit), by Application 2024 & 2032
- Figure 53: Asia Pacific Viral Vector and Plasmid DNA Manufacturing Market Revenue Share (%), by Application 2024 & 2032
- Figure 54: Asia Pacific Viral Vector and Plasmid DNA Manufacturing Market Volume Share (%), by Application 2024 & 2032
- Figure 55: Asia Pacific Viral Vector and Plasmid DNA Manufacturing Market Revenue (Million), by Country 2024 & 2032
- Figure 56: Asia Pacific Viral Vector and Plasmid DNA Manufacturing Market Volume (K Unit), by Country 2024 & 2032
- Figure 57: Asia Pacific Viral Vector and Plasmid DNA Manufacturing Market Revenue Share (%), by Country 2024 & 2032
- Figure 58: Asia Pacific Viral Vector and Plasmid DNA Manufacturing Market Volume Share (%), by Country 2024 & 2032
- Figure 59: Middle East and Africa Viral Vector and Plasmid DNA Manufacturing Market Revenue (Million), by Product Type 2024 & 2032
- Figure 60: Middle East and Africa Viral Vector and Plasmid DNA Manufacturing Market Volume (K Unit), by Product Type 2024 & 2032
- Figure 61: Middle East and Africa Viral Vector and Plasmid DNA Manufacturing Market Revenue Share (%), by Product Type 2024 & 2032
- Figure 62: Middle East and Africa Viral Vector and Plasmid DNA Manufacturing Market Volume Share (%), by Product Type 2024 & 2032
- Figure 63: Middle East and Africa Viral Vector and Plasmid DNA Manufacturing Market Revenue (Million), by Application 2024 & 2032
- Figure 64: Middle East and Africa Viral Vector and Plasmid DNA Manufacturing Market Volume (K Unit), by Application 2024 & 2032
- Figure 65: Middle East and Africa Viral Vector and Plasmid DNA Manufacturing Market Revenue Share (%), by Application 2024 & 2032
- Figure 66: Middle East and Africa Viral Vector and Plasmid DNA Manufacturing Market Volume Share (%), by Application 2024 & 2032
- Figure 67: Middle East and Africa Viral Vector and Plasmid DNA Manufacturing Market Revenue (Million), by Country 2024 & 2032
- Figure 68: Middle East and Africa Viral Vector and Plasmid DNA Manufacturing Market Volume (K Unit), by Country 2024 & 2032
- Figure 69: Middle East and Africa Viral Vector and Plasmid DNA Manufacturing Market Revenue Share (%), by Country 2024 & 2032
- Figure 70: Middle East and Africa Viral Vector and Plasmid DNA Manufacturing Market Volume Share (%), by Country 2024 & 2032
- Figure 71: South America Viral Vector and Plasmid DNA Manufacturing Market Revenue (Million), by Product Type 2024 & 2032
- Figure 72: South America Viral Vector and Plasmid DNA Manufacturing Market Volume (K Unit), by Product Type 2024 & 2032
- Figure 73: South America Viral Vector and Plasmid DNA Manufacturing Market Revenue Share (%), by Product Type 2024 & 2032
- Figure 74: South America Viral Vector and Plasmid DNA Manufacturing Market Volume Share (%), by Product Type 2024 & 2032
- Figure 75: South America Viral Vector and Plasmid DNA Manufacturing Market Revenue (Million), by Application 2024 & 2032
- Figure 76: South America Viral Vector and Plasmid DNA Manufacturing Market Volume (K Unit), by Application 2024 & 2032
- Figure 77: South America Viral Vector and Plasmid DNA Manufacturing Market Revenue Share (%), by Application 2024 & 2032
- Figure 78: South America Viral Vector and Plasmid DNA Manufacturing Market Volume Share (%), by Application 2024 & 2032
- Figure 79: South America Viral Vector and Plasmid DNA Manufacturing Market Revenue (Million), by Country 2024 & 2032
- Figure 80: South America Viral Vector and Plasmid DNA Manufacturing Market Volume (K Unit), by Country 2024 & 2032
- Figure 81: South America Viral Vector and Plasmid DNA Manufacturing Market Revenue Share (%), by Country 2024 & 2032
- Figure 82: South America Viral Vector and Plasmid DNA Manufacturing Market Volume Share (%), by Country 2024 & 2032
List of Tables
- Table 1: Global Viral Vector and Plasmid DNA Manufacturing Market Revenue Million Forecast, by Region 2019 & 2032
- Table 2: Global Viral Vector and Plasmid DNA Manufacturing Market Volume K Unit Forecast, by Region 2019 & 2032
- Table 3: Global Viral Vector and Plasmid DNA Manufacturing Market Revenue Million Forecast, by Product Type 2019 & 2032
- Table 4: Global Viral Vector and Plasmid DNA Manufacturing Market Volume K Unit Forecast, by Product Type 2019 & 2032
- Table 5: Global Viral Vector and Plasmid DNA Manufacturing Market Revenue Million Forecast, by Application 2019 & 2032
- Table 6: Global Viral Vector and Plasmid DNA Manufacturing Market Volume K Unit Forecast, by Application 2019 & 2032
- Table 7: Global Viral Vector and Plasmid DNA Manufacturing Market Revenue Million Forecast, by Region 2019 & 2032
- Table 8: Global Viral Vector and Plasmid DNA Manufacturing Market Volume K Unit Forecast, by Region 2019 & 2032
- Table 9: Global Viral Vector and Plasmid DNA Manufacturing Market Revenue Million Forecast, by Country 2019 & 2032
- Table 10: Global Viral Vector and Plasmid DNA Manufacturing Market Volume K Unit Forecast, by Country 2019 & 2032
- Table 11: United States Viral Vector and Plasmid DNA Manufacturing Market Revenue (Million) Forecast, by Application 2019 & 2032
- Table 12: United States Viral Vector and Plasmid DNA Manufacturing Market Volume (K Unit) Forecast, by Application 2019 & 2032
- Table 13: Canada Viral Vector and Plasmid DNA Manufacturing Market Revenue (Million) Forecast, by Application 2019 & 2032
- Table 14: Canada Viral Vector and Plasmid DNA Manufacturing Market Volume (K Unit) Forecast, by Application 2019 & 2032
- Table 15: Mexico Viral Vector and Plasmid DNA Manufacturing Market Revenue (Million) Forecast, by Application 2019 & 2032
- Table 16: Mexico Viral Vector and Plasmid DNA Manufacturing Market Volume (K Unit) Forecast, by Application 2019 & 2032
- Table 17: Global Viral Vector and Plasmid DNA Manufacturing Market Revenue Million Forecast, by Country 2019 & 2032
- Table 18: Global Viral Vector and Plasmid DNA Manufacturing Market Volume K Unit Forecast, by Country 2019 & 2032
- Table 19: United Kingdom Viral Vector and Plasmid DNA Manufacturing Market Revenue (Million) Forecast, by Application 2019 & 2032
- Table 20: United Kingdom Viral Vector and Plasmid DNA Manufacturing Market Volume (K Unit) Forecast, by Application 2019 & 2032
- Table 21: Germany Viral Vector and Plasmid DNA Manufacturing Market Revenue (Million) Forecast, by Application 2019 & 2032
- Table 22: Germany Viral Vector and Plasmid DNA Manufacturing Market Volume (K Unit) Forecast, by Application 2019 & 2032
- Table 23: France Viral Vector and Plasmid DNA Manufacturing Market Revenue (Million) Forecast, by Application 2019 & 2032
- Table 24: France Viral Vector and Plasmid DNA Manufacturing Market Volume (K Unit) Forecast, by Application 2019 & 2032
- Table 25: Italy Viral Vector and Plasmid DNA Manufacturing Market Revenue (Million) Forecast, by Application 2019 & 2032
- Table 26: Italy Viral Vector and Plasmid DNA Manufacturing Market Volume (K Unit) Forecast, by Application 2019 & 2032
- Table 27: Spain Viral Vector and Plasmid DNA Manufacturing Market Revenue (Million) Forecast, by Application 2019 & 2032
- Table 28: Spain Viral Vector and Plasmid DNA Manufacturing Market Volume (K Unit) Forecast, by Application 2019 & 2032
- Table 29: Rest of Europe Viral Vector and Plasmid DNA Manufacturing Market Revenue (Million) Forecast, by Application 2019 & 2032
- Table 30: Rest of Europe Viral Vector and Plasmid DNA Manufacturing Market Volume (K Unit) Forecast, by Application 2019 & 2032
- Table 31: Global Viral Vector and Plasmid DNA Manufacturing Market Revenue Million Forecast, by Country 2019 & 2032
- Table 32: Global Viral Vector and Plasmid DNA Manufacturing Market Volume K Unit Forecast, by Country 2019 & 2032
- Table 33: China Viral Vector and Plasmid DNA Manufacturing Market Revenue (Million) Forecast, by Application 2019 & 2032
- Table 34: China Viral Vector and Plasmid DNA Manufacturing Market Volume (K Unit) Forecast, by Application 2019 & 2032
- Table 35: Japan Viral Vector and Plasmid DNA Manufacturing Market Revenue (Million) Forecast, by Application 2019 & 2032
- Table 36: Japan Viral Vector and Plasmid DNA Manufacturing Market Volume (K Unit) Forecast, by Application 2019 & 2032
- Table 37: India Viral Vector and Plasmid DNA Manufacturing Market Revenue (Million) Forecast, by Application 2019 & 2032
- Table 38: India Viral Vector and Plasmid DNA Manufacturing Market Volume (K Unit) Forecast, by Application 2019 & 2032
- Table 39: Australia Viral Vector and Plasmid DNA Manufacturing Market Revenue (Million) Forecast, by Application 2019 & 2032
- Table 40: Australia Viral Vector and Plasmid DNA Manufacturing Market Volume (K Unit) Forecast, by Application 2019 & 2032
- Table 41: South Korea Viral Vector and Plasmid DNA Manufacturing Market Revenue (Million) Forecast, by Application 2019 & 2032
- Table 42: South Korea Viral Vector and Plasmid DNA Manufacturing Market Volume (K Unit) Forecast, by Application 2019 & 2032
- Table 43: Rest of Asia Pacific Viral Vector and Plasmid DNA Manufacturing Market Revenue (Million) Forecast, by Application 2019 & 2032
- Table 44: Rest of Asia Pacific Viral Vector and Plasmid DNA Manufacturing Market Volume (K Unit) Forecast, by Application 2019 & 2032
- Table 45: Global Viral Vector and Plasmid DNA Manufacturing Market Revenue Million Forecast, by Country 2019 & 2032
- Table 46: Global Viral Vector and Plasmid DNA Manufacturing Market Volume K Unit Forecast, by Country 2019 & 2032
- Table 47: GCC Viral Vector and Plasmid DNA Manufacturing Market Revenue (Million) Forecast, by Application 2019 & 2032
- Table 48: GCC Viral Vector and Plasmid DNA Manufacturing Market Volume (K Unit) Forecast, by Application 2019 & 2032
- Table 49: South Africa Viral Vector and Plasmid DNA Manufacturing Market Revenue (Million) Forecast, by Application 2019 & 2032
- Table 50: South Africa Viral Vector and Plasmid DNA Manufacturing Market Volume (K Unit) Forecast, by Application 2019 & 2032
- Table 51: Rest of Middle East and Africa Viral Vector and Plasmid DNA Manufacturing Market Revenue (Million) Forecast, by Application 2019 & 2032
- Table 52: Rest of Middle East and Africa Viral Vector and Plasmid DNA Manufacturing Market Volume (K Unit) Forecast, by Application 2019 & 2032
- Table 53: Global Viral Vector and Plasmid DNA Manufacturing Market Revenue Million Forecast, by Country 2019 & 2032
- Table 54: Global Viral Vector and Plasmid DNA Manufacturing Market Volume K Unit Forecast, by Country 2019 & 2032
- Table 55: Brazil Viral Vector and Plasmid DNA Manufacturing Market Revenue (Million) Forecast, by Application 2019 & 2032
- Table 56: Brazil Viral Vector and Plasmid DNA Manufacturing Market Volume (K Unit) Forecast, by Application 2019 & 2032
- Table 57: Argentina Viral Vector and Plasmid DNA Manufacturing Market Revenue (Million) Forecast, by Application 2019 & 2032
- Table 58: Argentina Viral Vector and Plasmid DNA Manufacturing Market Volume (K Unit) Forecast, by Application 2019 & 2032
- Table 59: Rest of South America Viral Vector and Plasmid DNA Manufacturing Market Revenue (Million) Forecast, by Application 2019 & 2032
- Table 60: Rest of South America Viral Vector and Plasmid DNA Manufacturing Market Volume (K Unit) Forecast, by Application 2019 & 2032
- Table 61: Global Viral Vector and Plasmid DNA Manufacturing Market Revenue Million Forecast, by Product Type 2019 & 2032
- Table 62: Global Viral Vector and Plasmid DNA Manufacturing Market Volume K Unit Forecast, by Product Type 2019 & 2032
- Table 63: Global Viral Vector and Plasmid DNA Manufacturing Market Revenue Million Forecast, by Application 2019 & 2032
- Table 64: Global Viral Vector and Plasmid DNA Manufacturing Market Volume K Unit Forecast, by Application 2019 & 2032
- Table 65: Global Viral Vector and Plasmid DNA Manufacturing Market Revenue Million Forecast, by Country 2019 & 2032
- Table 66: Global Viral Vector and Plasmid DNA Manufacturing Market Volume K Unit Forecast, by Country 2019 & 2032
- Table 67: United States Viral Vector and Plasmid DNA Manufacturing Market Revenue (Million) Forecast, by Application 2019 & 2032
- Table 68: United States Viral Vector and Plasmid DNA Manufacturing Market Volume (K Unit) Forecast, by Application 2019 & 2032
- Table 69: Canada Viral Vector and Plasmid DNA Manufacturing Market Revenue (Million) Forecast, by Application 2019 & 2032
- Table 70: Canada Viral Vector and Plasmid DNA Manufacturing Market Volume (K Unit) Forecast, by Application 2019 & 2032
- Table 71: Mexico Viral Vector and Plasmid DNA Manufacturing Market Revenue (Million) Forecast, by Application 2019 & 2032
- Table 72: Mexico Viral Vector and Plasmid DNA Manufacturing Market Volume (K Unit) Forecast, by Application 2019 & 2032
- Table 73: Global Viral Vector and Plasmid DNA Manufacturing Market Revenue Million Forecast, by Product Type 2019 & 2032
- Table 74: Global Viral Vector and Plasmid DNA Manufacturing Market Volume K Unit Forecast, by Product Type 2019 & 2032
- Table 75: Global Viral Vector and Plasmid DNA Manufacturing Market Revenue Million Forecast, by Application 2019 & 2032
- Table 76: Global Viral Vector and Plasmid DNA Manufacturing Market Volume K Unit Forecast, by Application 2019 & 2032
- Table 77: Global Viral Vector and Plasmid DNA Manufacturing Market Revenue Million Forecast, by Country 2019 & 2032
- Table 78: Global Viral Vector and Plasmid DNA Manufacturing Market Volume K Unit Forecast, by Country 2019 & 2032
- Table 79: United Kingdom Viral Vector and Plasmid DNA Manufacturing Market Revenue (Million) Forecast, by Application 2019 & 2032
- Table 80: United Kingdom Viral Vector and Plasmid DNA Manufacturing Market Volume (K Unit) Forecast, by Application 2019 & 2032
- Table 81: Germany Viral Vector and Plasmid DNA Manufacturing Market Revenue (Million) Forecast, by Application 2019 & 2032
- Table 82: Germany Viral Vector and Plasmid DNA Manufacturing Market Volume (K Unit) Forecast, by Application 2019 & 2032
- Table 83: France Viral Vector and Plasmid DNA Manufacturing Market Revenue (Million) Forecast, by Application 2019 & 2032
- Table 84: France Viral Vector and Plasmid DNA Manufacturing Market Volume (K Unit) Forecast, by Application 2019 & 2032
- Table 85: Italy Viral Vector and Plasmid DNA Manufacturing Market Revenue (Million) Forecast, by Application 2019 & 2032
- Table 86: Italy Viral Vector and Plasmid DNA Manufacturing Market Volume (K Unit) Forecast, by Application 2019 & 2032
- Table 87: Spain Viral Vector and Plasmid DNA Manufacturing Market Revenue (Million) Forecast, by Application 2019 & 2032
- Table 88: Spain Viral Vector and Plasmid DNA Manufacturing Market Volume (K Unit) Forecast, by Application 2019 & 2032
- Table 89: Rest of Europe Viral Vector and Plasmid DNA Manufacturing Market Revenue (Million) Forecast, by Application 2019 & 2032
- Table 90: Rest of Europe Viral Vector and Plasmid DNA Manufacturing Market Volume (K Unit) Forecast, by Application 2019 & 2032
- Table 91: Global Viral Vector and Plasmid DNA Manufacturing Market Revenue Million Forecast, by Product Type 2019 & 2032
- Table 92: Global Viral Vector and Plasmid DNA Manufacturing Market Volume K Unit Forecast, by Product Type 2019 & 2032
- Table 93: Global Viral Vector and Plasmid DNA Manufacturing Market Revenue Million Forecast, by Application 2019 & 2032
- Table 94: Global Viral Vector and Plasmid DNA Manufacturing Market Volume K Unit Forecast, by Application 2019 & 2032
- Table 95: Global Viral Vector and Plasmid DNA Manufacturing Market Revenue Million Forecast, by Country 2019 & 2032
- Table 96: Global Viral Vector and Plasmid DNA Manufacturing Market Volume K Unit Forecast, by Country 2019 & 2032
- Table 97: China Viral Vector and Plasmid DNA Manufacturing Market Revenue (Million) Forecast, by Application 2019 & 2032
- Table 98: China Viral Vector and Plasmid DNA Manufacturing Market Volume (K Unit) Forecast, by Application 2019 & 2032
- Table 99: Japan Viral Vector and Plasmid DNA Manufacturing Market Revenue (Million) Forecast, by Application 2019 & 2032
- Table 100: Japan Viral Vector and Plasmid DNA Manufacturing Market Volume (K Unit) Forecast, by Application 2019 & 2032
- Table 101: India Viral Vector and Plasmid DNA Manufacturing Market Revenue (Million) Forecast, by Application 2019 & 2032
- Table 102: India Viral Vector and Plasmid DNA Manufacturing Market Volume (K Unit) Forecast, by Application 2019 & 2032
- Table 103: Australia Viral Vector and Plasmid DNA Manufacturing Market Revenue (Million) Forecast, by Application 2019 & 2032
- Table 104: Australia Viral Vector and Plasmid DNA Manufacturing Market Volume (K Unit) Forecast, by Application 2019 & 2032
- Table 105: South Korea Viral Vector and Plasmid DNA Manufacturing Market Revenue (Million) Forecast, by Application 2019 & 2032
- Table 106: South Korea Viral Vector and Plasmid DNA Manufacturing Market Volume (K Unit) Forecast, by Application 2019 & 2032
- Table 107: Rest of Asia Pacific Viral Vector and Plasmid DNA Manufacturing Market Revenue (Million) Forecast, by Application 2019 & 2032
- Table 108: Rest of Asia Pacific Viral Vector and Plasmid DNA Manufacturing Market Volume (K Unit) Forecast, by Application 2019 & 2032
- Table 109: Global Viral Vector and Plasmid DNA Manufacturing Market Revenue Million Forecast, by Product Type 2019 & 2032
- Table 110: Global Viral Vector and Plasmid DNA Manufacturing Market Volume K Unit Forecast, by Product Type 2019 & 2032
- Table 111: Global Viral Vector and Plasmid DNA Manufacturing Market Revenue Million Forecast, by Application 2019 & 2032
- Table 112: Global Viral Vector and Plasmid DNA Manufacturing Market Volume K Unit Forecast, by Application 2019 & 2032
- Table 113: Global Viral Vector and Plasmid DNA Manufacturing Market Revenue Million Forecast, by Country 2019 & 2032
- Table 114: Global Viral Vector and Plasmid DNA Manufacturing Market Volume K Unit Forecast, by Country 2019 & 2032
- Table 115: GCC Viral Vector and Plasmid DNA Manufacturing Market Revenue (Million) Forecast, by Application 2019 & 2032
- Table 116: GCC Viral Vector and Plasmid DNA Manufacturing Market Volume (K Unit) Forecast, by Application 2019 & 2032
- Table 117: South Africa Viral Vector and Plasmid DNA Manufacturing Market Revenue (Million) Forecast, by Application 2019 & 2032
- Table 118: South Africa Viral Vector and Plasmid DNA Manufacturing Market Volume (K Unit) Forecast, by Application 2019 & 2032
- Table 119: Rest of Middle East and Africa Viral Vector and Plasmid DNA Manufacturing Market Revenue (Million) Forecast, by Application 2019 & 2032
- Table 120: Rest of Middle East and Africa Viral Vector and Plasmid DNA Manufacturing Market Volume (K Unit) Forecast, by Application 2019 & 2032
- Table 121: Global Viral Vector and Plasmid DNA Manufacturing Market Revenue Million Forecast, by Product Type 2019 & 2032
- Table 122: Global Viral Vector and Plasmid DNA Manufacturing Market Volume K Unit Forecast, by Product Type 2019 & 2032
- Table 123: Global Viral Vector and Plasmid DNA Manufacturing Market Revenue Million Forecast, by Application 2019 & 2032
- Table 124: Global Viral Vector and Plasmid DNA Manufacturing Market Volume K Unit Forecast, by Application 2019 & 2032
- Table 125: Global Viral Vector and Plasmid DNA Manufacturing Market Revenue Million Forecast, by Country 2019 & 2032
- Table 126: Global Viral Vector and Plasmid DNA Manufacturing Market Volume K Unit Forecast, by Country 2019 & 2032
- Table 127: Brazil Viral Vector and Plasmid DNA Manufacturing Market Revenue (Million) Forecast, by Application 2019 & 2032
- Table 128: Brazil Viral Vector and Plasmid DNA Manufacturing Market Volume (K Unit) Forecast, by Application 2019 & 2032
- Table 129: Argentina Viral Vector and Plasmid DNA Manufacturing Market Revenue (Million) Forecast, by Application 2019 & 2032
- Table 130: Argentina Viral Vector and Plasmid DNA Manufacturing Market Volume (K Unit) Forecast, by Application 2019 & 2032
- Table 131: Rest of South America Viral Vector and Plasmid DNA Manufacturing Market Revenue (Million) Forecast, by Application 2019 & 2032
- Table 132: Rest of South America Viral Vector and Plasmid DNA Manufacturing Market Volume (K Unit) Forecast, by Application 2019 & 2032
Frequently Asked Questions
1. What is the projected Compound Annual Growth Rate (CAGR) of the Viral Vector and Plasmid DNA Manufacturing Market?
The projected CAGR is approximately 27.18%.
2. Which companies are prominent players in the Viral Vector and Plasmid DNA Manufacturing Market?
Key companies in the market include Merck KGaA Inc, Cell and Gene Therapy Catapult, SIRION Biotech, Cognate BioServices Inc (Cobra Biologics), Fujifilm Holdings Corporation (Fujifilm Diosynth Biotechnologies), MassBiologics, Oxford Biomedica, Uniqure NV, Catalent Inc, Thermo Fisher Scientific, FinVector Vision Therapies.
3. What are the main segments of the Viral Vector and Plasmid DNA Manufacturing Market?
The market segments include Product Type, Application.
4. Can you provide details about the market size?
The market size is estimated to be USD 1.82 Million as of 2022.
5. What are some drivers contributing to market growth?
Rising Prevalence of Genetic Disorders. Cancer. and Infectious Diseases; Increasing Number of Clinical Studies and Availability of Funding for Gene Therapy Development; Potential Applications in Novel Drug Delivery Approaches.
6. What are the notable trends driving market growth?
By Application. Cancer Segment is Expected to Register Robust Growth..
7. Are there any restraints impacting market growth?
High Cost of Gene Therapies; Challenges in Viral Vector Manufacturing Capacity.
8. Can you provide examples of recent developments in the market?
In July 2021, the company Thermo Fisher Scientific Inc. announced the launch of new cGMP plasmid DNA manufacturing facility in Carlsbad, Calif which will full fill the growing demand of plasmid DNA-based therapies and vital mRNA-based vaccines.
9. What pricing options are available for accessing the report?
Pricing options include single-user, multi-user, and enterprise licenses priced at USD 4750, USD 5250, and USD 8750 respectively.
10. Is the market size provided in terms of value or volume?
The market size is provided in terms of value, measured in Million and volume, measured in K Unit.
11. Are there any specific market keywords associated with the report?
Yes, the market keyword associated with the report is "Viral Vector and Plasmid DNA Manufacturing Market," which aids in identifying and referencing the specific market segment covered.
12. How do I determine which pricing option suits my needs best?
The pricing options vary based on user requirements and access needs. Individual users may opt for single-user licenses, while businesses requiring broader access may choose multi-user or enterprise licenses for cost-effective access to the report.
13. Are there any additional resources or data provided in the Viral Vector and Plasmid DNA Manufacturing Market report?
While the report offers comprehensive insights, it's advisable to review the specific contents or supplementary materials provided to ascertain if additional resources or data are available.
14. How can I stay updated on further developments or reports in the Viral Vector and Plasmid DNA Manufacturing Market?
To stay informed about further developments, trends, and reports in the Viral Vector and Plasmid DNA Manufacturing Market, consider subscribing to industry newsletters, following relevant companies and organizations, or regularly checking reputable industry news sources and publications.
Methodology
Step 1 - Identification of Relevant Samples Size from Population Database


Step 2 - Approaches for Defining Global Market Size (Value, Volume* & Price*)

Note*: In applicable scenarios
Step 3 - Data Sources
Primary Research
- Web Analytics
- Survey Reports
- Research Institute
- Latest Research Reports
- Opinion Leaders
Secondary Research
- Annual Reports
- White Paper
- Latest Press Release
- Industry Association
- Paid Database
- Investor Presentations

Step 4 - Data Triangulation
Involves using different sources of information in order to increase the validity of a study
These sources are likely to be stakeholders in a program - participants, other researchers, program staff, other community members, and so on.
Then we put all data in single framework & apply various statistical tools to find out the dynamic on the market.
During the analysis stage, feedback from the stakeholder groups would be compared to determine areas of agreement as well as areas of divergence


