
Key Insights
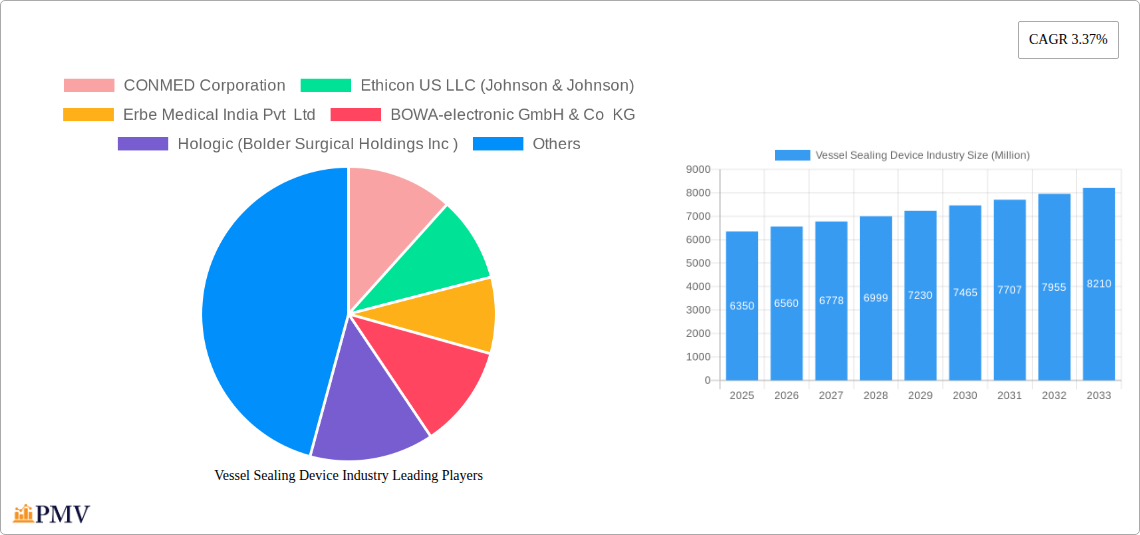
The global vessel sealing device market, valued at $6.35 billion in 2025, is projected to experience steady growth, driven by several key factors. The increasing prevalence of minimally invasive surgical procedures, particularly laparoscopic surgeries, is a major catalyst. These procedures demand precise and efficient sealing of blood vessels, leading to increased demand for advanced vessel sealing devices. Technological advancements, such as the development of more sophisticated energy sources and improved device designs (e.g., smaller, more maneuverable devices), are further fueling market expansion. The rising geriatric population, susceptible to various vascular conditions requiring surgical intervention, also contributes to market growth. Growth is further supported by the expanding number of ambulatory surgical centers and the increasing adoption of these devices in developing economies. However, the market faces certain restraints, including the high cost of these devices, the potential for complications such as tissue injury, and the availability of alternative surgical techniques. The market is segmented by product type (generators, instruments, accessories), application (general surgery, laparoscopic surgery), and end-user (hospitals, specialty clinics, ambulatory surgical centers). Key players, including CONMED Corporation, Ethicon US LLC, Erbe Medical, and Medtronic, are actively engaged in research and development to maintain their competitive edge and cater to the evolving needs of the surgical community.
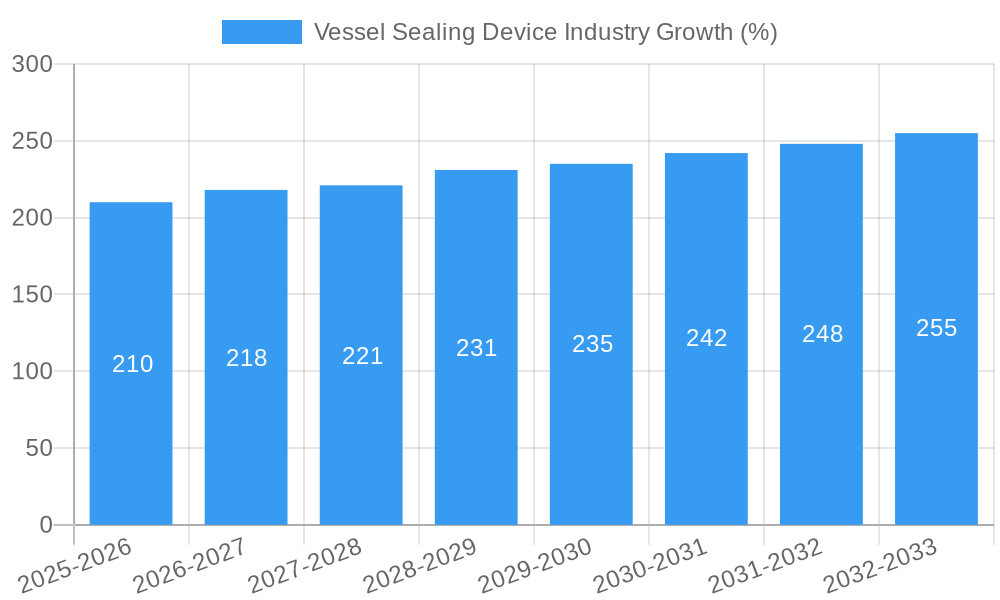
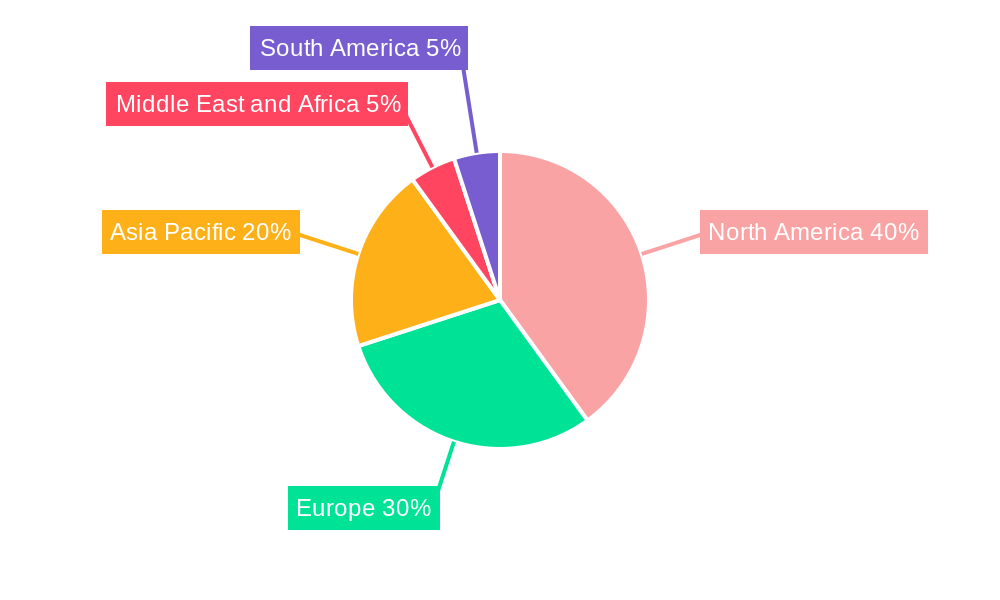
The competitive landscape is characterized by the presence of both established industry giants and innovative smaller players. This dynamic market structure fosters innovation and competition, driving the development of improved technologies and creating opportunities for market expansion. Geographic segmentation reveals significant growth potential in regions such as Asia-Pacific, fueled by increasing healthcare infrastructure development and rising disposable incomes. North America and Europe currently hold substantial market shares but are expected to experience moderate growth compared to developing regions, although still showing a positive growth trajectory. The forecast period (2025-2033) anticipates consistent growth, with the CAGR of 3.37% suggesting a relatively stable and expanding market, especially considering the expected technological advancements and expanding surgical procedures globally.
Vessel Sealing Device Industry: A Comprehensive Market Report (2019-2033)
This detailed report provides a comprehensive analysis of the global Vessel Sealing Device industry, covering market size, segmentation, competitive landscape, key trends, and future growth prospects from 2019 to 2033. The report utilizes a robust methodology, incorporating both historical data (2019-2024) and future projections (2025-2033), with 2025 serving as the base year and estimated year. The report is invaluable for industry stakeholders, investors, and researchers seeking actionable insights into this dynamic market.
Vessel Sealing Device Industry Market Structure & Competitive Dynamics
The global vessel sealing device market is moderately concentrated, with several key players holding significant market share. The competitive landscape is characterized by intense innovation, strategic mergers and acquisitions (M&A), and the continuous development of advanced technologies. Regulatory frameworks, particularly those related to medical device approval and safety, heavily influence market dynamics. Product substitutes, while limited, include traditional surgical techniques, which are increasingly being replaced due to the superior precision and efficiency offered by vessel sealing devices. End-user trends point towards a growing preference for minimally invasive procedures, fueling the demand for advanced vessel sealing technologies.
Key metrics include:
- Market Concentration: xx% held by the top 5 players (estimated).
- M&A Activity: Significant activity observed, including Hologic Inc.'s USD 160 Million acquisition of Bolder Surgical in October 2021. Other deals totaled an estimated xx Million USD during the study period.
- Innovation Ecosystem: Characterized by collaborations between device manufacturers, research institutions, and healthcare providers, driving continuous improvements in device design and functionality.
Vessel Sealing Device Industry Industry Trends & Insights
The global vessel sealing device market is experiencing robust growth, driven by several key factors. The rising prevalence of chronic diseases requiring surgical interventions, coupled with the increasing adoption of minimally invasive surgical techniques (MIS), is a primary growth driver. Technological advancements, such as the development of bipolar and ultrasonic vessel sealing devices offering enhanced precision and reduced complications, are further accelerating market expansion. Consumer preferences are increasingly shifting towards less invasive procedures with faster recovery times, creating a favorable environment for vessel sealing device adoption. The competitive landscape is dynamic, with continuous product innovation and strategic partnerships shaping market dynamics.
Key metrics:
- CAGR (2025-2033): xx% (projected)
- Market Penetration: xx% in developed markets, with significant growth potential in emerging economies.
Dominant Markets & Segments in Vessel Sealing Device Industry
The North American market currently holds the dominant position in the global vessel sealing device market, followed by Europe. Within the product segment, generators command the largest market share, followed by instruments and accessories. In terms of application, general surgery and laparoscopic surgery represent the largest segments. Hospitals and specialty clinics are the key end-users, followed by ambulatory surgical centers.
- Key Drivers for North American Dominance:
- Strong healthcare infrastructure and investment.
- High adoption rates of minimally invasive surgeries.
- Favorable regulatory environment.
- Key Drivers for European Market:
- Growing demand for advanced surgical technologies.
- Increasing prevalence of chronic diseases.
- Investments in healthcare infrastructure.
Vessel Sealing Device Industry Product Innovations
Recent product innovations have focused on improving precision, reducing complications, and enhancing ease of use. This includes the development of smaller, more ergonomic instruments, improved energy delivery systems, and integrated visualization capabilities. The launch of new platforms like Bolder Surgical's CoolSeal system showcases the ongoing commitment to improving the safety and efficacy of vessel sealing technologies. These advancements are well-aligned with the market's growing preference for minimally invasive techniques and improved patient outcomes.
Report Segmentation & Scope
This report segments the vessel sealing device market by product (Generators, Instruments, Accessories), application (General Surgery, Laparoscopic Surgery), and end-user (Hospitals and Specialty Clinics, Ambulatory Surgical Centers). Each segment's growth projection, market size, and competitive dynamics are thoroughly analyzed. Growth in the instruments and accessories segments is expected to be significantly influenced by the overall growth in the generator segment. The laparoscopic surgery application is anticipated to register high growth due to its minimally invasive nature. Growth in the ambulatory surgical centers segment is expected to be driven by rising preference for outpatient procedures.
Key Drivers of Vessel Sealing Device Industry Growth
Technological advancements in energy delivery systems, improved instrument design, and integrated imaging capabilities are major growth drivers. The rising prevalence of chronic diseases necessitates more surgical procedures, boosting demand. Favorable regulatory environments in key markets facilitate faster product approvals and market penetration. Furthermore, increasing investments in healthcare infrastructure and the rising adoption of minimally invasive surgical techniques significantly contribute to market expansion.
Challenges in the Vessel Sealing Device Industry Sector
Stringent regulatory approvals and compliance requirements can pose significant challenges. Supply chain disruptions and fluctuations in raw material costs can impact profitability. Intense competition from established players and emerging companies necessitates continuous innovation and strategic partnerships. Pricing pressure from healthcare providers also presents a challenge. These factors can result in an estimated xx% reduction in overall profit margin for some companies.
Leading Players in the Vessel Sealing Device Industry Market
- CONMED Corporation
- Ethicon US LLC (Johnson & Johnson)
- Erbe Medical India Pvt Ltd
- BOWA-electronic GmbH & Co KG
- Hologic (Bolder Surgical Holdings Inc)
- Medtronic PLC
- LAMIDEY NOURY FR
- OmniGuide Holdings Inc
- B Braun Melsungen AG
- Boston Scientific Corporation
- XCELLANCE Medical Technologies
- Olympus Corporation
Key Developments in Vessel Sealing Device Industry Sector
- October 2021: Hologic Inc. acquired Bolder Surgical for USD 160 Million.
- September 2021: Bolder Surgical launched its CoolSeal Vessel Sealing platform, gaining international regulatory approvals and expanding its reach to over 20 countries.
Strategic Vessel Sealing Device Industry Market Outlook
The future of the vessel sealing device market is promising, with continued growth fueled by technological advancements, increasing demand for minimally invasive procedures, and expansion into emerging markets. Strategic partnerships, product diversification, and investments in research and development will be crucial for maintaining a competitive edge. Focusing on developing innovative, cost-effective solutions that address the specific needs of various surgical specialties will be key to capitalizing on future market opportunities. The market is poised for significant expansion, with projected growth rates exceeding xx% in several key segments over the next decade.
Vessel Sealing Device Industry Segmentation
-
1. Product
- 1.1. Generators
- 1.2. Instruments
- 1.3. Accessories
-
2. Application
- 2.1. General Surgery
- 2.2. Laparoscopic Surgery
-
3. End User
- 3.1. Hospitals and Specialty Clinics
- 3.2. Ambulatory Surgical Centers
Vessel Sealing Device Industry Segmentation By Geography
-
1. North America
- 1.1. United States
- 1.2. Canada
- 1.3. Mexico
-
2. Europe
- 2.1. Germany
- 2.2. United Kingdom
- 2.3. France
- 2.4. Italy
- 2.5. Spain
- 2.6. Rest of Europe
-
3. Asia Pacific
- 3.1. China
- 3.2. Japan
- 3.3. India
- 3.4. Australia
- 3.5. South Korea
- 3.6. Rest of Asia Pacific
-
4. Middle East and Africa
- 4.1. GCC
- 4.2. South Africa
- 4.3. Rest of Middle East and Africa
-
5. South America
- 5.1. Brazil
- 5.2. Argentina
- 5.3. Rest of South America
Vessel Sealing Device Industry REPORT HIGHLIGHTS
| Aspects | Details |
|---|---|
| Study Period | 2019-2033 |
| Base Year | 2024 |
| Estimated Year | 2025 |
| Forecast Period | 2025-2033 |
| Historical Period | 2019-2024 |
| Growth Rate | CAGR of 3.37% from 2019-2033 |
| Segmentation |
|
Table of Contents
- 1. Introduction
- 1.1. Research Scope
- 1.2. Market Segmentation
- 1.3. Research Methodology
- 1.4. Definitions and Assumptions
- 2. Executive Summary
- 2.1. Introduction
- 3. Market Dynamics
- 3.1. Introduction
- 3.2. Market Drivers
- 3.2.1. Increasing Number of Surgical Procedures; Technological Advancements in Vessel Sealing Devices
- 3.3. Market Restrains
- 3.3.1. Complications of Vessel Sealing Devices; High Cost of Surgeries
- 3.4. Market Trends
- 3.4.1. The Laparoscopic Segment Accounted for a Major Share of the Market
- 4. Market Factor Analysis
- 4.1. Porters Five Forces
- 4.2. Supply/Value Chain
- 4.3. PESTEL analysis
- 4.4. Market Entropy
- 4.5. Patent/Trademark Analysis
- 5. Global Vessel Sealing Device Industry Analysis, Insights and Forecast, 2019-2031
- 5.1. Market Analysis, Insights and Forecast - by Product
- 5.1.1. Generators
- 5.1.2. Instruments
- 5.1.3. Accessories
- 5.2. Market Analysis, Insights and Forecast - by Application
- 5.2.1. General Surgery
- 5.2.2. Laparoscopic Surgery
- 5.3. Market Analysis, Insights and Forecast - by End User
- 5.3.1. Hospitals and Specialty Clinics
- 5.3.2. Ambulatory Surgical Centers
- 5.4. Market Analysis, Insights and Forecast - by Region
- 5.4.1. North America
- 5.4.2. Europe
- 5.4.3. Asia Pacific
- 5.4.4. Middle East and Africa
- 5.4.5. South America
- 5.1. Market Analysis, Insights and Forecast - by Product
- 6. North America Vessel Sealing Device Industry Analysis, Insights and Forecast, 2019-2031
- 6.1. Market Analysis, Insights and Forecast - by Product
- 6.1.1. Generators
- 6.1.2. Instruments
- 6.1.3. Accessories
- 6.2. Market Analysis, Insights and Forecast - by Application
- 6.2.1. General Surgery
- 6.2.2. Laparoscopic Surgery
- 6.3. Market Analysis, Insights and Forecast - by End User
- 6.3.1. Hospitals and Specialty Clinics
- 6.3.2. Ambulatory Surgical Centers
- 6.1. Market Analysis, Insights and Forecast - by Product
- 7. Europe Vessel Sealing Device Industry Analysis, Insights and Forecast, 2019-2031
- 7.1. Market Analysis, Insights and Forecast - by Product
- 7.1.1. Generators
- 7.1.2. Instruments
- 7.1.3. Accessories
- 7.2. Market Analysis, Insights and Forecast - by Application
- 7.2.1. General Surgery
- 7.2.2. Laparoscopic Surgery
- 7.3. Market Analysis, Insights and Forecast - by End User
- 7.3.1. Hospitals and Specialty Clinics
- 7.3.2. Ambulatory Surgical Centers
- 7.1. Market Analysis, Insights and Forecast - by Product
- 8. Asia Pacific Vessel Sealing Device Industry Analysis, Insights and Forecast, 2019-2031
- 8.1. Market Analysis, Insights and Forecast - by Product
- 8.1.1. Generators
- 8.1.2. Instruments
- 8.1.3. Accessories
- 8.2. Market Analysis, Insights and Forecast - by Application
- 8.2.1. General Surgery
- 8.2.2. Laparoscopic Surgery
- 8.3. Market Analysis, Insights and Forecast - by End User
- 8.3.1. Hospitals and Specialty Clinics
- 8.3.2. Ambulatory Surgical Centers
- 8.1. Market Analysis, Insights and Forecast - by Product
- 9. Middle East and Africa Vessel Sealing Device Industry Analysis, Insights and Forecast, 2019-2031
- 9.1. Market Analysis, Insights and Forecast - by Product
- 9.1.1. Generators
- 9.1.2. Instruments
- 9.1.3. Accessories
- 9.2. Market Analysis, Insights and Forecast - by Application
- 9.2.1. General Surgery
- 9.2.2. Laparoscopic Surgery
- 9.3. Market Analysis, Insights and Forecast - by End User
- 9.3.1. Hospitals and Specialty Clinics
- 9.3.2. Ambulatory Surgical Centers
- 9.1. Market Analysis, Insights and Forecast - by Product
- 10. South America Vessel Sealing Device Industry Analysis, Insights and Forecast, 2019-2031
- 10.1. Market Analysis, Insights and Forecast - by Product
- 10.1.1. Generators
- 10.1.2. Instruments
- 10.1.3. Accessories
- 10.2. Market Analysis, Insights and Forecast - by Application
- 10.2.1. General Surgery
- 10.2.2. Laparoscopic Surgery
- 10.3. Market Analysis, Insights and Forecast - by End User
- 10.3.1. Hospitals and Specialty Clinics
- 10.3.2. Ambulatory Surgical Centers
- 10.1. Market Analysis, Insights and Forecast - by Product
- 11. North America Vessel Sealing Device Industry Analysis, Insights and Forecast, 2019-2031
- 11.1. Market Analysis, Insights and Forecast - By Country/Sub-region
- 11.1.1. undefined
- 12. Europe Vessel Sealing Device Industry Analysis, Insights and Forecast, 2019-2031
- 12.1. Market Analysis, Insights and Forecast - By Country/Sub-region
- 12.1.1. undefined
- 13. Asia Pacific Vessel Sealing Device Industry Analysis, Insights and Forecast, 2019-2031
- 13.1. Market Analysis, Insights and Forecast - By Country/Sub-region
- 13.1.1. undefined
- 14. Middle East and Africa Vessel Sealing Device Industry Analysis, Insights and Forecast, 2019-2031
- 14.1. Market Analysis, Insights and Forecast - By Country/Sub-region
- 14.1.1. undefined
- 15. South America Vessel Sealing Device Industry Analysis, Insights and Forecast, 2019-2031
- 15.1. Market Analysis, Insights and Forecast - By Country/Sub-region
- 15.1.1. undefined
- 16. Competitive Analysis
- 16.1. Global Market Share Analysis 2024
- 16.2. Company Profiles
- 16.2.1 CONMED Corporation
- 16.2.1.1. Overview
- 16.2.1.2. Products
- 16.2.1.3. SWOT Analysis
- 16.2.1.4. Recent Developments
- 16.2.1.5. Financials (Based on Availability)
- 16.2.2 Ethicon US LLC (Johnson & Johnson)
- 16.2.2.1. Overview
- 16.2.2.2. Products
- 16.2.2.3. SWOT Analysis
- 16.2.2.4. Recent Developments
- 16.2.2.5. Financials (Based on Availability)
- 16.2.3 Erbe Medical India Pvt Ltd
- 16.2.3.1. Overview
- 16.2.3.2. Products
- 16.2.3.3. SWOT Analysis
- 16.2.3.4. Recent Developments
- 16.2.3.5. Financials (Based on Availability)
- 16.2.4 BOWA-electronic GmbH & Co KG
- 16.2.4.1. Overview
- 16.2.4.2. Products
- 16.2.4.3. SWOT Analysis
- 16.2.4.4. Recent Developments
- 16.2.4.5. Financials (Based on Availability)
- 16.2.5 Hologic (Bolder Surgical Holdings Inc )
- 16.2.5.1. Overview
- 16.2.5.2. Products
- 16.2.5.3. SWOT Analysis
- 16.2.5.4. Recent Developments
- 16.2.5.5. Financials (Based on Availability)
- 16.2.6 Medtronic PLC
- 16.2.6.1. Overview
- 16.2.6.2. Products
- 16.2.6.3. SWOT Analysis
- 16.2.6.4. Recent Developments
- 16.2.6.5. Financials (Based on Availability)
- 16.2.7 LAMIDEY NOURY FR
- 16.2.7.1. Overview
- 16.2.7.2. Products
- 16.2.7.3. SWOT Analysis
- 16.2.7.4. Recent Developments
- 16.2.7.5. Financials (Based on Availability)
- 16.2.8 OmniGuide Holdings Inc
- 16.2.8.1. Overview
- 16.2.8.2. Products
- 16.2.8.3. SWOT Analysis
- 16.2.8.4. Recent Developments
- 16.2.8.5. Financials (Based on Availability)
- 16.2.9 B Braun Melsungen AG
- 16.2.9.1. Overview
- 16.2.9.2. Products
- 16.2.9.3. SWOT Analysis
- 16.2.9.4. Recent Developments
- 16.2.9.5. Financials (Based on Availability)
- 16.2.10 Boston Scientific Corporation
- 16.2.10.1. Overview
- 16.2.10.2. Products
- 16.2.10.3. SWOT Analysis
- 16.2.10.4. Recent Developments
- 16.2.10.5. Financials (Based on Availability)
- 16.2.11 XCELLANCE Medical Technologies
- 16.2.11.1. Overview
- 16.2.11.2. Products
- 16.2.11.3. SWOT Analysis
- 16.2.11.4. Recent Developments
- 16.2.11.5. Financials (Based on Availability)
- 16.2.12 Olympus Corporation
- 16.2.12.1. Overview
- 16.2.12.2. Products
- 16.2.12.3. SWOT Analysis
- 16.2.12.4. Recent Developments
- 16.2.12.5. Financials (Based on Availability)
- 16.2.1 CONMED Corporation
List of Figures
- Figure 1: Global Vessel Sealing Device Industry Revenue Breakdown (Million, %) by Region 2024 & 2032
- Figure 2: Global Vessel Sealing Device Industry Volume Breakdown (K Unit, %) by Region 2024 & 2032
- Figure 3: North America Vessel Sealing Device Industry Revenue (Million), by Country 2024 & 2032
- Figure 4: North America Vessel Sealing Device Industry Volume (K Unit), by Country 2024 & 2032
- Figure 5: North America Vessel Sealing Device Industry Revenue Share (%), by Country 2024 & 2032
- Figure 6: North America Vessel Sealing Device Industry Volume Share (%), by Country 2024 & 2032
- Figure 7: Europe Vessel Sealing Device Industry Revenue (Million), by Country 2024 & 2032
- Figure 8: Europe Vessel Sealing Device Industry Volume (K Unit), by Country 2024 & 2032
- Figure 9: Europe Vessel Sealing Device Industry Revenue Share (%), by Country 2024 & 2032
- Figure 10: Europe Vessel Sealing Device Industry Volume Share (%), by Country 2024 & 2032
- Figure 11: Asia Pacific Vessel Sealing Device Industry Revenue (Million), by Country 2024 & 2032
- Figure 12: Asia Pacific Vessel Sealing Device Industry Volume (K Unit), by Country 2024 & 2032
- Figure 13: Asia Pacific Vessel Sealing Device Industry Revenue Share (%), by Country 2024 & 2032
- Figure 14: Asia Pacific Vessel Sealing Device Industry Volume Share (%), by Country 2024 & 2032
- Figure 15: Middle East and Africa Vessel Sealing Device Industry Revenue (Million), by Country 2024 & 2032
- Figure 16: Middle East and Africa Vessel Sealing Device Industry Volume (K Unit), by Country 2024 & 2032
- Figure 17: Middle East and Africa Vessel Sealing Device Industry Revenue Share (%), by Country 2024 & 2032
- Figure 18: Middle East and Africa Vessel Sealing Device Industry Volume Share (%), by Country 2024 & 2032
- Figure 19: South America Vessel Sealing Device Industry Revenue (Million), by Country 2024 & 2032
- Figure 20: South America Vessel Sealing Device Industry Volume (K Unit), by Country 2024 & 2032
- Figure 21: South America Vessel Sealing Device Industry Revenue Share (%), by Country 2024 & 2032
- Figure 22: South America Vessel Sealing Device Industry Volume Share (%), by Country 2024 & 2032
- Figure 23: North America Vessel Sealing Device Industry Revenue (Million), by Product 2024 & 2032
- Figure 24: North America Vessel Sealing Device Industry Volume (K Unit), by Product 2024 & 2032
- Figure 25: North America Vessel Sealing Device Industry Revenue Share (%), by Product 2024 & 2032
- Figure 26: North America Vessel Sealing Device Industry Volume Share (%), by Product 2024 & 2032
- Figure 27: North America Vessel Sealing Device Industry Revenue (Million), by Application 2024 & 2032
- Figure 28: North America Vessel Sealing Device Industry Volume (K Unit), by Application 2024 & 2032
- Figure 29: North America Vessel Sealing Device Industry Revenue Share (%), by Application 2024 & 2032
- Figure 30: North America Vessel Sealing Device Industry Volume Share (%), by Application 2024 & 2032
- Figure 31: North America Vessel Sealing Device Industry Revenue (Million), by End User 2024 & 2032
- Figure 32: North America Vessel Sealing Device Industry Volume (K Unit), by End User 2024 & 2032
- Figure 33: North America Vessel Sealing Device Industry Revenue Share (%), by End User 2024 & 2032
- Figure 34: North America Vessel Sealing Device Industry Volume Share (%), by End User 2024 & 2032
- Figure 35: North America Vessel Sealing Device Industry Revenue (Million), by Country 2024 & 2032
- Figure 36: North America Vessel Sealing Device Industry Volume (K Unit), by Country 2024 & 2032
- Figure 37: North America Vessel Sealing Device Industry Revenue Share (%), by Country 2024 & 2032
- Figure 38: North America Vessel Sealing Device Industry Volume Share (%), by Country 2024 & 2032
- Figure 39: Europe Vessel Sealing Device Industry Revenue (Million), by Product 2024 & 2032
- Figure 40: Europe Vessel Sealing Device Industry Volume (K Unit), by Product 2024 & 2032
- Figure 41: Europe Vessel Sealing Device Industry Revenue Share (%), by Product 2024 & 2032
- Figure 42: Europe Vessel Sealing Device Industry Volume Share (%), by Product 2024 & 2032
- Figure 43: Europe Vessel Sealing Device Industry Revenue (Million), by Application 2024 & 2032
- Figure 44: Europe Vessel Sealing Device Industry Volume (K Unit), by Application 2024 & 2032
- Figure 45: Europe Vessel Sealing Device Industry Revenue Share (%), by Application 2024 & 2032
- Figure 46: Europe Vessel Sealing Device Industry Volume Share (%), by Application 2024 & 2032
- Figure 47: Europe Vessel Sealing Device Industry Revenue (Million), by End User 2024 & 2032
- Figure 48: Europe Vessel Sealing Device Industry Volume (K Unit), by End User 2024 & 2032
- Figure 49: Europe Vessel Sealing Device Industry Revenue Share (%), by End User 2024 & 2032
- Figure 50: Europe Vessel Sealing Device Industry Volume Share (%), by End User 2024 & 2032
- Figure 51: Europe Vessel Sealing Device Industry Revenue (Million), by Country 2024 & 2032
- Figure 52: Europe Vessel Sealing Device Industry Volume (K Unit), by Country 2024 & 2032
- Figure 53: Europe Vessel Sealing Device Industry Revenue Share (%), by Country 2024 & 2032
- Figure 54: Europe Vessel Sealing Device Industry Volume Share (%), by Country 2024 & 2032
- Figure 55: Asia Pacific Vessel Sealing Device Industry Revenue (Million), by Product 2024 & 2032
- Figure 56: Asia Pacific Vessel Sealing Device Industry Volume (K Unit), by Product 2024 & 2032
- Figure 57: Asia Pacific Vessel Sealing Device Industry Revenue Share (%), by Product 2024 & 2032
- Figure 58: Asia Pacific Vessel Sealing Device Industry Volume Share (%), by Product 2024 & 2032
- Figure 59: Asia Pacific Vessel Sealing Device Industry Revenue (Million), by Application 2024 & 2032
- Figure 60: Asia Pacific Vessel Sealing Device Industry Volume (K Unit), by Application 2024 & 2032
- Figure 61: Asia Pacific Vessel Sealing Device Industry Revenue Share (%), by Application 2024 & 2032
- Figure 62: Asia Pacific Vessel Sealing Device Industry Volume Share (%), by Application 2024 & 2032
- Figure 63: Asia Pacific Vessel Sealing Device Industry Revenue (Million), by End User 2024 & 2032
- Figure 64: Asia Pacific Vessel Sealing Device Industry Volume (K Unit), by End User 2024 & 2032
- Figure 65: Asia Pacific Vessel Sealing Device Industry Revenue Share (%), by End User 2024 & 2032
- Figure 66: Asia Pacific Vessel Sealing Device Industry Volume Share (%), by End User 2024 & 2032
- Figure 67: Asia Pacific Vessel Sealing Device Industry Revenue (Million), by Country 2024 & 2032
- Figure 68: Asia Pacific Vessel Sealing Device Industry Volume (K Unit), by Country 2024 & 2032
- Figure 69: Asia Pacific Vessel Sealing Device Industry Revenue Share (%), by Country 2024 & 2032
- Figure 70: Asia Pacific Vessel Sealing Device Industry Volume Share (%), by Country 2024 & 2032
- Figure 71: Middle East and Africa Vessel Sealing Device Industry Revenue (Million), by Product 2024 & 2032
- Figure 72: Middle East and Africa Vessel Sealing Device Industry Volume (K Unit), by Product 2024 & 2032
- Figure 73: Middle East and Africa Vessel Sealing Device Industry Revenue Share (%), by Product 2024 & 2032
- Figure 74: Middle East and Africa Vessel Sealing Device Industry Volume Share (%), by Product 2024 & 2032
- Figure 75: Middle East and Africa Vessel Sealing Device Industry Revenue (Million), by Application 2024 & 2032
- Figure 76: Middle East and Africa Vessel Sealing Device Industry Volume (K Unit), by Application 2024 & 2032
- Figure 77: Middle East and Africa Vessel Sealing Device Industry Revenue Share (%), by Application 2024 & 2032
- Figure 78: Middle East and Africa Vessel Sealing Device Industry Volume Share (%), by Application 2024 & 2032
- Figure 79: Middle East and Africa Vessel Sealing Device Industry Revenue (Million), by End User 2024 & 2032
- Figure 80: Middle East and Africa Vessel Sealing Device Industry Volume (K Unit), by End User 2024 & 2032
- Figure 81: Middle East and Africa Vessel Sealing Device Industry Revenue Share (%), by End User 2024 & 2032
- Figure 82: Middle East and Africa Vessel Sealing Device Industry Volume Share (%), by End User 2024 & 2032
- Figure 83: Middle East and Africa Vessel Sealing Device Industry Revenue (Million), by Country 2024 & 2032
- Figure 84: Middle East and Africa Vessel Sealing Device Industry Volume (K Unit), by Country 2024 & 2032
- Figure 85: Middle East and Africa Vessel Sealing Device Industry Revenue Share (%), by Country 2024 & 2032
- Figure 86: Middle East and Africa Vessel Sealing Device Industry Volume Share (%), by Country 2024 & 2032
- Figure 87: South America Vessel Sealing Device Industry Revenue (Million), by Product 2024 & 2032
- Figure 88: South America Vessel Sealing Device Industry Volume (K Unit), by Product 2024 & 2032
- Figure 89: South America Vessel Sealing Device Industry Revenue Share (%), by Product 2024 & 2032
- Figure 90: South America Vessel Sealing Device Industry Volume Share (%), by Product 2024 & 2032
- Figure 91: South America Vessel Sealing Device Industry Revenue (Million), by Application 2024 & 2032
- Figure 92: South America Vessel Sealing Device Industry Volume (K Unit), by Application 2024 & 2032
- Figure 93: South America Vessel Sealing Device Industry Revenue Share (%), by Application 2024 & 2032
- Figure 94: South America Vessel Sealing Device Industry Volume Share (%), by Application 2024 & 2032
- Figure 95: South America Vessel Sealing Device Industry Revenue (Million), by End User 2024 & 2032
- Figure 96: South America Vessel Sealing Device Industry Volume (K Unit), by End User 2024 & 2032
- Figure 97: South America Vessel Sealing Device Industry Revenue Share (%), by End User 2024 & 2032
- Figure 98: South America Vessel Sealing Device Industry Volume Share (%), by End User 2024 & 2032
- Figure 99: South America Vessel Sealing Device Industry Revenue (Million), by Country 2024 & 2032
- Figure 100: South America Vessel Sealing Device Industry Volume (K Unit), by Country 2024 & 2032
- Figure 101: South America Vessel Sealing Device Industry Revenue Share (%), by Country 2024 & 2032
- Figure 102: South America Vessel Sealing Device Industry Volume Share (%), by Country 2024 & 2032
List of Tables
- Table 1: Global Vessel Sealing Device Industry Revenue Million Forecast, by Region 2019 & 2032
- Table 2: Global Vessel Sealing Device Industry Volume K Unit Forecast, by Region 2019 & 2032
- Table 3: Global Vessel Sealing Device Industry Revenue Million Forecast, by Product 2019 & 2032
- Table 4: Global Vessel Sealing Device Industry Volume K Unit Forecast, by Product 2019 & 2032
- Table 5: Global Vessel Sealing Device Industry Revenue Million Forecast, by Application 2019 & 2032
- Table 6: Global Vessel Sealing Device Industry Volume K Unit Forecast, by Application 2019 & 2032
- Table 7: Global Vessel Sealing Device Industry Revenue Million Forecast, by End User 2019 & 2032
- Table 8: Global Vessel Sealing Device Industry Volume K Unit Forecast, by End User 2019 & 2032
- Table 9: Global Vessel Sealing Device Industry Revenue Million Forecast, by Region 2019 & 2032
- Table 10: Global Vessel Sealing Device Industry Volume K Unit Forecast, by Region 2019 & 2032
- Table 11: Global Vessel Sealing Device Industry Revenue Million Forecast, by Country 2019 & 2032
- Table 12: Global Vessel Sealing Device Industry Volume K Unit Forecast, by Country 2019 & 2032
- Table 13: Global Vessel Sealing Device Industry Revenue Million Forecast, by Country 2019 & 2032
- Table 14: Global Vessel Sealing Device Industry Volume K Unit Forecast, by Country 2019 & 2032
- Table 15: Global Vessel Sealing Device Industry Revenue Million Forecast, by Country 2019 & 2032
- Table 16: Global Vessel Sealing Device Industry Volume K Unit Forecast, by Country 2019 & 2032
- Table 17: Global Vessel Sealing Device Industry Revenue Million Forecast, by Country 2019 & 2032
- Table 18: Global Vessel Sealing Device Industry Volume K Unit Forecast, by Country 2019 & 2032
- Table 19: Global Vessel Sealing Device Industry Revenue Million Forecast, by Country 2019 & 2032
- Table 20: Global Vessel Sealing Device Industry Volume K Unit Forecast, by Country 2019 & 2032
- Table 21: Global Vessel Sealing Device Industry Revenue Million Forecast, by Product 2019 & 2032
- Table 22: Global Vessel Sealing Device Industry Volume K Unit Forecast, by Product 2019 & 2032
- Table 23: Global Vessel Sealing Device Industry Revenue Million Forecast, by Application 2019 & 2032
- Table 24: Global Vessel Sealing Device Industry Volume K Unit Forecast, by Application 2019 & 2032
- Table 25: Global Vessel Sealing Device Industry Revenue Million Forecast, by End User 2019 & 2032
- Table 26: Global Vessel Sealing Device Industry Volume K Unit Forecast, by End User 2019 & 2032
- Table 27: Global Vessel Sealing Device Industry Revenue Million Forecast, by Country 2019 & 2032
- Table 28: Global Vessel Sealing Device Industry Volume K Unit Forecast, by Country 2019 & 2032
- Table 29: United States Vessel Sealing Device Industry Revenue (Million) Forecast, by Application 2019 & 2032
- Table 30: United States Vessel Sealing Device Industry Volume (K Unit) Forecast, by Application 2019 & 2032
- Table 31: Canada Vessel Sealing Device Industry Revenue (Million) Forecast, by Application 2019 & 2032
- Table 32: Canada Vessel Sealing Device Industry Volume (K Unit) Forecast, by Application 2019 & 2032
- Table 33: Mexico Vessel Sealing Device Industry Revenue (Million) Forecast, by Application 2019 & 2032
- Table 34: Mexico Vessel Sealing Device Industry Volume (K Unit) Forecast, by Application 2019 & 2032
- Table 35: Global Vessel Sealing Device Industry Revenue Million Forecast, by Product 2019 & 2032
- Table 36: Global Vessel Sealing Device Industry Volume K Unit Forecast, by Product 2019 & 2032
- Table 37: Global Vessel Sealing Device Industry Revenue Million Forecast, by Application 2019 & 2032
- Table 38: Global Vessel Sealing Device Industry Volume K Unit Forecast, by Application 2019 & 2032
- Table 39: Global Vessel Sealing Device Industry Revenue Million Forecast, by End User 2019 & 2032
- Table 40: Global Vessel Sealing Device Industry Volume K Unit Forecast, by End User 2019 & 2032
- Table 41: Global Vessel Sealing Device Industry Revenue Million Forecast, by Country 2019 & 2032
- Table 42: Global Vessel Sealing Device Industry Volume K Unit Forecast, by Country 2019 & 2032
- Table 43: Germany Vessel Sealing Device Industry Revenue (Million) Forecast, by Application 2019 & 2032
- Table 44: Germany Vessel Sealing Device Industry Volume (K Unit) Forecast, by Application 2019 & 2032
- Table 45: United Kingdom Vessel Sealing Device Industry Revenue (Million) Forecast, by Application 2019 & 2032
- Table 46: United Kingdom Vessel Sealing Device Industry Volume (K Unit) Forecast, by Application 2019 & 2032
- Table 47: France Vessel Sealing Device Industry Revenue (Million) Forecast, by Application 2019 & 2032
- Table 48: France Vessel Sealing Device Industry Volume (K Unit) Forecast, by Application 2019 & 2032
- Table 49: Italy Vessel Sealing Device Industry Revenue (Million) Forecast, by Application 2019 & 2032
- Table 50: Italy Vessel Sealing Device Industry Volume (K Unit) Forecast, by Application 2019 & 2032
- Table 51: Spain Vessel Sealing Device Industry Revenue (Million) Forecast, by Application 2019 & 2032
- Table 52: Spain Vessel Sealing Device Industry Volume (K Unit) Forecast, by Application 2019 & 2032
- Table 53: Rest of Europe Vessel Sealing Device Industry Revenue (Million) Forecast, by Application 2019 & 2032
- Table 54: Rest of Europe Vessel Sealing Device Industry Volume (K Unit) Forecast, by Application 2019 & 2032
- Table 55: Global Vessel Sealing Device Industry Revenue Million Forecast, by Product 2019 & 2032
- Table 56: Global Vessel Sealing Device Industry Volume K Unit Forecast, by Product 2019 & 2032
- Table 57: Global Vessel Sealing Device Industry Revenue Million Forecast, by Application 2019 & 2032
- Table 58: Global Vessel Sealing Device Industry Volume K Unit Forecast, by Application 2019 & 2032
- Table 59: Global Vessel Sealing Device Industry Revenue Million Forecast, by End User 2019 & 2032
- Table 60: Global Vessel Sealing Device Industry Volume K Unit Forecast, by End User 2019 & 2032
- Table 61: Global Vessel Sealing Device Industry Revenue Million Forecast, by Country 2019 & 2032
- Table 62: Global Vessel Sealing Device Industry Volume K Unit Forecast, by Country 2019 & 2032
- Table 63: China Vessel Sealing Device Industry Revenue (Million) Forecast, by Application 2019 & 2032
- Table 64: China Vessel Sealing Device Industry Volume (K Unit) Forecast, by Application 2019 & 2032
- Table 65: Japan Vessel Sealing Device Industry Revenue (Million) Forecast, by Application 2019 & 2032
- Table 66: Japan Vessel Sealing Device Industry Volume (K Unit) Forecast, by Application 2019 & 2032
- Table 67: India Vessel Sealing Device Industry Revenue (Million) Forecast, by Application 2019 & 2032
- Table 68: India Vessel Sealing Device Industry Volume (K Unit) Forecast, by Application 2019 & 2032
- Table 69: Australia Vessel Sealing Device Industry Revenue (Million) Forecast, by Application 2019 & 2032
- Table 70: Australia Vessel Sealing Device Industry Volume (K Unit) Forecast, by Application 2019 & 2032
- Table 71: South Korea Vessel Sealing Device Industry Revenue (Million) Forecast, by Application 2019 & 2032
- Table 72: South Korea Vessel Sealing Device Industry Volume (K Unit) Forecast, by Application 2019 & 2032
- Table 73: Rest of Asia Pacific Vessel Sealing Device Industry Revenue (Million) Forecast, by Application 2019 & 2032
- Table 74: Rest of Asia Pacific Vessel Sealing Device Industry Volume (K Unit) Forecast, by Application 2019 & 2032
- Table 75: Global Vessel Sealing Device Industry Revenue Million Forecast, by Product 2019 & 2032
- Table 76: Global Vessel Sealing Device Industry Volume K Unit Forecast, by Product 2019 & 2032
- Table 77: Global Vessel Sealing Device Industry Revenue Million Forecast, by Application 2019 & 2032
- Table 78: Global Vessel Sealing Device Industry Volume K Unit Forecast, by Application 2019 & 2032
- Table 79: Global Vessel Sealing Device Industry Revenue Million Forecast, by End User 2019 & 2032
- Table 80: Global Vessel Sealing Device Industry Volume K Unit Forecast, by End User 2019 & 2032
- Table 81: Global Vessel Sealing Device Industry Revenue Million Forecast, by Country 2019 & 2032
- Table 82: Global Vessel Sealing Device Industry Volume K Unit Forecast, by Country 2019 & 2032
- Table 83: GCC Vessel Sealing Device Industry Revenue (Million) Forecast, by Application 2019 & 2032
- Table 84: GCC Vessel Sealing Device Industry Volume (K Unit) Forecast, by Application 2019 & 2032
- Table 85: South Africa Vessel Sealing Device Industry Revenue (Million) Forecast, by Application 2019 & 2032
- Table 86: South Africa Vessel Sealing Device Industry Volume (K Unit) Forecast, by Application 2019 & 2032
- Table 87: Rest of Middle East and Africa Vessel Sealing Device Industry Revenue (Million) Forecast, by Application 2019 & 2032
- Table 88: Rest of Middle East and Africa Vessel Sealing Device Industry Volume (K Unit) Forecast, by Application 2019 & 2032
- Table 89: Global Vessel Sealing Device Industry Revenue Million Forecast, by Product 2019 & 2032
- Table 90: Global Vessel Sealing Device Industry Volume K Unit Forecast, by Product 2019 & 2032
- Table 91: Global Vessel Sealing Device Industry Revenue Million Forecast, by Application 2019 & 2032
- Table 92: Global Vessel Sealing Device Industry Volume K Unit Forecast, by Application 2019 & 2032
- Table 93: Global Vessel Sealing Device Industry Revenue Million Forecast, by End User 2019 & 2032
- Table 94: Global Vessel Sealing Device Industry Volume K Unit Forecast, by End User 2019 & 2032
- Table 95: Global Vessel Sealing Device Industry Revenue Million Forecast, by Country 2019 & 2032
- Table 96: Global Vessel Sealing Device Industry Volume K Unit Forecast, by Country 2019 & 2032
- Table 97: Brazil Vessel Sealing Device Industry Revenue (Million) Forecast, by Application 2019 & 2032
- Table 98: Brazil Vessel Sealing Device Industry Volume (K Unit) Forecast, by Application 2019 & 2032
- Table 99: Argentina Vessel Sealing Device Industry Revenue (Million) Forecast, by Application 2019 & 2032
- Table 100: Argentina Vessel Sealing Device Industry Volume (K Unit) Forecast, by Application 2019 & 2032
- Table 101: Rest of South America Vessel Sealing Device Industry Revenue (Million) Forecast, by Application 2019 & 2032
- Table 102: Rest of South America Vessel Sealing Device Industry Volume (K Unit) Forecast, by Application 2019 & 2032
Frequently Asked Questions
1. What is the projected Compound Annual Growth Rate (CAGR) of the Vessel Sealing Device Industry?
The projected CAGR is approximately 3.37%.
2. Which companies are prominent players in the Vessel Sealing Device Industry?
Key companies in the market include CONMED Corporation, Ethicon US LLC (Johnson & Johnson), Erbe Medical India Pvt Ltd, BOWA-electronic GmbH & Co KG, Hologic (Bolder Surgical Holdings Inc ), Medtronic PLC, LAMIDEY NOURY FR , OmniGuide Holdings Inc, B Braun Melsungen AG, Boston Scientific Corporation, XCELLANCE Medical Technologies, Olympus Corporation.
3. What are the main segments of the Vessel Sealing Device Industry?
The market segments include Product, Application, End User.
4. Can you provide details about the market size?
The market size is estimated to be USD 6.35 Million as of 2022.
5. What are some drivers contributing to market growth?
Increasing Number of Surgical Procedures; Technological Advancements in Vessel Sealing Devices.
6. What are the notable trends driving market growth?
The Laparoscopic Segment Accounted for a Major Share of the Market.
7. Are there any restraints impacting market growth?
Complications of Vessel Sealing Devices; High Cost of Surgeries.
8. Can you provide examples of recent developments in the market?
In October 2021, Hologic Inc. had a USD 160 million deal to acquire Bolder Surgical, a developer and manufacturer of advanced energy vessel sealing surgical devices.
9. What pricing options are available for accessing the report?
Pricing options include single-user, multi-user, and enterprise licenses priced at USD 4750, USD 5250, and USD 8750 respectively.
10. Is the market size provided in terms of value or volume?
The market size is provided in terms of value, measured in Million and volume, measured in K Unit.
11. Are there any specific market keywords associated with the report?
Yes, the market keyword associated with the report is "Vessel Sealing Device Industry," which aids in identifying and referencing the specific market segment covered.
12. How do I determine which pricing option suits my needs best?
The pricing options vary based on user requirements and access needs. Individual users may opt for single-user licenses, while businesses requiring broader access may choose multi-user or enterprise licenses for cost-effective access to the report.
13. Are there any additional resources or data provided in the Vessel Sealing Device Industry report?
While the report offers comprehensive insights, it's advisable to review the specific contents or supplementary materials provided to ascertain if additional resources or data are available.
14. How can I stay updated on further developments or reports in the Vessel Sealing Device Industry?
To stay informed about further developments, trends, and reports in the Vessel Sealing Device Industry, consider subscribing to industry newsletters, following relevant companies and organizations, or regularly checking reputable industry news sources and publications.
Methodology
Step 1 - Identification of Relevant Samples Size from Population Database


Step 2 - Approaches for Defining Global Market Size (Value, Volume* & Price*)

Note*: In applicable scenarios
Step 3 - Data Sources
Primary Research
- Web Analytics
- Survey Reports
- Research Institute
- Latest Research Reports
- Opinion Leaders
Secondary Research
- Annual Reports
- White Paper
- Latest Press Release
- Industry Association
- Paid Database
- Investor Presentations

Step 4 - Data Triangulation
Involves using different sources of information in order to increase the validity of a study
These sources are likely to be stakeholders in a program - participants, other researchers, program staff, other community members, and so on.
Then we put all data in single framework & apply various statistical tools to find out the dynamic on the market.
During the analysis stage, feedback from the stakeholder groups would be compared to determine areas of agreement as well as areas of divergence


