
Key Insights
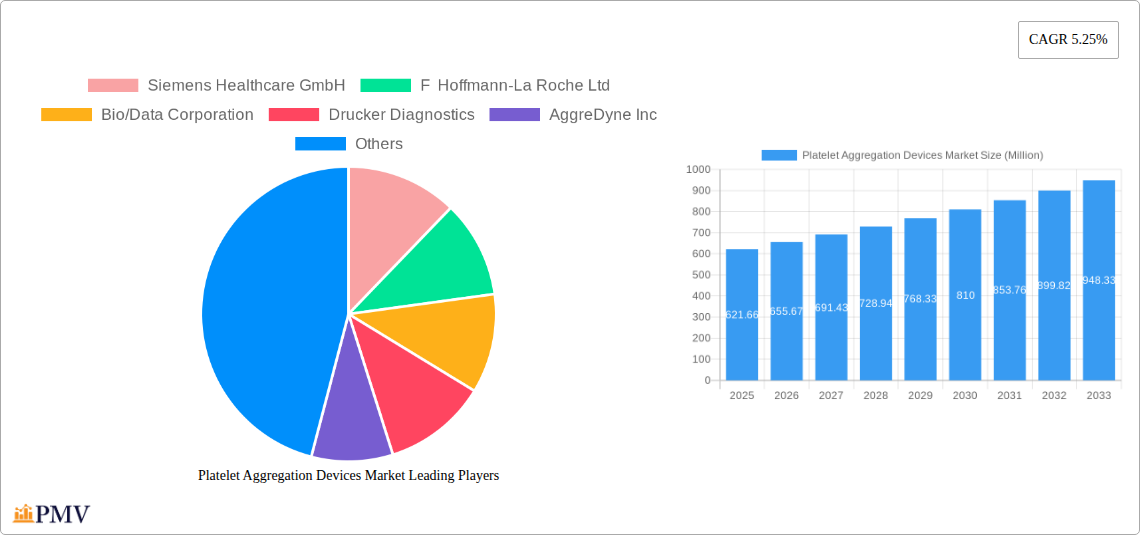
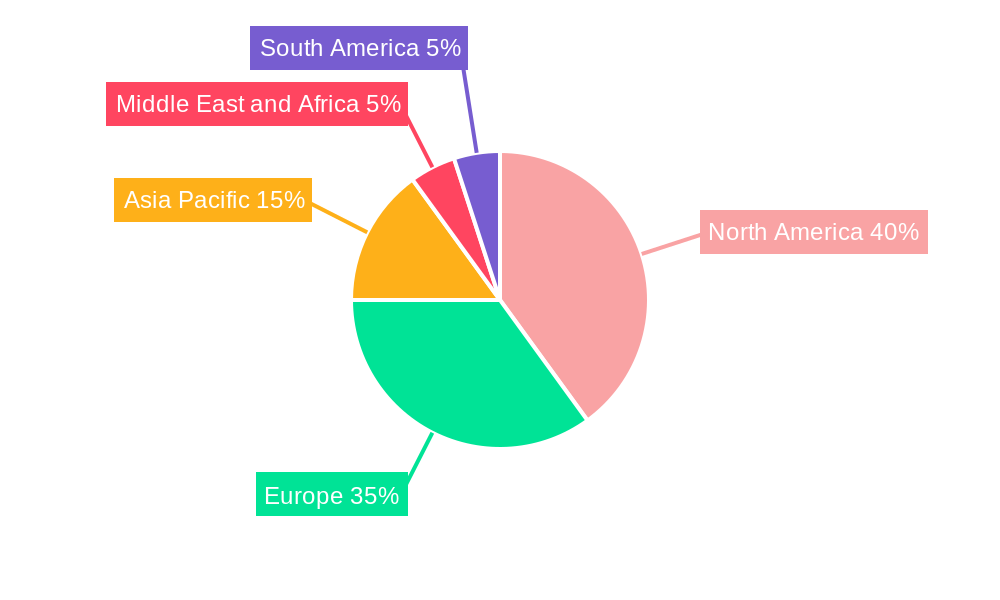
The global Platelet Aggregation Devices market, valued at $621.66 million in 2025, is projected to experience robust growth, driven by several key factors. The rising prevalence of cardiovascular diseases, increasing demand for advanced diagnostic tools in hospitals and diagnostic laboratories, and the growing adoption of minimally invasive procedures are significantly boosting market expansion. Technological advancements leading to more accurate, efficient, and user-friendly platelet aggregation devices are further fueling market growth. The market is segmented by end-user (hospitals, diagnostic laboratories, and other end-users), product type (systems, reagents, consumables, and accessories), and application (clinical and research applications). Hospitals currently represent the largest segment due to their extensive diagnostic capabilities and high patient volume. However, the increasing adoption of point-of-care testing and decentralized diagnostic services is expected to drive growth in the other end-user segment in the coming years. The reagents segment holds substantial market share, as reagents are essential for conducting platelet aggregation assays. Geographical distribution shows strong market presence in North America and Europe, driven by established healthcare infrastructure and high per capita healthcare expenditure. However, the Asia-Pacific region is anticipated to witness significant growth in the forecast period due to rising healthcare awareness, expanding healthcare infrastructure, and an increasing geriatric population susceptible to cardiovascular diseases. Competitive landscape analysis reveals the presence of key players such as Siemens Healthcare GmbH, F. Hoffmann-La Roche Ltd., and others, constantly innovating and expanding their product portfolios to maintain market share.
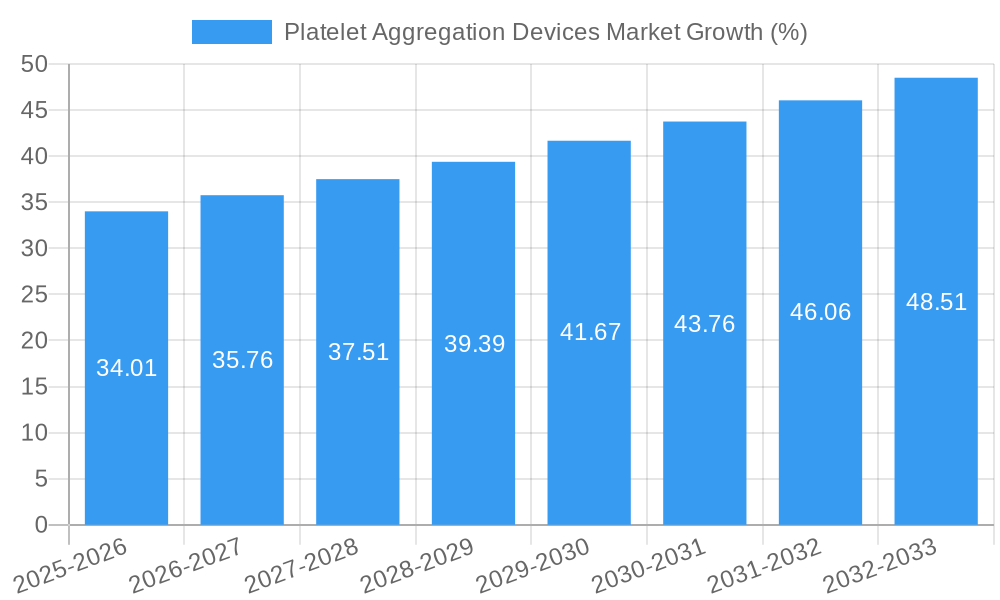
The market's Compound Annual Growth Rate (CAGR) of 5.25% from 2019 to 2025 indicates a steady upward trajectory. While challenges exist, such as high costs associated with advanced systems and the need for skilled personnel to operate the devices, these are mitigated by the significant benefits of early diagnosis and effective treatment of cardiovascular conditions. The market's future prospects are optimistic, especially with ongoing research and development in areas like point-of-care testing and improved assay sensitivity. Continued technological advancements and a growing awareness of cardiovascular health are projected to drive market expansion throughout the forecast period (2025-2033), resulting in considerable market expansion. This growth is expected to be particularly pronounced in emerging economies with expanding healthcare sectors and increased investment in advanced medical technologies.
This comprehensive report provides an in-depth analysis of the global Platelet Aggregation Devices Market, covering the period from 2019 to 2033. It offers actionable insights into market dynamics, competitive landscapes, and future growth opportunities, making it an essential resource for industry stakeholders, investors, and researchers. The report utilizes data from the historical period (2019-2024), base year (2025), and estimated year (2025) to project the market's trajectory during the forecast period (2025-2033). The market size is presented in Millions across all segments.
Platelet Aggregation Devices Market Market Structure & Competitive Dynamics
The Platelet Aggregation Devices market exhibits a moderately consolidated structure, with key players holding significant market share. The competitive landscape is characterized by intense rivalry driven by product innovation, technological advancements, and strategic acquisitions. Market concentration is estimated at xx%, with the top five players accounting for approximately xx Million in revenue in 2025. Innovation is heavily influenced by regulatory frameworks, primarily driven by the need for enhanced accuracy and safety in diagnostic procedures. Substitute products, such as alternative hemostasis diagnostic methods, pose a moderate threat to market growth, although their limitations in certain applications maintain the demand for platelet aggregation devices. End-user trends reveal a growing preference for automated and high-throughput systems, particularly in large diagnostic laboratories. M&A activity in the market has been moderate, with deal values ranging from xx Million to xx Million in recent years.
- Market Concentration: xx% in 2025
- Top 5 Players Revenue (2025): Approximately xx Million
- Average M&A Deal Value (2020-2024): xx Million
Platelet Aggregation Devices Market Industry Trends & Insights
The global Platelet Aggregation Devices market is experiencing robust growth, projected to achieve a CAGR of xx% during the forecast period (2025-2033). This growth is fueled by several factors. The increasing prevalence of cardiovascular diseases and bleeding disorders is a key driver, alongside rising demand for accurate and timely diagnosis in hospitals and diagnostic laboratories. Technological advancements, such as the development of automated systems and improved reagents, are enhancing the efficiency and accuracy of platelet aggregation assays, thereby increasing market penetration. Consumer preference is shifting towards more sophisticated and user-friendly systems that require minimal operator training. Furthermore, the competitive landscape is fostering innovation, with companies continuously striving to improve product features and reduce costs. Market penetration for automated systems in hospitals is expected to reach xx% by 2033.
Dominant Markets & Segments in Platelet Aggregation Devices Market
The North American region is projected to dominate the Platelet Aggregation Devices market throughout the forecast period, primarily driven by a robust healthcare infrastructure, high prevalence of target diseases, and increased adoption of advanced diagnostic technologies. Within the market, Hospitals represent the largest end-user segment, followed by Diagnostic Laboratories and Other End Users. The Systems segment holds the largest market share within the Product category, owing to the demand for integrated and automated solutions. Clinical Applications dominate the Applications segment, reflecting the crucial role of platelet aggregation assays in diagnosing and managing hematological disorders.
Key Drivers for North American Dominance:
- Advanced Healthcare Infrastructure
- High Prevalence of Cardiovascular and Hematological Diseases
- Increased Adoption of Advanced Diagnostic Technologies
- Favorable Regulatory Environment
Largest Segments:
- End User: Hospitals
- Product: Systems
- Application: Clinical Applications
Platelet Aggregation Devices Market Product Innovations
Recent innovations in platelet aggregation devices focus on enhancing accuracy, speed, and automation. Miniaturized systems, improved reagent formulations, and integrated data analysis capabilities are key features in newly launched products. These advancements cater to the growing demand for efficient and reliable diagnostic tools in busy clinical settings. This trend reflects the overall industry push towards improving workflow efficiency and reducing diagnostic times.
Report Segmentation & Scope
The report segments the Platelet Aggregation Devices market across several key parameters:
End User: Hospitals, Diagnostic Laboratories, Other End Users. The Hospitals segment is projected to grow at a CAGR of xx% due to increasing healthcare spending and adoption of advanced diagnostic tools. Diagnostic Laboratories segment growth is fueled by the increasing outsourcing of diagnostic tests. Other End Users include research institutions and pharmaceutical companies.
Product: Systems, Reagents, Consumables and Accessories. Systems are projected to dominate due to the growing preference for automated solutions. Reagent and consumables markets are expected to maintain steady growth based on testing volumes.
Application: Clinical Applications, Research Applications. The Clinical Applications segment is expected to dominate the market given the significant usage in diagnosing and managing hematological disorders. Research Applications is expected to have a moderate growth rate driven by research activities in hemostasis and thrombosis.
Key Drivers of Platelet Aggregation Devices Market Growth
The Platelet Aggregation Devices market is driven by several factors, including the rising prevalence of cardiovascular diseases and bleeding disorders. Technological advancements, such as the development of automated and high-throughput systems, improve diagnostic accuracy and efficiency, driving market growth. Stringent regulatory frameworks emphasizing diagnostic accuracy also contribute positively. Furthermore, increasing healthcare expenditure and the rising adoption of advanced diagnostic techniques further propel market growth.
Challenges in the Platelet Aggregation Devices Market Sector
The market faces challenges such as the high cost of advanced systems, particularly in resource-constrained settings. Supply chain disruptions and the availability of skilled technicians to operate and maintain the devices also pose significant hurdles. Competitive pressures and the emergence of substitute technologies create additional challenges for market participants. The regulatory environment, while driving quality, can also add complexity and delay product launches, potentially impacting market growth. The overall impact of these challenges on market growth is estimated to reduce the CAGR by approximately xx%.
Leading Players in the Platelet Aggregation Devices Market Market
- Siemens Healthcare GmbH
- F Hoffmann-La Roche Ltd
- Bio/Data Corporation
- Drucker Diagnostics
- AggreDyne Inc
- Grifols S.A
- Sienco Inc
- Chrono-Log Corporation
- Sysmex Corporation
- Werfen
- Haemonetics Corporation
- Heamochrom Diagnostica GmbH
Key Developments in Platelet Aggregation Devices Market Sector
May 2022: Precision BioLogic Inc. launched the cryocheck Chromogenic Factor IX assay in Canada, the European Union, the United Kingdom, Australia, and New Zealand. This expansion significantly broadens the market reach of this new assay.
February 2022: Futura Surgicare Pvt Ltd launched Hemostax (Oxidised Regenerated Cellulose) hemostatic products. This introduction provides a competitive alternative in the hemostasis market, impacting product diversity and possibly driving innovation among existing players.
Strategic Platelet Aggregation Devices Market Market Outlook
The Platelet Aggregation Devices market presents significant growth opportunities, especially in emerging economies with increasing healthcare infrastructure development. Continued technological innovation, focusing on point-of-care diagnostics and personalized medicine, will further drive market expansion. Strategic partnerships, collaborations, and acquisitions among key players are expected to shape the competitive landscape and accelerate market growth. The potential for growth in the research application segment also presents substantial opportunities for market players.
Platelet Aggregation Devices Market Segmentation
-
1. Product
- 1.1. Systems
- 1.2. Reagents
- 1.3. Consumables and Accessories
-
2. Application
- 2.1. Clinical Applications
- 2.2. Research Applications
-
3. End User
- 3.1. Hospitals
- 3.2. Diagnostic Laboratories
- 3.3. Other End Users
Platelet Aggregation Devices Market Segmentation By Geography
-
1. North America
- 1.1. United States
- 1.2. Canada
- 1.3. Mexico
-
2. Europe
- 2.1. Germany
- 2.2. United Kingdom
- 2.3. France
- 2.4. Italy
- 2.5. Spain
- 2.6. Rest of Europe
-
3. Asia Pacific
- 3.1. China
- 3.2. Japan
- 3.3. India
- 3.4. Australia
- 3.5. South Korea
- 3.6. Rest of Asia Pacific
-
4. Middle East and Africa
- 4.1. GCC
- 4.2. South Africa
- 4.3. Rest of Middle East and Africa
-
5. South America
- 5.1. Brazil
- 5.2. Argentina
- 5.3. Rest of South America
Platelet Aggregation Devices Market REPORT HIGHLIGHTS
| Aspects | Details |
|---|---|
| Study Period | 2019-2033 |
| Base Year | 2024 |
| Estimated Year | 2025 |
| Forecast Period | 2025-2033 |
| Historical Period | 2019-2024 |
| Growth Rate | CAGR of 5.25% from 2019-2033 |
| Segmentation |
|
Table of Contents
- 1. Introduction
- 1.1. Research Scope
- 1.2. Market Segmentation
- 1.3. Research Methodology
- 1.4. Definitions and Assumptions
- 2. Executive Summary
- 2.1. Introduction
- 3. Market Dynamics
- 3.1. Introduction
- 3.2. Market Drivers
- 3.2.1. Rising Incidence of Chronic Diseases; Increasing Geriatric Population; Technological Advancements in Platelet Aggregometers
- 3.3. Market Restrains
- 3.3.1. High Cost of Devices and Shortage of Skilled Personnel
- 3.4. Market Trends
- 3.4.1. The Systems Segment is Expected to Witness Notable Growth in the Market Over the Forecast Period
- 4. Market Factor Analysis
- 4.1. Porters Five Forces
- 4.2. Supply/Value Chain
- 4.3. PESTEL analysis
- 4.4. Market Entropy
- 4.5. Patent/Trademark Analysis
- 5. Global Platelet Aggregation Devices Market Analysis, Insights and Forecast, 2019-2031
- 5.1. Market Analysis, Insights and Forecast - by Product
- 5.1.1. Systems
- 5.1.2. Reagents
- 5.1.3. Consumables and Accessories
- 5.2. Market Analysis, Insights and Forecast - by Application
- 5.2.1. Clinical Applications
- 5.2.2. Research Applications
- 5.3. Market Analysis, Insights and Forecast - by End User
- 5.3.1. Hospitals
- 5.3.2. Diagnostic Laboratories
- 5.3.3. Other End Users
- 5.4. Market Analysis, Insights and Forecast - by Region
- 5.4.1. North America
- 5.4.2. Europe
- 5.4.3. Asia Pacific
- 5.4.4. Middle East and Africa
- 5.4.5. South America
- 5.1. Market Analysis, Insights and Forecast - by Product
- 6. North America Platelet Aggregation Devices Market Analysis, Insights and Forecast, 2019-2031
- 6.1. Market Analysis, Insights and Forecast - by Product
- 6.1.1. Systems
- 6.1.2. Reagents
- 6.1.3. Consumables and Accessories
- 6.2. Market Analysis, Insights and Forecast - by Application
- 6.2.1. Clinical Applications
- 6.2.2. Research Applications
- 6.3. Market Analysis, Insights and Forecast - by End User
- 6.3.1. Hospitals
- 6.3.2. Diagnostic Laboratories
- 6.3.3. Other End Users
- 6.1. Market Analysis, Insights and Forecast - by Product
- 7. Europe Platelet Aggregation Devices Market Analysis, Insights and Forecast, 2019-2031
- 7.1. Market Analysis, Insights and Forecast - by Product
- 7.1.1. Systems
- 7.1.2. Reagents
- 7.1.3. Consumables and Accessories
- 7.2. Market Analysis, Insights and Forecast - by Application
- 7.2.1. Clinical Applications
- 7.2.2. Research Applications
- 7.3. Market Analysis, Insights and Forecast - by End User
- 7.3.1. Hospitals
- 7.3.2. Diagnostic Laboratories
- 7.3.3. Other End Users
- 7.1. Market Analysis, Insights and Forecast - by Product
- 8. Asia Pacific Platelet Aggregation Devices Market Analysis, Insights and Forecast, 2019-2031
- 8.1. Market Analysis, Insights and Forecast - by Product
- 8.1.1. Systems
- 8.1.2. Reagents
- 8.1.3. Consumables and Accessories
- 8.2. Market Analysis, Insights and Forecast - by Application
- 8.2.1. Clinical Applications
- 8.2.2. Research Applications
- 8.3. Market Analysis, Insights and Forecast - by End User
- 8.3.1. Hospitals
- 8.3.2. Diagnostic Laboratories
- 8.3.3. Other End Users
- 8.1. Market Analysis, Insights and Forecast - by Product
- 9. Middle East and Africa Platelet Aggregation Devices Market Analysis, Insights and Forecast, 2019-2031
- 9.1. Market Analysis, Insights and Forecast - by Product
- 9.1.1. Systems
- 9.1.2. Reagents
- 9.1.3. Consumables and Accessories
- 9.2. Market Analysis, Insights and Forecast - by Application
- 9.2.1. Clinical Applications
- 9.2.2. Research Applications
- 9.3. Market Analysis, Insights and Forecast - by End User
- 9.3.1. Hospitals
- 9.3.2. Diagnostic Laboratories
- 9.3.3. Other End Users
- 9.1. Market Analysis, Insights and Forecast - by Product
- 10. South America Platelet Aggregation Devices Market Analysis, Insights and Forecast, 2019-2031
- 10.1. Market Analysis, Insights and Forecast - by Product
- 10.1.1. Systems
- 10.1.2. Reagents
- 10.1.3. Consumables and Accessories
- 10.2. Market Analysis, Insights and Forecast - by Application
- 10.2.1. Clinical Applications
- 10.2.2. Research Applications
- 10.3. Market Analysis, Insights and Forecast - by End User
- 10.3.1. Hospitals
- 10.3.2. Diagnostic Laboratories
- 10.3.3. Other End Users
- 10.1. Market Analysis, Insights and Forecast - by Product
- 11. North America Platelet Aggregation Devices Market Analysis, Insights and Forecast, 2019-2031
- 11.1. Market Analysis, Insights and Forecast - By Country/Sub-region
- 11.1.1 United States
- 11.1.2 Canada
- 11.1.3 Mexico
- 12. Europe Platelet Aggregation Devices Market Analysis, Insights and Forecast, 2019-2031
- 12.1. Market Analysis, Insights and Forecast - By Country/Sub-region
- 12.1.1 Germany
- 12.1.2 United Kingdom
- 12.1.3 France
- 12.1.4 Italy
- 12.1.5 Spain
- 12.1.6 Rest of Europe
- 13. Asia Pacific Platelet Aggregation Devices Market Analysis, Insights and Forecast, 2019-2031
- 13.1. Market Analysis, Insights and Forecast - By Country/Sub-region
- 13.1.1 China
- 13.1.2 Japan
- 13.1.3 India
- 13.1.4 Australia
- 13.1.5 South Korea
- 13.1.6 Rest of Asia Pacific
- 14. Middle East and Africa Platelet Aggregation Devices Market Analysis, Insights and Forecast, 2019-2031
- 14.1. Market Analysis, Insights and Forecast - By Country/Sub-region
- 14.1.1 GCC
- 14.1.2 South Africa
- 14.1.3 Rest of Middle East and Africa
- 15. South America Platelet Aggregation Devices Market Analysis, Insights and Forecast, 2019-2031
- 15.1. Market Analysis, Insights and Forecast - By Country/Sub-region
- 15.1.1 Brazil
- 15.1.2 Argentina
- 15.1.3 Rest of South America
- 16. Competitive Analysis
- 16.1. Global Market Share Analysis 2024
- 16.2. Company Profiles
- 16.2.1 Siemens Healthcare GmbH
- 16.2.1.1. Overview
- 16.2.1.2. Products
- 16.2.1.3. SWOT Analysis
- 16.2.1.4. Recent Developments
- 16.2.1.5. Financials (Based on Availability)
- 16.2.2 F Hoffmann-La Roche Ltd
- 16.2.2.1. Overview
- 16.2.2.2. Products
- 16.2.2.3. SWOT Analysis
- 16.2.2.4. Recent Developments
- 16.2.2.5. Financials (Based on Availability)
- 16.2.3 Bio/Data Corporation
- 16.2.3.1. Overview
- 16.2.3.2. Products
- 16.2.3.3. SWOT Analysis
- 16.2.3.4. Recent Developments
- 16.2.3.5. Financials (Based on Availability)
- 16.2.4 Drucker Diagnostics
- 16.2.4.1. Overview
- 16.2.4.2. Products
- 16.2.4.3. SWOT Analysis
- 16.2.4.4. Recent Developments
- 16.2.4.5. Financials (Based on Availability)
- 16.2.5 AggreDyne Inc
- 16.2.5.1. Overview
- 16.2.5.2. Products
- 16.2.5.3. SWOT Analysis
- 16.2.5.4. Recent Developments
- 16.2.5.5. Financials (Based on Availability)
- 16.2.6 Grifols S A
- 16.2.6.1. Overview
- 16.2.6.2. Products
- 16.2.6.3. SWOT Analysis
- 16.2.6.4. Recent Developments
- 16.2.6.5. Financials (Based on Availability)
- 16.2.7 Sienco Inc
- 16.2.7.1. Overview
- 16.2.7.2. Products
- 16.2.7.3. SWOT Analysis
- 16.2.7.4. Recent Developments
- 16.2.7.5. Financials (Based on Availability)
- 16.2.8 Chrono-Log Corporation
- 16.2.8.1. Overview
- 16.2.8.2. Products
- 16.2.8.3. SWOT Analysis
- 16.2.8.4. Recent Developments
- 16.2.8.5. Financials (Based on Availability)
- 16.2.9 Sysmex Corporation
- 16.2.9.1. Overview
- 16.2.9.2. Products
- 16.2.9.3. SWOT Analysis
- 16.2.9.4. Recent Developments
- 16.2.9.5. Financials (Based on Availability)
- 16.2.10 Werfen
- 16.2.10.1. Overview
- 16.2.10.2. Products
- 16.2.10.3. SWOT Analysis
- 16.2.10.4. Recent Developments
- 16.2.10.5. Financials (Based on Availability)
- 16.2.11 Haemonetics Corporation
- 16.2.11.1. Overview
- 16.2.11.2. Products
- 16.2.11.3. SWOT Analysis
- 16.2.11.4. Recent Developments
- 16.2.11.5. Financials (Based on Availability)
- 16.2.12 Heamochrom Diagnostica GmbH
- 16.2.12.1. Overview
- 16.2.12.2. Products
- 16.2.12.3. SWOT Analysis
- 16.2.12.4. Recent Developments
- 16.2.12.5. Financials (Based on Availability)
- 16.2.1 Siemens Healthcare GmbH
List of Figures
- Figure 1: Global Platelet Aggregation Devices Market Revenue Breakdown (Million, %) by Region 2024 & 2032
- Figure 2: Global Platelet Aggregation Devices Market Volume Breakdown (K Units, %) by Region 2024 & 2032
- Figure 3: North America Platelet Aggregation Devices Market Revenue (Million), by Country 2024 & 2032
- Figure 4: North America Platelet Aggregation Devices Market Volume (K Units), by Country 2024 & 2032
- Figure 5: North America Platelet Aggregation Devices Market Revenue Share (%), by Country 2024 & 2032
- Figure 6: North America Platelet Aggregation Devices Market Volume Share (%), by Country 2024 & 2032
- Figure 7: Europe Platelet Aggregation Devices Market Revenue (Million), by Country 2024 & 2032
- Figure 8: Europe Platelet Aggregation Devices Market Volume (K Units), by Country 2024 & 2032
- Figure 9: Europe Platelet Aggregation Devices Market Revenue Share (%), by Country 2024 & 2032
- Figure 10: Europe Platelet Aggregation Devices Market Volume Share (%), by Country 2024 & 2032
- Figure 11: Asia Pacific Platelet Aggregation Devices Market Revenue (Million), by Country 2024 & 2032
- Figure 12: Asia Pacific Platelet Aggregation Devices Market Volume (K Units), by Country 2024 & 2032
- Figure 13: Asia Pacific Platelet Aggregation Devices Market Revenue Share (%), by Country 2024 & 2032
- Figure 14: Asia Pacific Platelet Aggregation Devices Market Volume Share (%), by Country 2024 & 2032
- Figure 15: Middle East and Africa Platelet Aggregation Devices Market Revenue (Million), by Country 2024 & 2032
- Figure 16: Middle East and Africa Platelet Aggregation Devices Market Volume (K Units), by Country 2024 & 2032
- Figure 17: Middle East and Africa Platelet Aggregation Devices Market Revenue Share (%), by Country 2024 & 2032
- Figure 18: Middle East and Africa Platelet Aggregation Devices Market Volume Share (%), by Country 2024 & 2032
- Figure 19: South America Platelet Aggregation Devices Market Revenue (Million), by Country 2024 & 2032
- Figure 20: South America Platelet Aggregation Devices Market Volume (K Units), by Country 2024 & 2032
- Figure 21: South America Platelet Aggregation Devices Market Revenue Share (%), by Country 2024 & 2032
- Figure 22: South America Platelet Aggregation Devices Market Volume Share (%), by Country 2024 & 2032
- Figure 23: North America Platelet Aggregation Devices Market Revenue (Million), by Product 2024 & 2032
- Figure 24: North America Platelet Aggregation Devices Market Volume (K Units), by Product 2024 & 2032
- Figure 25: North America Platelet Aggregation Devices Market Revenue Share (%), by Product 2024 & 2032
- Figure 26: North America Platelet Aggregation Devices Market Volume Share (%), by Product 2024 & 2032
- Figure 27: North America Platelet Aggregation Devices Market Revenue (Million), by Application 2024 & 2032
- Figure 28: North America Platelet Aggregation Devices Market Volume (K Units), by Application 2024 & 2032
- Figure 29: North America Platelet Aggregation Devices Market Revenue Share (%), by Application 2024 & 2032
- Figure 30: North America Platelet Aggregation Devices Market Volume Share (%), by Application 2024 & 2032
- Figure 31: North America Platelet Aggregation Devices Market Revenue (Million), by End User 2024 & 2032
- Figure 32: North America Platelet Aggregation Devices Market Volume (K Units), by End User 2024 & 2032
- Figure 33: North America Platelet Aggregation Devices Market Revenue Share (%), by End User 2024 & 2032
- Figure 34: North America Platelet Aggregation Devices Market Volume Share (%), by End User 2024 & 2032
- Figure 35: North America Platelet Aggregation Devices Market Revenue (Million), by Country 2024 & 2032
- Figure 36: North America Platelet Aggregation Devices Market Volume (K Units), by Country 2024 & 2032
- Figure 37: North America Platelet Aggregation Devices Market Revenue Share (%), by Country 2024 & 2032
- Figure 38: North America Platelet Aggregation Devices Market Volume Share (%), by Country 2024 & 2032
- Figure 39: Europe Platelet Aggregation Devices Market Revenue (Million), by Product 2024 & 2032
- Figure 40: Europe Platelet Aggregation Devices Market Volume (K Units), by Product 2024 & 2032
- Figure 41: Europe Platelet Aggregation Devices Market Revenue Share (%), by Product 2024 & 2032
- Figure 42: Europe Platelet Aggregation Devices Market Volume Share (%), by Product 2024 & 2032
- Figure 43: Europe Platelet Aggregation Devices Market Revenue (Million), by Application 2024 & 2032
- Figure 44: Europe Platelet Aggregation Devices Market Volume (K Units), by Application 2024 & 2032
- Figure 45: Europe Platelet Aggregation Devices Market Revenue Share (%), by Application 2024 & 2032
- Figure 46: Europe Platelet Aggregation Devices Market Volume Share (%), by Application 2024 & 2032
- Figure 47: Europe Platelet Aggregation Devices Market Revenue (Million), by End User 2024 & 2032
- Figure 48: Europe Platelet Aggregation Devices Market Volume (K Units), by End User 2024 & 2032
- Figure 49: Europe Platelet Aggregation Devices Market Revenue Share (%), by End User 2024 & 2032
- Figure 50: Europe Platelet Aggregation Devices Market Volume Share (%), by End User 2024 & 2032
- Figure 51: Europe Platelet Aggregation Devices Market Revenue (Million), by Country 2024 & 2032
- Figure 52: Europe Platelet Aggregation Devices Market Volume (K Units), by Country 2024 & 2032
- Figure 53: Europe Platelet Aggregation Devices Market Revenue Share (%), by Country 2024 & 2032
- Figure 54: Europe Platelet Aggregation Devices Market Volume Share (%), by Country 2024 & 2032
- Figure 55: Asia Pacific Platelet Aggregation Devices Market Revenue (Million), by Product 2024 & 2032
- Figure 56: Asia Pacific Platelet Aggregation Devices Market Volume (K Units), by Product 2024 & 2032
- Figure 57: Asia Pacific Platelet Aggregation Devices Market Revenue Share (%), by Product 2024 & 2032
- Figure 58: Asia Pacific Platelet Aggregation Devices Market Volume Share (%), by Product 2024 & 2032
- Figure 59: Asia Pacific Platelet Aggregation Devices Market Revenue (Million), by Application 2024 & 2032
- Figure 60: Asia Pacific Platelet Aggregation Devices Market Volume (K Units), by Application 2024 & 2032
- Figure 61: Asia Pacific Platelet Aggregation Devices Market Revenue Share (%), by Application 2024 & 2032
- Figure 62: Asia Pacific Platelet Aggregation Devices Market Volume Share (%), by Application 2024 & 2032
- Figure 63: Asia Pacific Platelet Aggregation Devices Market Revenue (Million), by End User 2024 & 2032
- Figure 64: Asia Pacific Platelet Aggregation Devices Market Volume (K Units), by End User 2024 & 2032
- Figure 65: Asia Pacific Platelet Aggregation Devices Market Revenue Share (%), by End User 2024 & 2032
- Figure 66: Asia Pacific Platelet Aggregation Devices Market Volume Share (%), by End User 2024 & 2032
- Figure 67: Asia Pacific Platelet Aggregation Devices Market Revenue (Million), by Country 2024 & 2032
- Figure 68: Asia Pacific Platelet Aggregation Devices Market Volume (K Units), by Country 2024 & 2032
- Figure 69: Asia Pacific Platelet Aggregation Devices Market Revenue Share (%), by Country 2024 & 2032
- Figure 70: Asia Pacific Platelet Aggregation Devices Market Volume Share (%), by Country 2024 & 2032
- Figure 71: Middle East and Africa Platelet Aggregation Devices Market Revenue (Million), by Product 2024 & 2032
- Figure 72: Middle East and Africa Platelet Aggregation Devices Market Volume (K Units), by Product 2024 & 2032
- Figure 73: Middle East and Africa Platelet Aggregation Devices Market Revenue Share (%), by Product 2024 & 2032
- Figure 74: Middle East and Africa Platelet Aggregation Devices Market Volume Share (%), by Product 2024 & 2032
- Figure 75: Middle East and Africa Platelet Aggregation Devices Market Revenue (Million), by Application 2024 & 2032
- Figure 76: Middle East and Africa Platelet Aggregation Devices Market Volume (K Units), by Application 2024 & 2032
- Figure 77: Middle East and Africa Platelet Aggregation Devices Market Revenue Share (%), by Application 2024 & 2032
- Figure 78: Middle East and Africa Platelet Aggregation Devices Market Volume Share (%), by Application 2024 & 2032
- Figure 79: Middle East and Africa Platelet Aggregation Devices Market Revenue (Million), by End User 2024 & 2032
- Figure 80: Middle East and Africa Platelet Aggregation Devices Market Volume (K Units), by End User 2024 & 2032
- Figure 81: Middle East and Africa Platelet Aggregation Devices Market Revenue Share (%), by End User 2024 & 2032
- Figure 82: Middle East and Africa Platelet Aggregation Devices Market Volume Share (%), by End User 2024 & 2032
- Figure 83: Middle East and Africa Platelet Aggregation Devices Market Revenue (Million), by Country 2024 & 2032
- Figure 84: Middle East and Africa Platelet Aggregation Devices Market Volume (K Units), by Country 2024 & 2032
- Figure 85: Middle East and Africa Platelet Aggregation Devices Market Revenue Share (%), by Country 2024 & 2032
- Figure 86: Middle East and Africa Platelet Aggregation Devices Market Volume Share (%), by Country 2024 & 2032
- Figure 87: South America Platelet Aggregation Devices Market Revenue (Million), by Product 2024 & 2032
- Figure 88: South America Platelet Aggregation Devices Market Volume (K Units), by Product 2024 & 2032
- Figure 89: South America Platelet Aggregation Devices Market Revenue Share (%), by Product 2024 & 2032
- Figure 90: South America Platelet Aggregation Devices Market Volume Share (%), by Product 2024 & 2032
- Figure 91: South America Platelet Aggregation Devices Market Revenue (Million), by Application 2024 & 2032
- Figure 92: South America Platelet Aggregation Devices Market Volume (K Units), by Application 2024 & 2032
- Figure 93: South America Platelet Aggregation Devices Market Revenue Share (%), by Application 2024 & 2032
- Figure 94: South America Platelet Aggregation Devices Market Volume Share (%), by Application 2024 & 2032
- Figure 95: South America Platelet Aggregation Devices Market Revenue (Million), by End User 2024 & 2032
- Figure 96: South America Platelet Aggregation Devices Market Volume (K Units), by End User 2024 & 2032
- Figure 97: South America Platelet Aggregation Devices Market Revenue Share (%), by End User 2024 & 2032
- Figure 98: South America Platelet Aggregation Devices Market Volume Share (%), by End User 2024 & 2032
- Figure 99: South America Platelet Aggregation Devices Market Revenue (Million), by Country 2024 & 2032
- Figure 100: South America Platelet Aggregation Devices Market Volume (K Units), by Country 2024 & 2032
- Figure 101: South America Platelet Aggregation Devices Market Revenue Share (%), by Country 2024 & 2032
- Figure 102: South America Platelet Aggregation Devices Market Volume Share (%), by Country 2024 & 2032
List of Tables
- Table 1: Global Platelet Aggregation Devices Market Revenue Million Forecast, by Region 2019 & 2032
- Table 2: Global Platelet Aggregation Devices Market Volume K Units Forecast, by Region 2019 & 2032
- Table 3: Global Platelet Aggregation Devices Market Revenue Million Forecast, by Product 2019 & 2032
- Table 4: Global Platelet Aggregation Devices Market Volume K Units Forecast, by Product 2019 & 2032
- Table 5: Global Platelet Aggregation Devices Market Revenue Million Forecast, by Application 2019 & 2032
- Table 6: Global Platelet Aggregation Devices Market Volume K Units Forecast, by Application 2019 & 2032
- Table 7: Global Platelet Aggregation Devices Market Revenue Million Forecast, by End User 2019 & 2032
- Table 8: Global Platelet Aggregation Devices Market Volume K Units Forecast, by End User 2019 & 2032
- Table 9: Global Platelet Aggregation Devices Market Revenue Million Forecast, by Region 2019 & 2032
- Table 10: Global Platelet Aggregation Devices Market Volume K Units Forecast, by Region 2019 & 2032
- Table 11: Global Platelet Aggregation Devices Market Revenue Million Forecast, by Country 2019 & 2032
- Table 12: Global Platelet Aggregation Devices Market Volume K Units Forecast, by Country 2019 & 2032
- Table 13: United States Platelet Aggregation Devices Market Revenue (Million) Forecast, by Application 2019 & 2032
- Table 14: United States Platelet Aggregation Devices Market Volume (K Units) Forecast, by Application 2019 & 2032
- Table 15: Canada Platelet Aggregation Devices Market Revenue (Million) Forecast, by Application 2019 & 2032
- Table 16: Canada Platelet Aggregation Devices Market Volume (K Units) Forecast, by Application 2019 & 2032
- Table 17: Mexico Platelet Aggregation Devices Market Revenue (Million) Forecast, by Application 2019 & 2032
- Table 18: Mexico Platelet Aggregation Devices Market Volume (K Units) Forecast, by Application 2019 & 2032
- Table 19: Global Platelet Aggregation Devices Market Revenue Million Forecast, by Country 2019 & 2032
- Table 20: Global Platelet Aggregation Devices Market Volume K Units Forecast, by Country 2019 & 2032
- Table 21: Germany Platelet Aggregation Devices Market Revenue (Million) Forecast, by Application 2019 & 2032
- Table 22: Germany Platelet Aggregation Devices Market Volume (K Units) Forecast, by Application 2019 & 2032
- Table 23: United Kingdom Platelet Aggregation Devices Market Revenue (Million) Forecast, by Application 2019 & 2032
- Table 24: United Kingdom Platelet Aggregation Devices Market Volume (K Units) Forecast, by Application 2019 & 2032
- Table 25: France Platelet Aggregation Devices Market Revenue (Million) Forecast, by Application 2019 & 2032
- Table 26: France Platelet Aggregation Devices Market Volume (K Units) Forecast, by Application 2019 & 2032
- Table 27: Italy Platelet Aggregation Devices Market Revenue (Million) Forecast, by Application 2019 & 2032
- Table 28: Italy Platelet Aggregation Devices Market Volume (K Units) Forecast, by Application 2019 & 2032
- Table 29: Spain Platelet Aggregation Devices Market Revenue (Million) Forecast, by Application 2019 & 2032
- Table 30: Spain Platelet Aggregation Devices Market Volume (K Units) Forecast, by Application 2019 & 2032
- Table 31: Rest of Europe Platelet Aggregation Devices Market Revenue (Million) Forecast, by Application 2019 & 2032
- Table 32: Rest of Europe Platelet Aggregation Devices Market Volume (K Units) Forecast, by Application 2019 & 2032
- Table 33: Global Platelet Aggregation Devices Market Revenue Million Forecast, by Country 2019 & 2032
- Table 34: Global Platelet Aggregation Devices Market Volume K Units Forecast, by Country 2019 & 2032
- Table 35: China Platelet Aggregation Devices Market Revenue (Million) Forecast, by Application 2019 & 2032
- Table 36: China Platelet Aggregation Devices Market Volume (K Units) Forecast, by Application 2019 & 2032
- Table 37: Japan Platelet Aggregation Devices Market Revenue (Million) Forecast, by Application 2019 & 2032
- Table 38: Japan Platelet Aggregation Devices Market Volume (K Units) Forecast, by Application 2019 & 2032
- Table 39: India Platelet Aggregation Devices Market Revenue (Million) Forecast, by Application 2019 & 2032
- Table 40: India Platelet Aggregation Devices Market Volume (K Units) Forecast, by Application 2019 & 2032
- Table 41: Australia Platelet Aggregation Devices Market Revenue (Million) Forecast, by Application 2019 & 2032
- Table 42: Australia Platelet Aggregation Devices Market Volume (K Units) Forecast, by Application 2019 & 2032
- Table 43: South Korea Platelet Aggregation Devices Market Revenue (Million) Forecast, by Application 2019 & 2032
- Table 44: South Korea Platelet Aggregation Devices Market Volume (K Units) Forecast, by Application 2019 & 2032
- Table 45: Rest of Asia Pacific Platelet Aggregation Devices Market Revenue (Million) Forecast, by Application 2019 & 2032
- Table 46: Rest of Asia Pacific Platelet Aggregation Devices Market Volume (K Units) Forecast, by Application 2019 & 2032
- Table 47: Global Platelet Aggregation Devices Market Revenue Million Forecast, by Country 2019 & 2032
- Table 48: Global Platelet Aggregation Devices Market Volume K Units Forecast, by Country 2019 & 2032
- Table 49: GCC Platelet Aggregation Devices Market Revenue (Million) Forecast, by Application 2019 & 2032
- Table 50: GCC Platelet Aggregation Devices Market Volume (K Units) Forecast, by Application 2019 & 2032
- Table 51: South Africa Platelet Aggregation Devices Market Revenue (Million) Forecast, by Application 2019 & 2032
- Table 52: South Africa Platelet Aggregation Devices Market Volume (K Units) Forecast, by Application 2019 & 2032
- Table 53: Rest of Middle East and Africa Platelet Aggregation Devices Market Revenue (Million) Forecast, by Application 2019 & 2032
- Table 54: Rest of Middle East and Africa Platelet Aggregation Devices Market Volume (K Units) Forecast, by Application 2019 & 2032
- Table 55: Global Platelet Aggregation Devices Market Revenue Million Forecast, by Country 2019 & 2032
- Table 56: Global Platelet Aggregation Devices Market Volume K Units Forecast, by Country 2019 & 2032
- Table 57: Brazil Platelet Aggregation Devices Market Revenue (Million) Forecast, by Application 2019 & 2032
- Table 58: Brazil Platelet Aggregation Devices Market Volume (K Units) Forecast, by Application 2019 & 2032
- Table 59: Argentina Platelet Aggregation Devices Market Revenue (Million) Forecast, by Application 2019 & 2032
- Table 60: Argentina Platelet Aggregation Devices Market Volume (K Units) Forecast, by Application 2019 & 2032
- Table 61: Rest of South America Platelet Aggregation Devices Market Revenue (Million) Forecast, by Application 2019 & 2032
- Table 62: Rest of South America Platelet Aggregation Devices Market Volume (K Units) Forecast, by Application 2019 & 2032
- Table 63: Global Platelet Aggregation Devices Market Revenue Million Forecast, by Product 2019 & 2032
- Table 64: Global Platelet Aggregation Devices Market Volume K Units Forecast, by Product 2019 & 2032
- Table 65: Global Platelet Aggregation Devices Market Revenue Million Forecast, by Application 2019 & 2032
- Table 66: Global Platelet Aggregation Devices Market Volume K Units Forecast, by Application 2019 & 2032
- Table 67: Global Platelet Aggregation Devices Market Revenue Million Forecast, by End User 2019 & 2032
- Table 68: Global Platelet Aggregation Devices Market Volume K Units Forecast, by End User 2019 & 2032
- Table 69: Global Platelet Aggregation Devices Market Revenue Million Forecast, by Country 2019 & 2032
- Table 70: Global Platelet Aggregation Devices Market Volume K Units Forecast, by Country 2019 & 2032
- Table 71: United States Platelet Aggregation Devices Market Revenue (Million) Forecast, by Application 2019 & 2032
- Table 72: United States Platelet Aggregation Devices Market Volume (K Units) Forecast, by Application 2019 & 2032
- Table 73: Canada Platelet Aggregation Devices Market Revenue (Million) Forecast, by Application 2019 & 2032
- Table 74: Canada Platelet Aggregation Devices Market Volume (K Units) Forecast, by Application 2019 & 2032
- Table 75: Mexico Platelet Aggregation Devices Market Revenue (Million) Forecast, by Application 2019 & 2032
- Table 76: Mexico Platelet Aggregation Devices Market Volume (K Units) Forecast, by Application 2019 & 2032
- Table 77: Global Platelet Aggregation Devices Market Revenue Million Forecast, by Product 2019 & 2032
- Table 78: Global Platelet Aggregation Devices Market Volume K Units Forecast, by Product 2019 & 2032
- Table 79: Global Platelet Aggregation Devices Market Revenue Million Forecast, by Application 2019 & 2032
- Table 80: Global Platelet Aggregation Devices Market Volume K Units Forecast, by Application 2019 & 2032
- Table 81: Global Platelet Aggregation Devices Market Revenue Million Forecast, by End User 2019 & 2032
- Table 82: Global Platelet Aggregation Devices Market Volume K Units Forecast, by End User 2019 & 2032
- Table 83: Global Platelet Aggregation Devices Market Revenue Million Forecast, by Country 2019 & 2032
- Table 84: Global Platelet Aggregation Devices Market Volume K Units Forecast, by Country 2019 & 2032
- Table 85: Germany Platelet Aggregation Devices Market Revenue (Million) Forecast, by Application 2019 & 2032
- Table 86: Germany Platelet Aggregation Devices Market Volume (K Units) Forecast, by Application 2019 & 2032
- Table 87: United Kingdom Platelet Aggregation Devices Market Revenue (Million) Forecast, by Application 2019 & 2032
- Table 88: United Kingdom Platelet Aggregation Devices Market Volume (K Units) Forecast, by Application 2019 & 2032
- Table 89: France Platelet Aggregation Devices Market Revenue (Million) Forecast, by Application 2019 & 2032
- Table 90: France Platelet Aggregation Devices Market Volume (K Units) Forecast, by Application 2019 & 2032
- Table 91: Italy Platelet Aggregation Devices Market Revenue (Million) Forecast, by Application 2019 & 2032
- Table 92: Italy Platelet Aggregation Devices Market Volume (K Units) Forecast, by Application 2019 & 2032
- Table 93: Spain Platelet Aggregation Devices Market Revenue (Million) Forecast, by Application 2019 & 2032
- Table 94: Spain Platelet Aggregation Devices Market Volume (K Units) Forecast, by Application 2019 & 2032
- Table 95: Rest of Europe Platelet Aggregation Devices Market Revenue (Million) Forecast, by Application 2019 & 2032
- Table 96: Rest of Europe Platelet Aggregation Devices Market Volume (K Units) Forecast, by Application 2019 & 2032
- Table 97: Global Platelet Aggregation Devices Market Revenue Million Forecast, by Product 2019 & 2032
- Table 98: Global Platelet Aggregation Devices Market Volume K Units Forecast, by Product 2019 & 2032
- Table 99: Global Platelet Aggregation Devices Market Revenue Million Forecast, by Application 2019 & 2032
- Table 100: Global Platelet Aggregation Devices Market Volume K Units Forecast, by Application 2019 & 2032
- Table 101: Global Platelet Aggregation Devices Market Revenue Million Forecast, by End User 2019 & 2032
- Table 102: Global Platelet Aggregation Devices Market Volume K Units Forecast, by End User 2019 & 2032
- Table 103: Global Platelet Aggregation Devices Market Revenue Million Forecast, by Country 2019 & 2032
- Table 104: Global Platelet Aggregation Devices Market Volume K Units Forecast, by Country 2019 & 2032
- Table 105: China Platelet Aggregation Devices Market Revenue (Million) Forecast, by Application 2019 & 2032
- Table 106: China Platelet Aggregation Devices Market Volume (K Units) Forecast, by Application 2019 & 2032
- Table 107: Japan Platelet Aggregation Devices Market Revenue (Million) Forecast, by Application 2019 & 2032
- Table 108: Japan Platelet Aggregation Devices Market Volume (K Units) Forecast, by Application 2019 & 2032
- Table 109: India Platelet Aggregation Devices Market Revenue (Million) Forecast, by Application 2019 & 2032
- Table 110: India Platelet Aggregation Devices Market Volume (K Units) Forecast, by Application 2019 & 2032
- Table 111: Australia Platelet Aggregation Devices Market Revenue (Million) Forecast, by Application 2019 & 2032
- Table 112: Australia Platelet Aggregation Devices Market Volume (K Units) Forecast, by Application 2019 & 2032
- Table 113: South Korea Platelet Aggregation Devices Market Revenue (Million) Forecast, by Application 2019 & 2032
- Table 114: South Korea Platelet Aggregation Devices Market Volume (K Units) Forecast, by Application 2019 & 2032
- Table 115: Rest of Asia Pacific Platelet Aggregation Devices Market Revenue (Million) Forecast, by Application 2019 & 2032
- Table 116: Rest of Asia Pacific Platelet Aggregation Devices Market Volume (K Units) Forecast, by Application 2019 & 2032
- Table 117: Global Platelet Aggregation Devices Market Revenue Million Forecast, by Product 2019 & 2032
- Table 118: Global Platelet Aggregation Devices Market Volume K Units Forecast, by Product 2019 & 2032
- Table 119: Global Platelet Aggregation Devices Market Revenue Million Forecast, by Application 2019 & 2032
- Table 120: Global Platelet Aggregation Devices Market Volume K Units Forecast, by Application 2019 & 2032
- Table 121: Global Platelet Aggregation Devices Market Revenue Million Forecast, by End User 2019 & 2032
- Table 122: Global Platelet Aggregation Devices Market Volume K Units Forecast, by End User 2019 & 2032
- Table 123: Global Platelet Aggregation Devices Market Revenue Million Forecast, by Country 2019 & 2032
- Table 124: Global Platelet Aggregation Devices Market Volume K Units Forecast, by Country 2019 & 2032
- Table 125: GCC Platelet Aggregation Devices Market Revenue (Million) Forecast, by Application 2019 & 2032
- Table 126: GCC Platelet Aggregation Devices Market Volume (K Units) Forecast, by Application 2019 & 2032
- Table 127: South Africa Platelet Aggregation Devices Market Revenue (Million) Forecast, by Application 2019 & 2032
- Table 128: South Africa Platelet Aggregation Devices Market Volume (K Units) Forecast, by Application 2019 & 2032
- Table 129: Rest of Middle East and Africa Platelet Aggregation Devices Market Revenue (Million) Forecast, by Application 2019 & 2032
- Table 130: Rest of Middle East and Africa Platelet Aggregation Devices Market Volume (K Units) Forecast, by Application 2019 & 2032
- Table 131: Global Platelet Aggregation Devices Market Revenue Million Forecast, by Product 2019 & 2032
- Table 132: Global Platelet Aggregation Devices Market Volume K Units Forecast, by Product 2019 & 2032
- Table 133: Global Platelet Aggregation Devices Market Revenue Million Forecast, by Application 2019 & 2032
- Table 134: Global Platelet Aggregation Devices Market Volume K Units Forecast, by Application 2019 & 2032
- Table 135: Global Platelet Aggregation Devices Market Revenue Million Forecast, by End User 2019 & 2032
- Table 136: Global Platelet Aggregation Devices Market Volume K Units Forecast, by End User 2019 & 2032
- Table 137: Global Platelet Aggregation Devices Market Revenue Million Forecast, by Country 2019 & 2032
- Table 138: Global Platelet Aggregation Devices Market Volume K Units Forecast, by Country 2019 & 2032
- Table 139: Brazil Platelet Aggregation Devices Market Revenue (Million) Forecast, by Application 2019 & 2032
- Table 140: Brazil Platelet Aggregation Devices Market Volume (K Units) Forecast, by Application 2019 & 2032
- Table 141: Argentina Platelet Aggregation Devices Market Revenue (Million) Forecast, by Application 2019 & 2032
- Table 142: Argentina Platelet Aggregation Devices Market Volume (K Units) Forecast, by Application 2019 & 2032
- Table 143: Rest of South America Platelet Aggregation Devices Market Revenue (Million) Forecast, by Application 2019 & 2032
- Table 144: Rest of South America Platelet Aggregation Devices Market Volume (K Units) Forecast, by Application 2019 & 2032
Frequently Asked Questions
1. What is the projected Compound Annual Growth Rate (CAGR) of the Platelet Aggregation Devices Market?
The projected CAGR is approximately 5.25%.
2. Which companies are prominent players in the Platelet Aggregation Devices Market?
Key companies in the market include Siemens Healthcare GmbH, F Hoffmann-La Roche Ltd, Bio/Data Corporation, Drucker Diagnostics, AggreDyne Inc, Grifols S A , Sienco Inc, Chrono-Log Corporation, Sysmex Corporation, Werfen, Haemonetics Corporation, Heamochrom Diagnostica GmbH.
3. What are the main segments of the Platelet Aggregation Devices Market?
The market segments include Product, Application, End User.
4. Can you provide details about the market size?
The market size is estimated to be USD 621.66 Million as of 2022.
5. What are some drivers contributing to market growth?
Rising Incidence of Chronic Diseases; Increasing Geriatric Population; Technological Advancements in Platelet Aggregometers.
6. What are the notable trends driving market growth?
The Systems Segment is Expected to Witness Notable Growth in the Market Over the Forecast Period.
7. Are there any restraints impacting market growth?
High Cost of Devices and Shortage of Skilled Personnel.
8. Can you provide examples of recent developments in the market?
May 2022: Precision BioLogic Inc., a developer of hemostasis diagnostic products, launched the cryocheck Chromogenic Factor IX assay in Canada, the European Union, the United Kingdom, Australia, and New Zealand.
9. What pricing options are available for accessing the report?
Pricing options include single-user, multi-user, and enterprise licenses priced at USD 4750, USD 5250, and USD 8750 respectively.
10. Is the market size provided in terms of value or volume?
The market size is provided in terms of value, measured in Million and volume, measured in K Units.
11. Are there any specific market keywords associated with the report?
Yes, the market keyword associated with the report is "Platelet Aggregation Devices Market," which aids in identifying and referencing the specific market segment covered.
12. How do I determine which pricing option suits my needs best?
The pricing options vary based on user requirements and access needs. Individual users may opt for single-user licenses, while businesses requiring broader access may choose multi-user or enterprise licenses for cost-effective access to the report.
13. Are there any additional resources or data provided in the Platelet Aggregation Devices Market report?
While the report offers comprehensive insights, it's advisable to review the specific contents or supplementary materials provided to ascertain if additional resources or data are available.
14. How can I stay updated on further developments or reports in the Platelet Aggregation Devices Market?
To stay informed about further developments, trends, and reports in the Platelet Aggregation Devices Market, consider subscribing to industry newsletters, following relevant companies and organizations, or regularly checking reputable industry news sources and publications.
Methodology
Step 1 - Identification of Relevant Samples Size from Population Database


Step 2 - Approaches for Defining Global Market Size (Value, Volume* & Price*)

Note*: In applicable scenarios
Step 3 - Data Sources
Primary Research
- Web Analytics
- Survey Reports
- Research Institute
- Latest Research Reports
- Opinion Leaders
Secondary Research
- Annual Reports
- White Paper
- Latest Press Release
- Industry Association
- Paid Database
- Investor Presentations

Step 4 - Data Triangulation
Involves using different sources of information in order to increase the validity of a study
These sources are likely to be stakeholders in a program - participants, other researchers, program staff, other community members, and so on.
Then we put all data in single framework & apply various statistical tools to find out the dynamic on the market.
During the analysis stage, feedback from the stakeholder groups would be compared to determine areas of agreement as well as areas of divergence


