
Key Insights
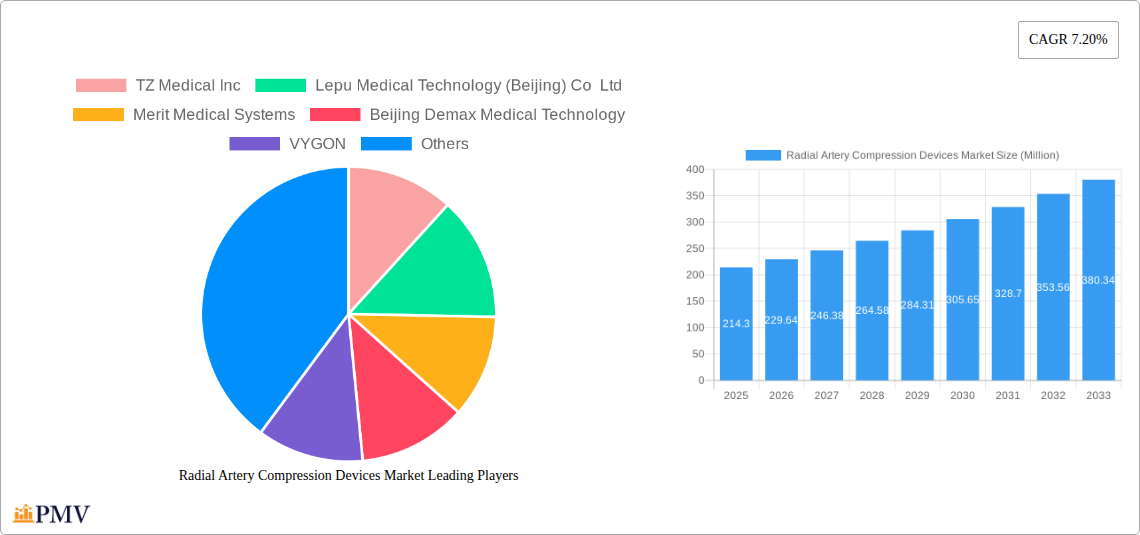
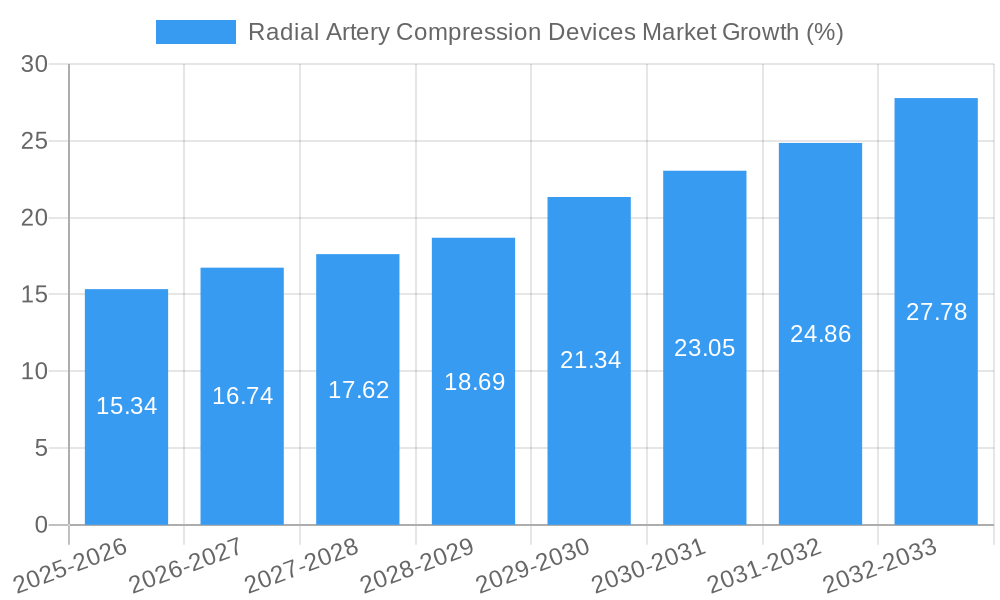
The global radial artery compression devices market is experiencing robust growth, projected to reach \$214.30 million in 2025 and maintain a Compound Annual Growth Rate (CAGR) of 7.20% from 2025 to 2033. This expansion is driven by several key factors. The increasing prevalence of cardiovascular diseases necessitates frequent radial artery access procedures, fueling demand for reliable and efficient compression devices. Advancements in device technology, such as the development of more comfortable and user-friendly designs, are also contributing to market growth. Furthermore, the rising adoption of minimally invasive surgical procedures and the increasing preference for reusable devices over disposable ones are positively impacting market dynamics. The market is segmented by product type (band/strap-based, knob-based, plate-based), usage (replaceable, reusable), application (surgical intervention, diagnostics), and end-user (hospitals, ambulatory surgical centers, others). While the North American market currently holds a significant share, Asia Pacific is poised for substantial growth due to expanding healthcare infrastructure and rising disposable incomes in developing economies.
Growth in the radial artery compression devices market is expected to be influenced by factors such as the increasing prevalence of chronic conditions requiring radial artery access, technological innovations leading to improved device efficacy and patient comfort, and the expanding adoption of minimally invasive surgical techniques. However, challenges such as the high cost of advanced devices and potential risks associated with improper device use might somewhat restrain market expansion. The competitive landscape is marked by the presence of established medical device manufacturers and emerging players, leading to innovation and varied product offerings. Companies are focusing on strategic partnerships, technological advancements, and expansion into new markets to gain a competitive edge. Regional variations in healthcare infrastructure and regulatory frameworks influence market penetration and growth trajectories across different geographical segments.
Radial Artery Compression Devices Market: A Comprehensive Report (2019-2033)
This comprehensive report provides an in-depth analysis of the global Radial Artery Compression Devices market, offering valuable insights for stakeholders across the medical device industry. The study period spans from 2019 to 2033, with 2025 serving as the base and estimated year. The report meticulously examines market dynamics, competitive landscapes, and future growth prospects, incorporating data from the historical period (2019-2024) and forecasting market trends until 2033. The market is segmented by product type (Band/Strap Based, Knob-based, Plate-based), usage (Replaceable Device, Reusable Device), application (Surgical Intervention, Diagnostics), and end-user (Hospitals, Ambulatory Surgical Centers, Other End Users). Key players such as TZ Medical Inc, Lepu Medical Technology (Beijing) Co Ltd, Merit Medical Systems, Beijing Demax Medical Technology, VYGON, Forge Medical, Terumo Corporation, Abbott, Semler Technologies Inc, Teleflex Incorporated, and Advin Health Care are thoroughly analyzed. The report projects a market size of xx Million by 2033.
Radial Artery Compression Devices Market Market Structure & Competitive Dynamics
The global radial artery compression devices market exhibits a moderately concentrated structure, with a few major players holding significant market share. The market is characterized by continuous innovation, driven by the need for improved hemostasis and reduced patient complications. Stringent regulatory frameworks, particularly in developed markets, influence product development and market entry. The presence of substitute products, such as manual compression techniques, presents a competitive challenge, although the advantages of specialized devices in terms of precision and efficiency are driving market growth. End-user trends are shifting towards minimally invasive procedures and improved patient outcomes, fueling demand for advanced compression devices. M&A activities in the medical device sector have been relatively moderate in recent years, with deal values averaging xx Million.
- Market Concentration: High (Top 5 players account for approximately xx% of the market).
- Innovation Ecosystem: Active, with ongoing research and development focusing on improved device design, materials, and functionalities.
- Regulatory Frameworks: Stringent in developed markets (e.g., FDA approvals in the US), influencing market access and product approvals.
- Product Substitutes: Manual compression, representing a significant competitive challenge.
- End-User Trends: Increased adoption of minimally invasive procedures and a growing demand for advanced technology driving adoption of radial artery compression devices.
- M&A Activities: Moderate activity, with average deal values around xx Million in recent years.
Radial Artery Compression Devices Market Industry Trends & Insights
The radial artery compression devices market is experiencing robust growth, driven by factors such as the rising prevalence of cardiovascular diseases requiring arterial access, the increasing preference for minimally invasive procedures, and technological advancements leading to improved device design and functionality. The market's compound annual growth rate (CAGR) is projected to be xx% during the forecast period (2025-2033). This growth is further fueled by rising demand in developing economies and increasing awareness among healthcare professionals about the benefits of radial artery access. Technological disruptions, such as the development of smart compression devices with integrated monitoring capabilities, are further shaping market dynamics. Consumer preferences are shifting towards devices offering enhanced comfort, ease of use, and improved hemostasis. Competitive dynamics are largely influenced by product innovation, pricing strategies, and market penetration efforts. Market penetration of radial artery compression devices in hospitals globally is estimated at xx%.
Dominant Markets & Segments in Radial Artery Compression Devices Market
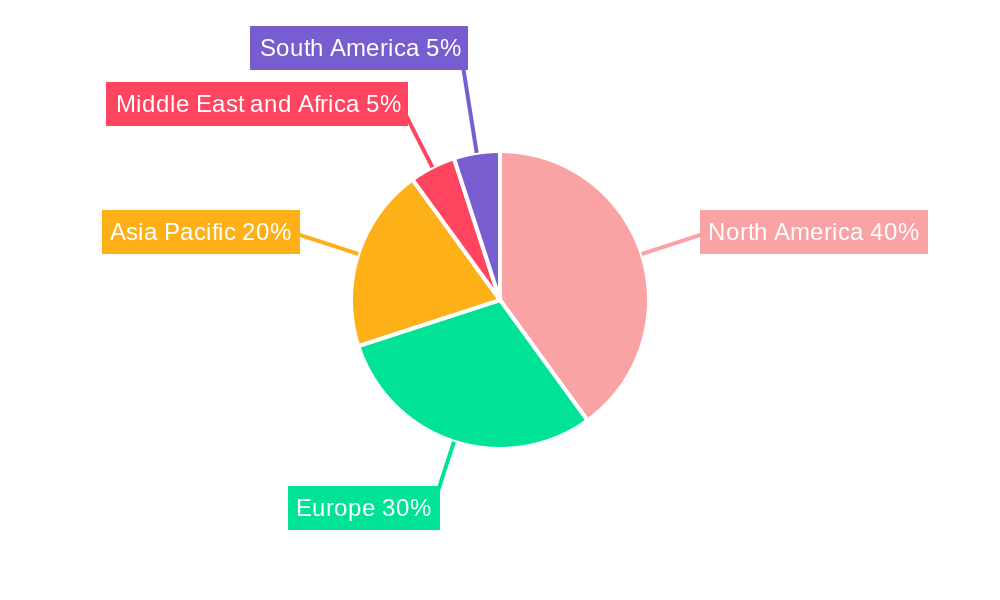
Leading Region: North America currently holds the largest market share, driven by factors such as high adoption rates in hospitals and ambulatory surgical centers, extensive healthcare infrastructure and a favorable regulatory environment.
Dominant Segment (By Product): Band/Strap Based devices currently dominate the market due to their cost-effectiveness and ease of use. However, Knob-based and Plate-based devices are expected to witness significant growth driven by their enhanced features and improved hemostasis.
Dominant Segment (By Usage): Reusable devices currently hold a larger market share compared to replaceable devices. However, replaceable devices are gaining traction due to the growing preference for hygiene and reduced risk of infection.
Dominant Segment (By Application): Surgical interventions account for a significant share due to a large number of cardiac procedures where radial access is preferred.
Dominant Segment (By End User): Hospitals dominate the market due to their higher procedure volumes and readily available expertise in handling these procedures. Ambulatory Surgical Centers are expected to witness significant growth in the coming years owing to the growing adoption of minimally invasive procedures.
Key Drivers:
- North America: Robust healthcare infrastructure, high adoption rates, and favorable regulatory environment.
- Europe: Growing prevalence of cardiovascular diseases and increasing preference for minimally invasive procedures.
- Asia-Pacific: Rising disposable incomes, improving healthcare infrastructure, and increasing awareness about radial artery access are driving market growth.
Radial Artery Compression Devices Market Product Innovations
Recent years have witnessed significant advancements in radial artery compression devices. The focus has been on developing devices that offer improved hemostasis, reduced complications, and enhanced patient comfort. This includes the introduction of innovative materials, designs, and integrated monitoring capabilities. The market is witnessing a shift toward smart devices with features like pressure monitoring and data logging for improved procedural efficacy and reduced post-procedure complications. These innovations cater to the increasing demand for safer, more efficient, and user-friendly radial artery compression devices.
Report Segmentation & Scope
The report segments the radial artery compression devices market by product type (Band/Strap Based, Knob-based, Plate-based), usage (Replaceable Device, Reusable Device), application (Surgical Intervention, Diagnostics), and end-user (Hospitals, Ambulatory Surgical Centers, Other End Users). Each segment is analyzed in detail, providing market size estimations, growth projections, and competitive landscapes. The report offers insights into the market dynamics, growth drivers, and challenges for each segment. For instance, the Band/Strap Based segment is expected to grow at xx% CAGR, while the reusable devices segment is projected to maintain a dominant position with xx% market share.
Key Drivers of Radial Artery Compression Devices Market Growth
The growth of the radial artery compression devices market is driven by several key factors: the increasing prevalence of cardiovascular diseases, the growing adoption of minimally invasive procedures, technological advancements leading to improved device design and functionality, and rising demand in developing economies. Stringent regulatory frameworks are also shaping market dynamics, promoting innovation and ensuring patient safety. The increasing preference for radial artery access over femoral access, due to its lower risk of complications, is significantly boosting market growth.
Challenges in the Radial Artery Compression Devices Market Sector
The radial artery compression devices market faces several challenges, including the stringent regulatory environment, potential supply chain disruptions, and intense competition among existing players. The high cost of some advanced devices can also limit their accessibility. Furthermore, the market faces challenges in educating healthcare professionals about the benefits of using radial artery compression devices over traditional methods. These factors can impact market growth and profitability for individual companies.
Leading Players in the Radial Artery Compression Devices Market Market
- TZ Medical Inc
- Lepu Medical Technology (Beijing) Co Ltd
- Merit Medical Systems
- Beijing Demax Medical Technology
- VYGON
- Forge Medical
- Terumo Corporation
- Abbott
- Semler Technologies Inc
- Teleflex Incorporated
- Advin Health Care
Key Developments in Radial Artery Compression Devices Market Sector
June 2023: TZ Medical introduced Roc Band, a new radial hemostasis band designed to preserve patency. The device offers improved hemostasis and optimized patient recovery times, impacting market competition through enhanced product offerings.
November 2022: Merit Medical Systems launched PreludeSYNC EZ Radial Compression Device in the United States. This unique cinch-style wristband enhances controlled and precise two-handed placement, improving hemostasis and potentially impacting market share due to its improved usability.
Strategic Radial Artery Compression Devices Market Market Outlook
The radial artery compression devices market presents significant growth opportunities in the coming years. Continued innovation, focusing on improved device design, functionality, and ease of use, will be crucial for success. Expanding into emerging markets and focusing on strategic partnerships will also contribute to market growth. The increasing demand for minimally invasive procedures and the growing prevalence of cardiovascular diseases will further drive market expansion. Companies focusing on advanced technologies and strong regulatory compliance are poised to capture a significant market share in the years to come.
Radial Artery Compression Devices Market Segmentation
-
1. Product
- 1.1. Band/Strap Based
- 1.2. Knob-based
- 1.3. Plate-based
-
2. Usage
- 2.1. Replaceable Device
- 2.2. Resuable Device
-
3. Application
- 3.1. Surgical Intervention
- 3.2. Diagnostics
-
4. End User
- 4.1. Hospitals
- 4.2. Ambulatory Surgical Centers
- 4.3. Other End Users
Radial Artery Compression Devices Market Segmentation By Geography
-
1. North America
- 1.1. United States
- 1.2. Canada
- 1.3. Mexico
-
2. Europe
- 2.1. Germany
- 2.2. United Kingdom
- 2.3. France
- 2.4. Italy
- 2.5. Spain
- 2.6. Rest of Europe
-
3. Asia Pacific
- 3.1. China
- 3.2. Japan
- 3.3. India
- 3.4. Australia
- 3.5. South Korea
- 3.6. Rest of Asia Pacific
-
4. Middle East and Africa
- 4.1. GCC
- 4.2. South Africa
- 4.3. Rest of Middle East and Africa
-
5. South America
- 5.1. Brazil
- 5.2. Argentina
- 5.3. Rest of South America
Radial Artery Compression Devices Market REPORT HIGHLIGHTS
| Aspects | Details |
|---|---|
| Study Period | 2019-2033 |
| Base Year | 2024 |
| Estimated Year | 2025 |
| Forecast Period | 2025-2033 |
| Historical Period | 2019-2024 |
| Growth Rate | CAGR of 7.20% from 2019-2033 |
| Segmentation |
|
Table of Contents
- 1. Introduction
- 1.1. Research Scope
- 1.2. Market Segmentation
- 1.3. Research Methodology
- 1.4. Definitions and Assumptions
- 2. Executive Summary
- 2.1. Introduction
- 3. Market Dynamics
- 3.1. Introduction
- 3.2. Market Drivers
- 3.2.1. Increasing Prevelance of Cardiovascular Diseases; Growing Preference for Radial Artery Access
- 3.3. Market Restrains
- 3.3.1. Variability in Reimbursement Policies; Potential Complications at the Access Site
- 3.4. Market Trends
- 3.4.1. Surgical Intervention Application is Expected to Have Significant Growth
- 4. Market Factor Analysis
- 4.1. Porters Five Forces
- 4.2. Supply/Value Chain
- 4.3. PESTEL analysis
- 4.4. Market Entropy
- 4.5. Patent/Trademark Analysis
- 5. Global Radial Artery Compression Devices Market Analysis, Insights and Forecast, 2019-2031
- 5.1. Market Analysis, Insights and Forecast - by Product
- 5.1.1. Band/Strap Based
- 5.1.2. Knob-based
- 5.1.3. Plate-based
- 5.2. Market Analysis, Insights and Forecast - by Usage
- 5.2.1. Replaceable Device
- 5.2.2. Resuable Device
- 5.3. Market Analysis, Insights and Forecast - by Application
- 5.3.1. Surgical Intervention
- 5.3.2. Diagnostics
- 5.4. Market Analysis, Insights and Forecast - by End User
- 5.4.1. Hospitals
- 5.4.2. Ambulatory Surgical Centers
- 5.4.3. Other End Users
- 5.5. Market Analysis, Insights and Forecast - by Region
- 5.5.1. North America
- 5.5.2. Europe
- 5.5.3. Asia Pacific
- 5.5.4. Middle East and Africa
- 5.5.5. South America
- 5.1. Market Analysis, Insights and Forecast - by Product
- 6. North America Radial Artery Compression Devices Market Analysis, Insights and Forecast, 2019-2031
- 6.1. Market Analysis, Insights and Forecast - by Product
- 6.1.1. Band/Strap Based
- 6.1.2. Knob-based
- 6.1.3. Plate-based
- 6.2. Market Analysis, Insights and Forecast - by Usage
- 6.2.1. Replaceable Device
- 6.2.2. Resuable Device
- 6.3. Market Analysis, Insights and Forecast - by Application
- 6.3.1. Surgical Intervention
- 6.3.2. Diagnostics
- 6.4. Market Analysis, Insights and Forecast - by End User
- 6.4.1. Hospitals
- 6.4.2. Ambulatory Surgical Centers
- 6.4.3. Other End Users
- 6.1. Market Analysis, Insights and Forecast - by Product
- 7. Europe Radial Artery Compression Devices Market Analysis, Insights and Forecast, 2019-2031
- 7.1. Market Analysis, Insights and Forecast - by Product
- 7.1.1. Band/Strap Based
- 7.1.2. Knob-based
- 7.1.3. Plate-based
- 7.2. Market Analysis, Insights and Forecast - by Usage
- 7.2.1. Replaceable Device
- 7.2.2. Resuable Device
- 7.3. Market Analysis, Insights and Forecast - by Application
- 7.3.1. Surgical Intervention
- 7.3.2. Diagnostics
- 7.4. Market Analysis, Insights and Forecast - by End User
- 7.4.1. Hospitals
- 7.4.2. Ambulatory Surgical Centers
- 7.4.3. Other End Users
- 7.1. Market Analysis, Insights and Forecast - by Product
- 8. Asia Pacific Radial Artery Compression Devices Market Analysis, Insights and Forecast, 2019-2031
- 8.1. Market Analysis, Insights and Forecast - by Product
- 8.1.1. Band/Strap Based
- 8.1.2. Knob-based
- 8.1.3. Plate-based
- 8.2. Market Analysis, Insights and Forecast - by Usage
- 8.2.1. Replaceable Device
- 8.2.2. Resuable Device
- 8.3. Market Analysis, Insights and Forecast - by Application
- 8.3.1. Surgical Intervention
- 8.3.2. Diagnostics
- 8.4. Market Analysis, Insights and Forecast - by End User
- 8.4.1. Hospitals
- 8.4.2. Ambulatory Surgical Centers
- 8.4.3. Other End Users
- 8.1. Market Analysis, Insights and Forecast - by Product
- 9. Middle East and Africa Radial Artery Compression Devices Market Analysis, Insights and Forecast, 2019-2031
- 9.1. Market Analysis, Insights and Forecast - by Product
- 9.1.1. Band/Strap Based
- 9.1.2. Knob-based
- 9.1.3. Plate-based
- 9.2. Market Analysis, Insights and Forecast - by Usage
- 9.2.1. Replaceable Device
- 9.2.2. Resuable Device
- 9.3. Market Analysis, Insights and Forecast - by Application
- 9.3.1. Surgical Intervention
- 9.3.2. Diagnostics
- 9.4. Market Analysis, Insights and Forecast - by End User
- 9.4.1. Hospitals
- 9.4.2. Ambulatory Surgical Centers
- 9.4.3. Other End Users
- 9.1. Market Analysis, Insights and Forecast - by Product
- 10. South America Radial Artery Compression Devices Market Analysis, Insights and Forecast, 2019-2031
- 10.1. Market Analysis, Insights and Forecast - by Product
- 10.1.1. Band/Strap Based
- 10.1.2. Knob-based
- 10.1.3. Plate-based
- 10.2. Market Analysis, Insights and Forecast - by Usage
- 10.2.1. Replaceable Device
- 10.2.2. Resuable Device
- 10.3. Market Analysis, Insights and Forecast - by Application
- 10.3.1. Surgical Intervention
- 10.3.2. Diagnostics
- 10.4. Market Analysis, Insights and Forecast - by End User
- 10.4.1. Hospitals
- 10.4.2. Ambulatory Surgical Centers
- 10.4.3. Other End Users
- 10.1. Market Analysis, Insights and Forecast - by Product
- 11. North America Radial Artery Compression Devices Market Analysis, Insights and Forecast, 2019-2031
- 11.1. Market Analysis, Insights and Forecast - By Country/Sub-region
- 11.1.1 United States
- 11.1.2 Canada
- 11.1.3 Mexico
- 12. Europe Radial Artery Compression Devices Market Analysis, Insights and Forecast, 2019-2031
- 12.1. Market Analysis, Insights and Forecast - By Country/Sub-region
- 12.1.1 Germany
- 12.1.2 United Kingdom
- 12.1.3 France
- 12.1.4 Italy
- 12.1.5 Spain
- 12.1.6 Rest of Europe
- 13. Asia Pacific Radial Artery Compression Devices Market Analysis, Insights and Forecast, 2019-2031
- 13.1. Market Analysis, Insights and Forecast - By Country/Sub-region
- 13.1.1 China
- 13.1.2 Japan
- 13.1.3 India
- 13.1.4 Australia
- 13.1.5 South Korea
- 13.1.6 Rest of Asia Pacific
- 14. Middle East and Africa Radial Artery Compression Devices Market Analysis, Insights and Forecast, 2019-2031
- 14.1. Market Analysis, Insights and Forecast - By Country/Sub-region
- 14.1.1 GCC
- 14.1.2 South Africa
- 14.1.3 Rest of Middle East and Africa
- 15. South America Radial Artery Compression Devices Market Analysis, Insights and Forecast, 2019-2031
- 15.1. Market Analysis, Insights and Forecast - By Country/Sub-region
- 15.1.1 Brazil
- 15.1.2 Argentina
- 15.1.3 Rest of South America
- 16. Competitive Analysis
- 16.1. Global Market Share Analysis 2024
- 16.2. Company Profiles
- 16.2.1 TZ Medical Inc
- 16.2.1.1. Overview
- 16.2.1.2. Products
- 16.2.1.3. SWOT Analysis
- 16.2.1.4. Recent Developments
- 16.2.1.5. Financials (Based on Availability)
- 16.2.2 Lepu Medical Technology (Beijing) Co Ltd
- 16.2.2.1. Overview
- 16.2.2.2. Products
- 16.2.2.3. SWOT Analysis
- 16.2.2.4. Recent Developments
- 16.2.2.5. Financials (Based on Availability)
- 16.2.3 Merit Medical Systems
- 16.2.3.1. Overview
- 16.2.3.2. Products
- 16.2.3.3. SWOT Analysis
- 16.2.3.4. Recent Developments
- 16.2.3.5. Financials (Based on Availability)
- 16.2.4 Beijing Demax Medical Technology
- 16.2.4.1. Overview
- 16.2.4.2. Products
- 16.2.4.3. SWOT Analysis
- 16.2.4.4. Recent Developments
- 16.2.4.5. Financials (Based on Availability)
- 16.2.5 VYGON
- 16.2.5.1. Overview
- 16.2.5.2. Products
- 16.2.5.3. SWOT Analysis
- 16.2.5.4. Recent Developments
- 16.2.5.5. Financials (Based on Availability)
- 16.2.6 Forge Medical
- 16.2.6.1. Overview
- 16.2.6.2. Products
- 16.2.6.3. SWOT Analysis
- 16.2.6.4. Recent Developments
- 16.2.6.5. Financials (Based on Availability)
- 16.2.7 Terumo Corporation
- 16.2.7.1. Overview
- 16.2.7.2. Products
- 16.2.7.3. SWOT Analysis
- 16.2.7.4. Recent Developments
- 16.2.7.5. Financials (Based on Availability)
- 16.2.8 Abbott
- 16.2.8.1. Overview
- 16.2.8.2. Products
- 16.2.8.3. SWOT Analysis
- 16.2.8.4. Recent Developments
- 16.2.8.5. Financials (Based on Availability)
- 16.2.9 Semler Technologies Inc
- 16.2.9.1. Overview
- 16.2.9.2. Products
- 16.2.9.3. SWOT Analysis
- 16.2.9.4. Recent Developments
- 16.2.9.5. Financials (Based on Availability)
- 16.2.10 Teleflex Incorporated
- 16.2.10.1. Overview
- 16.2.10.2. Products
- 16.2.10.3. SWOT Analysis
- 16.2.10.4. Recent Developments
- 16.2.10.5. Financials (Based on Availability)
- 16.2.11 Advin Health Care
- 16.2.11.1. Overview
- 16.2.11.2. Products
- 16.2.11.3. SWOT Analysis
- 16.2.11.4. Recent Developments
- 16.2.11.5. Financials (Based on Availability)
- 16.2.1 TZ Medical Inc
List of Figures
- Figure 1: Global Radial Artery Compression Devices Market Revenue Breakdown (Million, %) by Region 2024 & 2032
- Figure 2: Global Radial Artery Compression Devices Market Volume Breakdown (K Unit, %) by Region 2024 & 2032
- Figure 3: North America Radial Artery Compression Devices Market Revenue (Million), by Country 2024 & 2032
- Figure 4: North America Radial Artery Compression Devices Market Volume (K Unit), by Country 2024 & 2032
- Figure 5: North America Radial Artery Compression Devices Market Revenue Share (%), by Country 2024 & 2032
- Figure 6: North America Radial Artery Compression Devices Market Volume Share (%), by Country 2024 & 2032
- Figure 7: Europe Radial Artery Compression Devices Market Revenue (Million), by Country 2024 & 2032
- Figure 8: Europe Radial Artery Compression Devices Market Volume (K Unit), by Country 2024 & 2032
- Figure 9: Europe Radial Artery Compression Devices Market Revenue Share (%), by Country 2024 & 2032
- Figure 10: Europe Radial Artery Compression Devices Market Volume Share (%), by Country 2024 & 2032
- Figure 11: Asia Pacific Radial Artery Compression Devices Market Revenue (Million), by Country 2024 & 2032
- Figure 12: Asia Pacific Radial Artery Compression Devices Market Volume (K Unit), by Country 2024 & 2032
- Figure 13: Asia Pacific Radial Artery Compression Devices Market Revenue Share (%), by Country 2024 & 2032
- Figure 14: Asia Pacific Radial Artery Compression Devices Market Volume Share (%), by Country 2024 & 2032
- Figure 15: Middle East and Africa Radial Artery Compression Devices Market Revenue (Million), by Country 2024 & 2032
- Figure 16: Middle East and Africa Radial Artery Compression Devices Market Volume (K Unit), by Country 2024 & 2032
- Figure 17: Middle East and Africa Radial Artery Compression Devices Market Revenue Share (%), by Country 2024 & 2032
- Figure 18: Middle East and Africa Radial Artery Compression Devices Market Volume Share (%), by Country 2024 & 2032
- Figure 19: South America Radial Artery Compression Devices Market Revenue (Million), by Country 2024 & 2032
- Figure 20: South America Radial Artery Compression Devices Market Volume (K Unit), by Country 2024 & 2032
- Figure 21: South America Radial Artery Compression Devices Market Revenue Share (%), by Country 2024 & 2032
- Figure 22: South America Radial Artery Compression Devices Market Volume Share (%), by Country 2024 & 2032
- Figure 23: North America Radial Artery Compression Devices Market Revenue (Million), by Product 2024 & 2032
- Figure 24: North America Radial Artery Compression Devices Market Volume (K Unit), by Product 2024 & 2032
- Figure 25: North America Radial Artery Compression Devices Market Revenue Share (%), by Product 2024 & 2032
- Figure 26: North America Radial Artery Compression Devices Market Volume Share (%), by Product 2024 & 2032
- Figure 27: North America Radial Artery Compression Devices Market Revenue (Million), by Usage 2024 & 2032
- Figure 28: North America Radial Artery Compression Devices Market Volume (K Unit), by Usage 2024 & 2032
- Figure 29: North America Radial Artery Compression Devices Market Revenue Share (%), by Usage 2024 & 2032
- Figure 30: North America Radial Artery Compression Devices Market Volume Share (%), by Usage 2024 & 2032
- Figure 31: North America Radial Artery Compression Devices Market Revenue (Million), by Application 2024 & 2032
- Figure 32: North America Radial Artery Compression Devices Market Volume (K Unit), by Application 2024 & 2032
- Figure 33: North America Radial Artery Compression Devices Market Revenue Share (%), by Application 2024 & 2032
- Figure 34: North America Radial Artery Compression Devices Market Volume Share (%), by Application 2024 & 2032
- Figure 35: North America Radial Artery Compression Devices Market Revenue (Million), by End User 2024 & 2032
- Figure 36: North America Radial Artery Compression Devices Market Volume (K Unit), by End User 2024 & 2032
- Figure 37: North America Radial Artery Compression Devices Market Revenue Share (%), by End User 2024 & 2032
- Figure 38: North America Radial Artery Compression Devices Market Volume Share (%), by End User 2024 & 2032
- Figure 39: North America Radial Artery Compression Devices Market Revenue (Million), by Country 2024 & 2032
- Figure 40: North America Radial Artery Compression Devices Market Volume (K Unit), by Country 2024 & 2032
- Figure 41: North America Radial Artery Compression Devices Market Revenue Share (%), by Country 2024 & 2032
- Figure 42: North America Radial Artery Compression Devices Market Volume Share (%), by Country 2024 & 2032
- Figure 43: Europe Radial Artery Compression Devices Market Revenue (Million), by Product 2024 & 2032
- Figure 44: Europe Radial Artery Compression Devices Market Volume (K Unit), by Product 2024 & 2032
- Figure 45: Europe Radial Artery Compression Devices Market Revenue Share (%), by Product 2024 & 2032
- Figure 46: Europe Radial Artery Compression Devices Market Volume Share (%), by Product 2024 & 2032
- Figure 47: Europe Radial Artery Compression Devices Market Revenue (Million), by Usage 2024 & 2032
- Figure 48: Europe Radial Artery Compression Devices Market Volume (K Unit), by Usage 2024 & 2032
- Figure 49: Europe Radial Artery Compression Devices Market Revenue Share (%), by Usage 2024 & 2032
- Figure 50: Europe Radial Artery Compression Devices Market Volume Share (%), by Usage 2024 & 2032
- Figure 51: Europe Radial Artery Compression Devices Market Revenue (Million), by Application 2024 & 2032
- Figure 52: Europe Radial Artery Compression Devices Market Volume (K Unit), by Application 2024 & 2032
- Figure 53: Europe Radial Artery Compression Devices Market Revenue Share (%), by Application 2024 & 2032
- Figure 54: Europe Radial Artery Compression Devices Market Volume Share (%), by Application 2024 & 2032
- Figure 55: Europe Radial Artery Compression Devices Market Revenue (Million), by End User 2024 & 2032
- Figure 56: Europe Radial Artery Compression Devices Market Volume (K Unit), by End User 2024 & 2032
- Figure 57: Europe Radial Artery Compression Devices Market Revenue Share (%), by End User 2024 & 2032
- Figure 58: Europe Radial Artery Compression Devices Market Volume Share (%), by End User 2024 & 2032
- Figure 59: Europe Radial Artery Compression Devices Market Revenue (Million), by Country 2024 & 2032
- Figure 60: Europe Radial Artery Compression Devices Market Volume (K Unit), by Country 2024 & 2032
- Figure 61: Europe Radial Artery Compression Devices Market Revenue Share (%), by Country 2024 & 2032
- Figure 62: Europe Radial Artery Compression Devices Market Volume Share (%), by Country 2024 & 2032
- Figure 63: Asia Pacific Radial Artery Compression Devices Market Revenue (Million), by Product 2024 & 2032
- Figure 64: Asia Pacific Radial Artery Compression Devices Market Volume (K Unit), by Product 2024 & 2032
- Figure 65: Asia Pacific Radial Artery Compression Devices Market Revenue Share (%), by Product 2024 & 2032
- Figure 66: Asia Pacific Radial Artery Compression Devices Market Volume Share (%), by Product 2024 & 2032
- Figure 67: Asia Pacific Radial Artery Compression Devices Market Revenue (Million), by Usage 2024 & 2032
- Figure 68: Asia Pacific Radial Artery Compression Devices Market Volume (K Unit), by Usage 2024 & 2032
- Figure 69: Asia Pacific Radial Artery Compression Devices Market Revenue Share (%), by Usage 2024 & 2032
- Figure 70: Asia Pacific Radial Artery Compression Devices Market Volume Share (%), by Usage 2024 & 2032
- Figure 71: Asia Pacific Radial Artery Compression Devices Market Revenue (Million), by Application 2024 & 2032
- Figure 72: Asia Pacific Radial Artery Compression Devices Market Volume (K Unit), by Application 2024 & 2032
- Figure 73: Asia Pacific Radial Artery Compression Devices Market Revenue Share (%), by Application 2024 & 2032
- Figure 74: Asia Pacific Radial Artery Compression Devices Market Volume Share (%), by Application 2024 & 2032
- Figure 75: Asia Pacific Radial Artery Compression Devices Market Revenue (Million), by End User 2024 & 2032
- Figure 76: Asia Pacific Radial Artery Compression Devices Market Volume (K Unit), by End User 2024 & 2032
- Figure 77: Asia Pacific Radial Artery Compression Devices Market Revenue Share (%), by End User 2024 & 2032
- Figure 78: Asia Pacific Radial Artery Compression Devices Market Volume Share (%), by End User 2024 & 2032
- Figure 79: Asia Pacific Radial Artery Compression Devices Market Revenue (Million), by Country 2024 & 2032
- Figure 80: Asia Pacific Radial Artery Compression Devices Market Volume (K Unit), by Country 2024 & 2032
- Figure 81: Asia Pacific Radial Artery Compression Devices Market Revenue Share (%), by Country 2024 & 2032
- Figure 82: Asia Pacific Radial Artery Compression Devices Market Volume Share (%), by Country 2024 & 2032
- Figure 83: Middle East and Africa Radial Artery Compression Devices Market Revenue (Million), by Product 2024 & 2032
- Figure 84: Middle East and Africa Radial Artery Compression Devices Market Volume (K Unit), by Product 2024 & 2032
- Figure 85: Middle East and Africa Radial Artery Compression Devices Market Revenue Share (%), by Product 2024 & 2032
- Figure 86: Middle East and Africa Radial Artery Compression Devices Market Volume Share (%), by Product 2024 & 2032
- Figure 87: Middle East and Africa Radial Artery Compression Devices Market Revenue (Million), by Usage 2024 & 2032
- Figure 88: Middle East and Africa Radial Artery Compression Devices Market Volume (K Unit), by Usage 2024 & 2032
- Figure 89: Middle East and Africa Radial Artery Compression Devices Market Revenue Share (%), by Usage 2024 & 2032
- Figure 90: Middle East and Africa Radial Artery Compression Devices Market Volume Share (%), by Usage 2024 & 2032
- Figure 91: Middle East and Africa Radial Artery Compression Devices Market Revenue (Million), by Application 2024 & 2032
- Figure 92: Middle East and Africa Radial Artery Compression Devices Market Volume (K Unit), by Application 2024 & 2032
- Figure 93: Middle East and Africa Radial Artery Compression Devices Market Revenue Share (%), by Application 2024 & 2032
- Figure 94: Middle East and Africa Radial Artery Compression Devices Market Volume Share (%), by Application 2024 & 2032
- Figure 95: Middle East and Africa Radial Artery Compression Devices Market Revenue (Million), by End User 2024 & 2032
- Figure 96: Middle East and Africa Radial Artery Compression Devices Market Volume (K Unit), by End User 2024 & 2032
- Figure 97: Middle East and Africa Radial Artery Compression Devices Market Revenue Share (%), by End User 2024 & 2032
- Figure 98: Middle East and Africa Radial Artery Compression Devices Market Volume Share (%), by End User 2024 & 2032
- Figure 99: Middle East and Africa Radial Artery Compression Devices Market Revenue (Million), by Country 2024 & 2032
- Figure 100: Middle East and Africa Radial Artery Compression Devices Market Volume (K Unit), by Country 2024 & 2032
- Figure 101: Middle East and Africa Radial Artery Compression Devices Market Revenue Share (%), by Country 2024 & 2032
- Figure 102: Middle East and Africa Radial Artery Compression Devices Market Volume Share (%), by Country 2024 & 2032
- Figure 103: South America Radial Artery Compression Devices Market Revenue (Million), by Product 2024 & 2032
- Figure 104: South America Radial Artery Compression Devices Market Volume (K Unit), by Product 2024 & 2032
- Figure 105: South America Radial Artery Compression Devices Market Revenue Share (%), by Product 2024 & 2032
- Figure 106: South America Radial Artery Compression Devices Market Volume Share (%), by Product 2024 & 2032
- Figure 107: South America Radial Artery Compression Devices Market Revenue (Million), by Usage 2024 & 2032
- Figure 108: South America Radial Artery Compression Devices Market Volume (K Unit), by Usage 2024 & 2032
- Figure 109: South America Radial Artery Compression Devices Market Revenue Share (%), by Usage 2024 & 2032
- Figure 110: South America Radial Artery Compression Devices Market Volume Share (%), by Usage 2024 & 2032
- Figure 111: South America Radial Artery Compression Devices Market Revenue (Million), by Application 2024 & 2032
- Figure 112: South America Radial Artery Compression Devices Market Volume (K Unit), by Application 2024 & 2032
- Figure 113: South America Radial Artery Compression Devices Market Revenue Share (%), by Application 2024 & 2032
- Figure 114: South America Radial Artery Compression Devices Market Volume Share (%), by Application 2024 & 2032
- Figure 115: South America Radial Artery Compression Devices Market Revenue (Million), by End User 2024 & 2032
- Figure 116: South America Radial Artery Compression Devices Market Volume (K Unit), by End User 2024 & 2032
- Figure 117: South America Radial Artery Compression Devices Market Revenue Share (%), by End User 2024 & 2032
- Figure 118: South America Radial Artery Compression Devices Market Volume Share (%), by End User 2024 & 2032
- Figure 119: South America Radial Artery Compression Devices Market Revenue (Million), by Country 2024 & 2032
- Figure 120: South America Radial Artery Compression Devices Market Volume (K Unit), by Country 2024 & 2032
- Figure 121: South America Radial Artery Compression Devices Market Revenue Share (%), by Country 2024 & 2032
- Figure 122: South America Radial Artery Compression Devices Market Volume Share (%), by Country 2024 & 2032
List of Tables
- Table 1: Global Radial Artery Compression Devices Market Revenue Million Forecast, by Region 2019 & 2032
- Table 2: Global Radial Artery Compression Devices Market Volume K Unit Forecast, by Region 2019 & 2032
- Table 3: Global Radial Artery Compression Devices Market Revenue Million Forecast, by Product 2019 & 2032
- Table 4: Global Radial Artery Compression Devices Market Volume K Unit Forecast, by Product 2019 & 2032
- Table 5: Global Radial Artery Compression Devices Market Revenue Million Forecast, by Usage 2019 & 2032
- Table 6: Global Radial Artery Compression Devices Market Volume K Unit Forecast, by Usage 2019 & 2032
- Table 7: Global Radial Artery Compression Devices Market Revenue Million Forecast, by Application 2019 & 2032
- Table 8: Global Radial Artery Compression Devices Market Volume K Unit Forecast, by Application 2019 & 2032
- Table 9: Global Radial Artery Compression Devices Market Revenue Million Forecast, by End User 2019 & 2032
- Table 10: Global Radial Artery Compression Devices Market Volume K Unit Forecast, by End User 2019 & 2032
- Table 11: Global Radial Artery Compression Devices Market Revenue Million Forecast, by Region 2019 & 2032
- Table 12: Global Radial Artery Compression Devices Market Volume K Unit Forecast, by Region 2019 & 2032
- Table 13: Global Radial Artery Compression Devices Market Revenue Million Forecast, by Country 2019 & 2032
- Table 14: Global Radial Artery Compression Devices Market Volume K Unit Forecast, by Country 2019 & 2032
- Table 15: United States Radial Artery Compression Devices Market Revenue (Million) Forecast, by Application 2019 & 2032
- Table 16: United States Radial Artery Compression Devices Market Volume (K Unit) Forecast, by Application 2019 & 2032
- Table 17: Canada Radial Artery Compression Devices Market Revenue (Million) Forecast, by Application 2019 & 2032
- Table 18: Canada Radial Artery Compression Devices Market Volume (K Unit) Forecast, by Application 2019 & 2032
- Table 19: Mexico Radial Artery Compression Devices Market Revenue (Million) Forecast, by Application 2019 & 2032
- Table 20: Mexico Radial Artery Compression Devices Market Volume (K Unit) Forecast, by Application 2019 & 2032
- Table 21: Global Radial Artery Compression Devices Market Revenue Million Forecast, by Country 2019 & 2032
- Table 22: Global Radial Artery Compression Devices Market Volume K Unit Forecast, by Country 2019 & 2032
- Table 23: Germany Radial Artery Compression Devices Market Revenue (Million) Forecast, by Application 2019 & 2032
- Table 24: Germany Radial Artery Compression Devices Market Volume (K Unit) Forecast, by Application 2019 & 2032
- Table 25: United Kingdom Radial Artery Compression Devices Market Revenue (Million) Forecast, by Application 2019 & 2032
- Table 26: United Kingdom Radial Artery Compression Devices Market Volume (K Unit) Forecast, by Application 2019 & 2032
- Table 27: France Radial Artery Compression Devices Market Revenue (Million) Forecast, by Application 2019 & 2032
- Table 28: France Radial Artery Compression Devices Market Volume (K Unit) Forecast, by Application 2019 & 2032
- Table 29: Italy Radial Artery Compression Devices Market Revenue (Million) Forecast, by Application 2019 & 2032
- Table 30: Italy Radial Artery Compression Devices Market Volume (K Unit) Forecast, by Application 2019 & 2032
- Table 31: Spain Radial Artery Compression Devices Market Revenue (Million) Forecast, by Application 2019 & 2032
- Table 32: Spain Radial Artery Compression Devices Market Volume (K Unit) Forecast, by Application 2019 & 2032
- Table 33: Rest of Europe Radial Artery Compression Devices Market Revenue (Million) Forecast, by Application 2019 & 2032
- Table 34: Rest of Europe Radial Artery Compression Devices Market Volume (K Unit) Forecast, by Application 2019 & 2032
- Table 35: Global Radial Artery Compression Devices Market Revenue Million Forecast, by Country 2019 & 2032
- Table 36: Global Radial Artery Compression Devices Market Volume K Unit Forecast, by Country 2019 & 2032
- Table 37: China Radial Artery Compression Devices Market Revenue (Million) Forecast, by Application 2019 & 2032
- Table 38: China Radial Artery Compression Devices Market Volume (K Unit) Forecast, by Application 2019 & 2032
- Table 39: Japan Radial Artery Compression Devices Market Revenue (Million) Forecast, by Application 2019 & 2032
- Table 40: Japan Radial Artery Compression Devices Market Volume (K Unit) Forecast, by Application 2019 & 2032
- Table 41: India Radial Artery Compression Devices Market Revenue (Million) Forecast, by Application 2019 & 2032
- Table 42: India Radial Artery Compression Devices Market Volume (K Unit) Forecast, by Application 2019 & 2032
- Table 43: Australia Radial Artery Compression Devices Market Revenue (Million) Forecast, by Application 2019 & 2032
- Table 44: Australia Radial Artery Compression Devices Market Volume (K Unit) Forecast, by Application 2019 & 2032
- Table 45: South Korea Radial Artery Compression Devices Market Revenue (Million) Forecast, by Application 2019 & 2032
- Table 46: South Korea Radial Artery Compression Devices Market Volume (K Unit) Forecast, by Application 2019 & 2032
- Table 47: Rest of Asia Pacific Radial Artery Compression Devices Market Revenue (Million) Forecast, by Application 2019 & 2032
- Table 48: Rest of Asia Pacific Radial Artery Compression Devices Market Volume (K Unit) Forecast, by Application 2019 & 2032
- Table 49: Global Radial Artery Compression Devices Market Revenue Million Forecast, by Country 2019 & 2032
- Table 50: Global Radial Artery Compression Devices Market Volume K Unit Forecast, by Country 2019 & 2032
- Table 51: GCC Radial Artery Compression Devices Market Revenue (Million) Forecast, by Application 2019 & 2032
- Table 52: GCC Radial Artery Compression Devices Market Volume (K Unit) Forecast, by Application 2019 & 2032
- Table 53: South Africa Radial Artery Compression Devices Market Revenue (Million) Forecast, by Application 2019 & 2032
- Table 54: South Africa Radial Artery Compression Devices Market Volume (K Unit) Forecast, by Application 2019 & 2032
- Table 55: Rest of Middle East and Africa Radial Artery Compression Devices Market Revenue (Million) Forecast, by Application 2019 & 2032
- Table 56: Rest of Middle East and Africa Radial Artery Compression Devices Market Volume (K Unit) Forecast, by Application 2019 & 2032
- Table 57: Global Radial Artery Compression Devices Market Revenue Million Forecast, by Country 2019 & 2032
- Table 58: Global Radial Artery Compression Devices Market Volume K Unit Forecast, by Country 2019 & 2032
- Table 59: Brazil Radial Artery Compression Devices Market Revenue (Million) Forecast, by Application 2019 & 2032
- Table 60: Brazil Radial Artery Compression Devices Market Volume (K Unit) Forecast, by Application 2019 & 2032
- Table 61: Argentina Radial Artery Compression Devices Market Revenue (Million) Forecast, by Application 2019 & 2032
- Table 62: Argentina Radial Artery Compression Devices Market Volume (K Unit) Forecast, by Application 2019 & 2032
- Table 63: Rest of South America Radial Artery Compression Devices Market Revenue (Million) Forecast, by Application 2019 & 2032
- Table 64: Rest of South America Radial Artery Compression Devices Market Volume (K Unit) Forecast, by Application 2019 & 2032
- Table 65: Global Radial Artery Compression Devices Market Revenue Million Forecast, by Product 2019 & 2032
- Table 66: Global Radial Artery Compression Devices Market Volume K Unit Forecast, by Product 2019 & 2032
- Table 67: Global Radial Artery Compression Devices Market Revenue Million Forecast, by Usage 2019 & 2032
- Table 68: Global Radial Artery Compression Devices Market Volume K Unit Forecast, by Usage 2019 & 2032
- Table 69: Global Radial Artery Compression Devices Market Revenue Million Forecast, by Application 2019 & 2032
- Table 70: Global Radial Artery Compression Devices Market Volume K Unit Forecast, by Application 2019 & 2032
- Table 71: Global Radial Artery Compression Devices Market Revenue Million Forecast, by End User 2019 & 2032
- Table 72: Global Radial Artery Compression Devices Market Volume K Unit Forecast, by End User 2019 & 2032
- Table 73: Global Radial Artery Compression Devices Market Revenue Million Forecast, by Country 2019 & 2032
- Table 74: Global Radial Artery Compression Devices Market Volume K Unit Forecast, by Country 2019 & 2032
- Table 75: United States Radial Artery Compression Devices Market Revenue (Million) Forecast, by Application 2019 & 2032
- Table 76: United States Radial Artery Compression Devices Market Volume (K Unit) Forecast, by Application 2019 & 2032
- Table 77: Canada Radial Artery Compression Devices Market Revenue (Million) Forecast, by Application 2019 & 2032
- Table 78: Canada Radial Artery Compression Devices Market Volume (K Unit) Forecast, by Application 2019 & 2032
- Table 79: Mexico Radial Artery Compression Devices Market Revenue (Million) Forecast, by Application 2019 & 2032
- Table 80: Mexico Radial Artery Compression Devices Market Volume (K Unit) Forecast, by Application 2019 & 2032
- Table 81: Global Radial Artery Compression Devices Market Revenue Million Forecast, by Product 2019 & 2032
- Table 82: Global Radial Artery Compression Devices Market Volume K Unit Forecast, by Product 2019 & 2032
- Table 83: Global Radial Artery Compression Devices Market Revenue Million Forecast, by Usage 2019 & 2032
- Table 84: Global Radial Artery Compression Devices Market Volume K Unit Forecast, by Usage 2019 & 2032
- Table 85: Global Radial Artery Compression Devices Market Revenue Million Forecast, by Application 2019 & 2032
- Table 86: Global Radial Artery Compression Devices Market Volume K Unit Forecast, by Application 2019 & 2032
- Table 87: Global Radial Artery Compression Devices Market Revenue Million Forecast, by End User 2019 & 2032
- Table 88: Global Radial Artery Compression Devices Market Volume K Unit Forecast, by End User 2019 & 2032
- Table 89: Global Radial Artery Compression Devices Market Revenue Million Forecast, by Country 2019 & 2032
- Table 90: Global Radial Artery Compression Devices Market Volume K Unit Forecast, by Country 2019 & 2032
- Table 91: Germany Radial Artery Compression Devices Market Revenue (Million) Forecast, by Application 2019 & 2032
- Table 92: Germany Radial Artery Compression Devices Market Volume (K Unit) Forecast, by Application 2019 & 2032
- Table 93: United Kingdom Radial Artery Compression Devices Market Revenue (Million) Forecast, by Application 2019 & 2032
- Table 94: United Kingdom Radial Artery Compression Devices Market Volume (K Unit) Forecast, by Application 2019 & 2032
- Table 95: France Radial Artery Compression Devices Market Revenue (Million) Forecast, by Application 2019 & 2032
- Table 96: France Radial Artery Compression Devices Market Volume (K Unit) Forecast, by Application 2019 & 2032
- Table 97: Italy Radial Artery Compression Devices Market Revenue (Million) Forecast, by Application 2019 & 2032
- Table 98: Italy Radial Artery Compression Devices Market Volume (K Unit) Forecast, by Application 2019 & 2032
- Table 99: Spain Radial Artery Compression Devices Market Revenue (Million) Forecast, by Application 2019 & 2032
- Table 100: Spain Radial Artery Compression Devices Market Volume (K Unit) Forecast, by Application 2019 & 2032
- Table 101: Rest of Europe Radial Artery Compression Devices Market Revenue (Million) Forecast, by Application 2019 & 2032
- Table 102: Rest of Europe Radial Artery Compression Devices Market Volume (K Unit) Forecast, by Application 2019 & 2032
- Table 103: Global Radial Artery Compression Devices Market Revenue Million Forecast, by Product 2019 & 2032
- Table 104: Global Radial Artery Compression Devices Market Volume K Unit Forecast, by Product 2019 & 2032
- Table 105: Global Radial Artery Compression Devices Market Revenue Million Forecast, by Usage 2019 & 2032
- Table 106: Global Radial Artery Compression Devices Market Volume K Unit Forecast, by Usage 2019 & 2032
- Table 107: Global Radial Artery Compression Devices Market Revenue Million Forecast, by Application 2019 & 2032
- Table 108: Global Radial Artery Compression Devices Market Volume K Unit Forecast, by Application 2019 & 2032
- Table 109: Global Radial Artery Compression Devices Market Revenue Million Forecast, by End User 2019 & 2032
- Table 110: Global Radial Artery Compression Devices Market Volume K Unit Forecast, by End User 2019 & 2032
- Table 111: Global Radial Artery Compression Devices Market Revenue Million Forecast, by Country 2019 & 2032
- Table 112: Global Radial Artery Compression Devices Market Volume K Unit Forecast, by Country 2019 & 2032
- Table 113: China Radial Artery Compression Devices Market Revenue (Million) Forecast, by Application 2019 & 2032
- Table 114: China Radial Artery Compression Devices Market Volume (K Unit) Forecast, by Application 2019 & 2032
- Table 115: Japan Radial Artery Compression Devices Market Revenue (Million) Forecast, by Application 2019 & 2032
- Table 116: Japan Radial Artery Compression Devices Market Volume (K Unit) Forecast, by Application 2019 & 2032
- Table 117: India Radial Artery Compression Devices Market Revenue (Million) Forecast, by Application 2019 & 2032
- Table 118: India Radial Artery Compression Devices Market Volume (K Unit) Forecast, by Application 2019 & 2032
- Table 119: Australia Radial Artery Compression Devices Market Revenue (Million) Forecast, by Application 2019 & 2032
- Table 120: Australia Radial Artery Compression Devices Market Volume (K Unit) Forecast, by Application 2019 & 2032
- Table 121: South Korea Radial Artery Compression Devices Market Revenue (Million) Forecast, by Application 2019 & 2032
- Table 122: South Korea Radial Artery Compression Devices Market Volume (K Unit) Forecast, by Application 2019 & 2032
- Table 123: Rest of Asia Pacific Radial Artery Compression Devices Market Revenue (Million) Forecast, by Application 2019 & 2032
- Table 124: Rest of Asia Pacific Radial Artery Compression Devices Market Volume (K Unit) Forecast, by Application 2019 & 2032
- Table 125: Global Radial Artery Compression Devices Market Revenue Million Forecast, by Product 2019 & 2032
- Table 126: Global Radial Artery Compression Devices Market Volume K Unit Forecast, by Product 2019 & 2032
- Table 127: Global Radial Artery Compression Devices Market Revenue Million Forecast, by Usage 2019 & 2032
- Table 128: Global Radial Artery Compression Devices Market Volume K Unit Forecast, by Usage 2019 & 2032
- Table 129: Global Radial Artery Compression Devices Market Revenue Million Forecast, by Application 2019 & 2032
- Table 130: Global Radial Artery Compression Devices Market Volume K Unit Forecast, by Application 2019 & 2032
- Table 131: Global Radial Artery Compression Devices Market Revenue Million Forecast, by End User 2019 & 2032
- Table 132: Global Radial Artery Compression Devices Market Volume K Unit Forecast, by End User 2019 & 2032
- Table 133: Global Radial Artery Compression Devices Market Revenue Million Forecast, by Country 2019 & 2032
- Table 134: Global Radial Artery Compression Devices Market Volume K Unit Forecast, by Country 2019 & 2032
- Table 135: GCC Radial Artery Compression Devices Market Revenue (Million) Forecast, by Application 2019 & 2032
- Table 136: GCC Radial Artery Compression Devices Market Volume (K Unit) Forecast, by Application 2019 & 2032
- Table 137: South Africa Radial Artery Compression Devices Market Revenue (Million) Forecast, by Application 2019 & 2032
- Table 138: South Africa Radial Artery Compression Devices Market Volume (K Unit) Forecast, by Application 2019 & 2032
- Table 139: Rest of Middle East and Africa Radial Artery Compression Devices Market Revenue (Million) Forecast, by Application 2019 & 2032
- Table 140: Rest of Middle East and Africa Radial Artery Compression Devices Market Volume (K Unit) Forecast, by Application 2019 & 2032
- Table 141: Global Radial Artery Compression Devices Market Revenue Million Forecast, by Product 2019 & 2032
- Table 142: Global Radial Artery Compression Devices Market Volume K Unit Forecast, by Product 2019 & 2032
- Table 143: Global Radial Artery Compression Devices Market Revenue Million Forecast, by Usage 2019 & 2032
- Table 144: Global Radial Artery Compression Devices Market Volume K Unit Forecast, by Usage 2019 & 2032
- Table 145: Global Radial Artery Compression Devices Market Revenue Million Forecast, by Application 2019 & 2032
- Table 146: Global Radial Artery Compression Devices Market Volume K Unit Forecast, by Application 2019 & 2032
- Table 147: Global Radial Artery Compression Devices Market Revenue Million Forecast, by End User 2019 & 2032
- Table 148: Global Radial Artery Compression Devices Market Volume K Unit Forecast, by End User 2019 & 2032
- Table 149: Global Radial Artery Compression Devices Market Revenue Million Forecast, by Country 2019 & 2032
- Table 150: Global Radial Artery Compression Devices Market Volume K Unit Forecast, by Country 2019 & 2032
- Table 151: Brazil Radial Artery Compression Devices Market Revenue (Million) Forecast, by Application 2019 & 2032
- Table 152: Brazil Radial Artery Compression Devices Market Volume (K Unit) Forecast, by Application 2019 & 2032
- Table 153: Argentina Radial Artery Compression Devices Market Revenue (Million) Forecast, by Application 2019 & 2032
- Table 154: Argentina Radial Artery Compression Devices Market Volume (K Unit) Forecast, by Application 2019 & 2032
- Table 155: Rest of South America Radial Artery Compression Devices Market Revenue (Million) Forecast, by Application 2019 & 2032
- Table 156: Rest of South America Radial Artery Compression Devices Market Volume (K Unit) Forecast, by Application 2019 & 2032
Frequently Asked Questions
1. What is the projected Compound Annual Growth Rate (CAGR) of the Radial Artery Compression Devices Market?
The projected CAGR is approximately 7.20%.
2. Which companies are prominent players in the Radial Artery Compression Devices Market?
Key companies in the market include TZ Medical Inc, Lepu Medical Technology (Beijing) Co Ltd, Merit Medical Systems, Beijing Demax Medical Technology, VYGON, Forge Medical, Terumo Corporation, Abbott, Semler Technologies Inc, Teleflex Incorporated, Advin Health Care.
3. What are the main segments of the Radial Artery Compression Devices Market?
The market segments include Product, Usage, Application, End User.
4. Can you provide details about the market size?
The market size is estimated to be USD 214.30 Million as of 2022.
5. What are some drivers contributing to market growth?
Increasing Prevelance of Cardiovascular Diseases; Growing Preference for Radial Artery Access.
6. What are the notable trends driving market growth?
Surgical Intervention Application is Expected to Have Significant Growth.
7. Are there any restraints impacting market growth?
Variability in Reimbursement Policies; Potential Complications at the Access Site.
8. Can you provide examples of recent developments in the market?
June 2023: TZ Medical introduced Roc Band, a new radial hemostasis band designed to preserve patency. The device provides improved hemostasis and optimized patient recovery times.
9. What pricing options are available for accessing the report?
Pricing options include single-user, multi-user, and enterprise licenses priced at USD 4750, USD 5250, and USD 8750 respectively.
10. Is the market size provided in terms of value or volume?
The market size is provided in terms of value, measured in Million and volume, measured in K Unit.
11. Are there any specific market keywords associated with the report?
Yes, the market keyword associated with the report is "Radial Artery Compression Devices Market," which aids in identifying and referencing the specific market segment covered.
12. How do I determine which pricing option suits my needs best?
The pricing options vary based on user requirements and access needs. Individual users may opt for single-user licenses, while businesses requiring broader access may choose multi-user or enterprise licenses for cost-effective access to the report.
13. Are there any additional resources or data provided in the Radial Artery Compression Devices Market report?
While the report offers comprehensive insights, it's advisable to review the specific contents or supplementary materials provided to ascertain if additional resources or data are available.
14. How can I stay updated on further developments or reports in the Radial Artery Compression Devices Market?
To stay informed about further developments, trends, and reports in the Radial Artery Compression Devices Market, consider subscribing to industry newsletters, following relevant companies and organizations, or regularly checking reputable industry news sources and publications.
Methodology
Step 1 - Identification of Relevant Samples Size from Population Database


Step 2 - Approaches for Defining Global Market Size (Value, Volume* & Price*)

Note*: In applicable scenarios
Step 3 - Data Sources
Primary Research
- Web Analytics
- Survey Reports
- Research Institute
- Latest Research Reports
- Opinion Leaders
Secondary Research
- Annual Reports
- White Paper
- Latest Press Release
- Industry Association
- Paid Database
- Investor Presentations

Step 4 - Data Triangulation
Involves using different sources of information in order to increase the validity of a study
These sources are likely to be stakeholders in a program - participants, other researchers, program staff, other community members, and so on.
Then we put all data in single framework & apply various statistical tools to find out the dynamic on the market.
During the analysis stage, feedback from the stakeholder groups would be compared to determine areas of agreement as well as areas of divergence


