
Key Insights
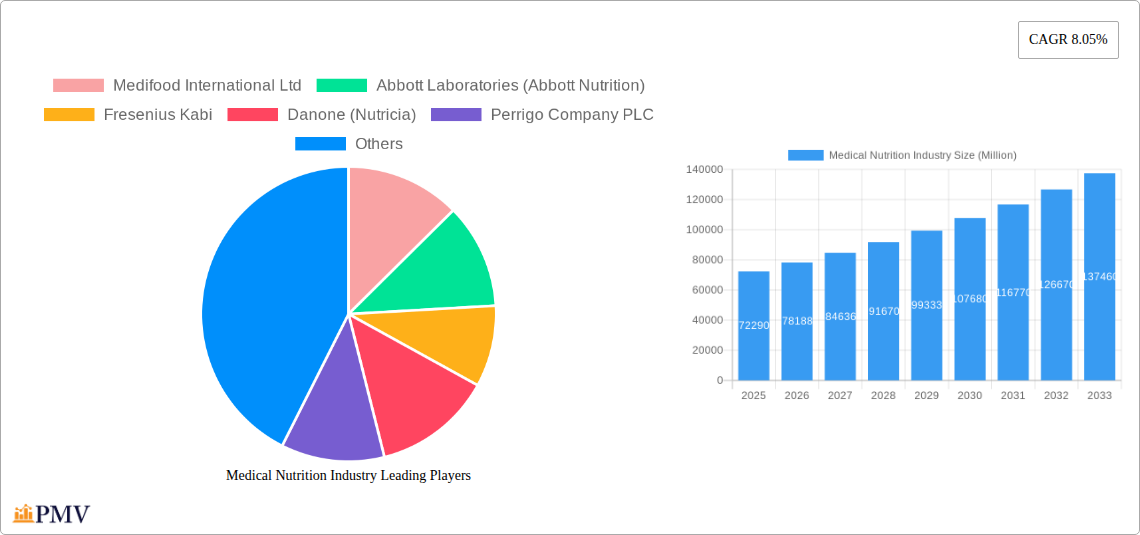
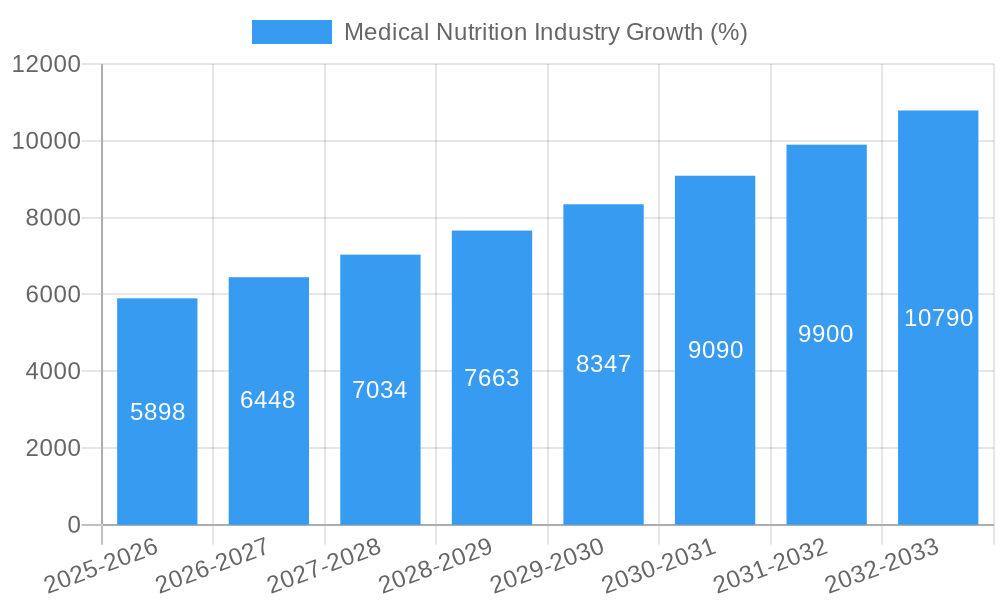
The medical nutrition industry, valued at $72.29 billion in 2025, is experiencing robust growth, projected to expand at a compound annual growth rate (CAGR) of 8.05% from 2025 to 2033. This expansion is driven by several key factors. The rising prevalence of chronic diseases like diabetes, cancer, and gastrointestinal disorders necessitates specialized nutritional support, fueling demand for medical nutrition products. An aging global population further contributes to market growth, as older adults often require nutritional assistance for maintaining health and managing age-related conditions. Advancements in product formulations, including specialized enteral and parenteral nutrition solutions, are also enhancing the efficacy and convenience of medical nutrition therapies, attracting a wider patient base. The increasing awareness among healthcare professionals and patients regarding the importance of proper nutrition in disease management and recovery contributes significantly to market growth. Furthermore, the growing adoption of home healthcare and the increasing preference for convenient and easy-to-administer products drive market expansion.
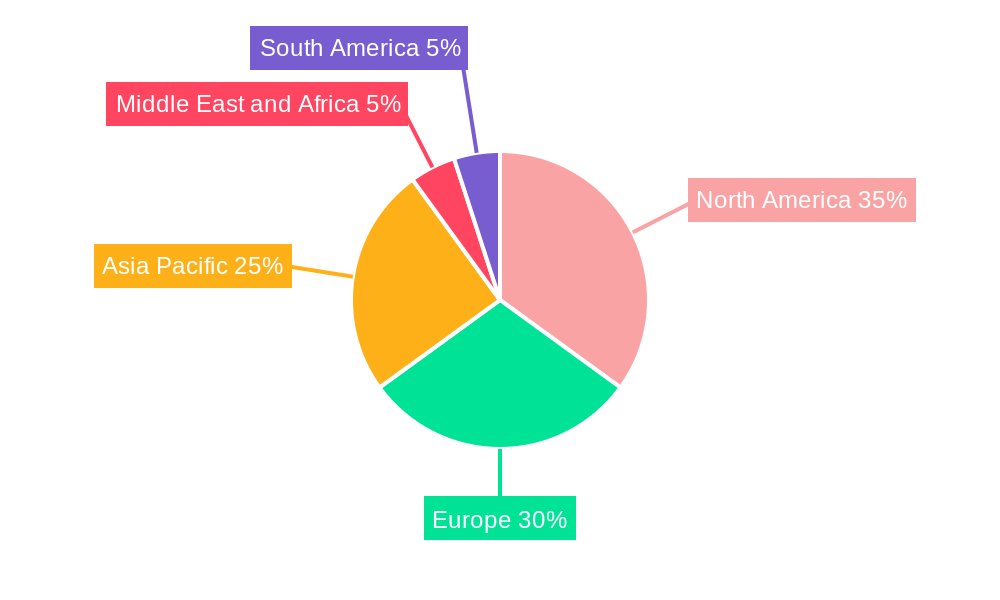
Market segmentation reveals significant opportunities within various application areas. Nutritional support for malnutrition and metabolic disorders represent substantial segments, reflecting the high prevalence of these conditions globally. The pediatric and adult segments within end-user categories demonstrate significant and relatively equal market shares. Oral and enteral routes of administration dominate the market, driven by factors like ease of use and patient preference, although parenteral nutrition remains crucial for patients with severe digestive issues. Geographically, North America and Europe currently hold significant market shares, driven by high healthcare expenditure and advanced medical infrastructure. However, the Asia-Pacific region is expected to witness substantial growth in the coming years, propelled by rising healthcare awareness, economic development, and a growing aging population. Competitive landscape analysis indicates the presence of both large multinational corporations and specialized medical nutrition companies, indicating a dynamic market with diverse product offerings and distribution channels.
Medical Nutrition Industry Market Report: 2019-2033
This comprehensive report provides a detailed analysis of the Medical Nutrition Industry, offering invaluable insights for stakeholders seeking to understand market dynamics, competitive landscapes, and future growth opportunities. The study period covers 2019-2033, with a base year of 2025 and a forecast period of 2025-2033. The report leverages extensive data analysis to project a market valuation exceeding $XX Million by 2033, representing a significant CAGR of XX% during the forecast period.
Medical Nutrition Industry Market Structure & Competitive Dynamics
The Medical Nutrition Industry is characterized by a moderately concentrated market structure, with several key players holding significant market share. Companies like Abbott Laboratories (Abbott Nutrition), Nestle Health Science, and Fresenius Kabi dominate the global landscape, accounting for an estimated XX% of the total market share in 2025. However, the market is witnessing increased competition from smaller, specialized players focusing on niche segments.
The industry's innovation ecosystem is vibrant, with continuous development in areas such as personalized nutrition, advanced delivery systems, and novel nutrient formulations. Regulatory frameworks vary across geographies, influencing product approvals and market access. While few direct substitutes exist for specialized medical nutrition products, competition comes from other therapeutic approaches and alternative dietary strategies. End-user trends, including an aging population and rising prevalence of chronic diseases, drive market growth.
M&A activities have been significant in recent years, with several large players acquiring smaller companies to expand their product portfolios and market reach. The total value of M&A deals in the industry during 2019-2024 exceeded $XX Million, showcasing a dynamic consolidation trend. Examples include [Illustrative examples of M&A activities with deal values, if available. Otherwise, use estimated values (e.g., "a major acquisition valued at approximately $XX Million in 2023")]. This analysis underscores the need for continuous strategic adaptation to navigate the evolving market dynamics and maintain competitiveness within the sector.
Medical Nutrition Industry Industry Trends & Insights
The Medical Nutrition Industry is experiencing robust growth, driven by several key factors. The rising prevalence of chronic diseases like diabetes, obesity, and malnutrition is a significant driver, increasing demand for specialized medical nutrition products. Technological advancements, including personalized nutrition solutions and improved delivery systems, are enhancing product efficacy and market appeal. Changing consumer preferences towards healthier lifestyles and convenient nutrition options fuel market expansion. The global aging population also significantly contributes to industry growth as older adults often require specific nutritional support.
The industry displays strong regional variations in market penetration and growth trajectories. Developed markets show relatively higher market saturation, while emerging economies offer significant untapped potential. The CAGR of the global Medical Nutrition market is estimated to be XX% from 2025 to 2033, with specific segments showcasing even higher growth rates. Competitive dynamics are intense, with companies continually innovating to improve their product offerings and expand their market presence. These factors collectively contribute to the robust and dynamic growth trajectory of the industry.
Dominant Markets & Segments in Medical Nutrition Industry
The Medical Nutrition Industry displays significant diversity across various segments. Analysis reveals that:
Leading Region/Country: North America currently holds the largest market share, driven by high healthcare expenditure, advanced healthcare infrastructure, and a sizable aging population. However, Asia Pacific is projected to experience the fastest growth during the forecast period, fueled by rising disposable incomes and increasing awareness about healthcare.
Dominant Applications:
- Nutritional Support for Malnutrition: This segment holds a significant market share, reflecting the widespread prevalence of malnutrition globally. Growth drivers include improved understanding of malnutrition's impact and increased adoption of effective nutritional interventions.
- Nutritional Support for Metabolic Disorders: The rising prevalence of diabetes and other metabolic disorders drives robust growth in this segment. Demand is fuelled by specialized products addressing specific metabolic needs.
- Other Dominant Application Areas: While malnutrition and metabolic disorders hold significant market share, other applications like gastrointestinal diseases, cancer support, and neurological disease management demonstrate substantial growth potential driven by factors such as population increase, improved diagnosis, and targeted therapeutic developments.
End-User Segments: Both the pediatric and adult segments contribute significantly, with the adult segment representing a larger market share due to the higher prevalence of chronic diseases in this age group.
Route of Administration: Oral and enteral administration dominate the market, owing to their convenience and cost-effectiveness. However, parenteral nutrition, although less prevalent, is crucial for patients requiring specialized support. The key drivers for each segment are detailed within the full report.
Medical Nutrition Industry Product Innovations
Recent innovations include personalized nutrition solutions tailored to individual patient needs, advanced delivery systems improving nutrient absorption, and the development of novel nutrient formulations addressing specific health conditions. These innovations enhance product efficacy and broaden the applicability of medical nutrition products, effectively addressing the demands of a growing and evolving market. The focus is shifting towards convenient formats, improved palatability, and enhanced efficacy, reinforcing their integration into personalized treatment plans.
Report Segmentation & Scope
This report offers a granular segmentation of the Medical Nutrition Industry, encompassing various application areas, end-user groups, and routes of administration. Each segment is analyzed comprehensively, including market size estimations, growth projections, and competitive dynamics. The applications include nutritional support for malnutrition, metabolic disorders, gastrointestinal diseases, cancer, neurological diseases, and other diseases. The end-users are categorized into pediatric and adult populations. The routes of administration include oral and enteral, as well as parenteral methods. Each segment shows varying growth projections based on disease prevalence, technological advancements, and evolving healthcare practices.
Key Drivers of Medical Nutrition Industry Growth
Several key factors drive the Medical Nutrition Industry's growth. These include the escalating prevalence of chronic diseases (e.g., diabetes, obesity, cancer), increasing healthcare expenditure, advancements in nutritional science and product formulation, and an aging global population with increased health concerns. Furthermore, supportive government policies and initiatives promoting preventive healthcare contribute significantly to market expansion.
Challenges in the Medical Nutrition Industry Sector
Challenges include stringent regulatory approvals for new product launches, complexities in supply chain management due to the specialized nature of many products, and intense competition among established players and emerging companies. These factors necessitate strategic planning and adaptive capabilities to overcome these hurdles and maintain sustainable growth within this dynamic market.
Leading Players in the Medical Nutrition Industry Market
- Medifood International Ltd
- Abbott Laboratories (Abbott Nutrition)
- Fresenius Kabi
- Danone (Nutricia)
- Perrigo Company PLC
- Nestle Health Science
- Ajinomoto Cambrooke Inc (Nualtra Ltd)
- AYMES International Ltd
- Baxter Healthcare
- B Braun SE
- Reckitt Benckiser
Key Developments in Medical Nutrition Industry Sector
- October 2022: Hologram Sciences and Maeil Health Nutrition formed a strategic partnership to deliver personalized nutrition solutions to the Korean market, signifying increased focus on tailored nutrition approaches.
- April 2022: Glanbia Nutritionals launched TechVantage, a functionally optimized nutrient technology platform, enhancing the delivery of efficient and innovative nutrition solutions. This underscores the industry's investment in advanced technology platforms.
Strategic Medical Nutrition Industry Market Outlook
The Medical Nutrition Industry exhibits significant long-term growth potential. Continued innovation in product formulation, expansion into emerging markets, and the growing prevalence of chronic diseases will continue to fuel market growth. Strategic opportunities exist for companies focusing on personalized nutrition, advanced delivery systems, and sustainable manufacturing practices. Companies that effectively adapt to evolving consumer preferences and regulatory landscapes are poised to capitalize on the substantial growth opportunities within this dynamic sector.
Medical Nutrition Industry Segmentation
-
1. Route of Administration
- 1.1. Oral and Enteral
- 1.2. Parenteral
-
2. Application
- 2.1. Nutritional Support for Malnutrition
- 2.2. Nutritional Support for Metabolic Disorders
- 2.3. Nutritional Support for Gastrointestinal Diseases
- 2.4. Nutritional Support for Cancer
- 2.5. Nutritional Support in Neurological Diseases
- 2.6. Nutritional Support in Other Diseases
-
3. End User
- 3.1. Pediatric
- 3.2. Adult
Medical Nutrition Industry Segmentation By Geography
-
1. North America
- 1.1. United States
- 1.2. Canada
- 1.3. Mexico
-
2. Europe
- 2.1. Germany
- 2.2. United Kingdom
- 2.3. France
- 2.4. Italy
- 2.5. Spain
- 2.6. Rest of Europe
-
3. Asia Pacific
- 3.1. China
- 3.2. Japan
- 3.3. India
- 3.4. Australia
- 3.5. South Korea
- 3.6. Rest of Asia Pacific
-
4. Middle East and Africa
- 4.1. GCC
- 4.2. South Africa
- 4.3. Rest of Middle East and Africa
-
5. South America
- 5.1. Brazil
- 5.2. Argentina
- 5.3. Rest of South America
Medical Nutrition Industry REPORT HIGHLIGHTS
| Aspects | Details |
|---|---|
| Study Period | 2019-2033 |
| Base Year | 2024 |
| Estimated Year | 2025 |
| Forecast Period | 2025-2033 |
| Historical Period | 2019-2024 |
| Growth Rate | CAGR of 8.05% from 2019-2033 |
| Segmentation |
|
Table of Contents
- 1. Introduction
- 1.1. Research Scope
- 1.2. Market Segmentation
- 1.3. Research Methodology
- 1.4. Definitions and Assumptions
- 2. Executive Summary
- 2.1. Introduction
- 3. Market Dynamics
- 3.1. Introduction
- 3.2. Market Drivers
- 3.2.1. Increasing Prevalence of Metabolic Disorders; High Spending on Healthcare; Growing Geriatric Population
- 3.3. Market Restrains
- 3.3.1. Imprecise Perception About Clinical Nutrition; Reduction in Birth Rates
- 3.4. Market Trends
- 3.4.1. Oral and Enteral Segment is Expected to Hold a Significant Market Share Over the Forecast Period
- 4. Market Factor Analysis
- 4.1. Porters Five Forces
- 4.2. Supply/Value Chain
- 4.3. PESTEL analysis
- 4.4. Market Entropy
- 4.5. Patent/Trademark Analysis
- 5. Global Medical Nutrition Industry Analysis, Insights and Forecast, 2019-2031
- 5.1. Market Analysis, Insights and Forecast - by Route of Administration
- 5.1.1. Oral and Enteral
- 5.1.2. Parenteral
- 5.2. Market Analysis, Insights and Forecast - by Application
- 5.2.1. Nutritional Support for Malnutrition
- 5.2.2. Nutritional Support for Metabolic Disorders
- 5.2.3. Nutritional Support for Gastrointestinal Diseases
- 5.2.4. Nutritional Support for Cancer
- 5.2.5. Nutritional Support in Neurological Diseases
- 5.2.6. Nutritional Support in Other Diseases
- 5.3. Market Analysis, Insights and Forecast - by End User
- 5.3.1. Pediatric
- 5.3.2. Adult
- 5.4. Market Analysis, Insights and Forecast - by Region
- 5.4.1. North America
- 5.4.2. Europe
- 5.4.3. Asia Pacific
- 5.4.4. Middle East and Africa
- 5.4.5. South America
- 5.1. Market Analysis, Insights and Forecast - by Route of Administration
- 6. North America Medical Nutrition Industry Analysis, Insights and Forecast, 2019-2031
- 6.1. Market Analysis, Insights and Forecast - by Route of Administration
- 6.1.1. Oral and Enteral
- 6.1.2. Parenteral
- 6.2. Market Analysis, Insights and Forecast - by Application
- 6.2.1. Nutritional Support for Malnutrition
- 6.2.2. Nutritional Support for Metabolic Disorders
- 6.2.3. Nutritional Support for Gastrointestinal Diseases
- 6.2.4. Nutritional Support for Cancer
- 6.2.5. Nutritional Support in Neurological Diseases
- 6.2.6. Nutritional Support in Other Diseases
- 6.3. Market Analysis, Insights and Forecast - by End User
- 6.3.1. Pediatric
- 6.3.2. Adult
- 6.1. Market Analysis, Insights and Forecast - by Route of Administration
- 7. Europe Medical Nutrition Industry Analysis, Insights and Forecast, 2019-2031
- 7.1. Market Analysis, Insights and Forecast - by Route of Administration
- 7.1.1. Oral and Enteral
- 7.1.2. Parenteral
- 7.2. Market Analysis, Insights and Forecast - by Application
- 7.2.1. Nutritional Support for Malnutrition
- 7.2.2. Nutritional Support for Metabolic Disorders
- 7.2.3. Nutritional Support for Gastrointestinal Diseases
- 7.2.4. Nutritional Support for Cancer
- 7.2.5. Nutritional Support in Neurological Diseases
- 7.2.6. Nutritional Support in Other Diseases
- 7.3. Market Analysis, Insights and Forecast - by End User
- 7.3.1. Pediatric
- 7.3.2. Adult
- 7.1. Market Analysis, Insights and Forecast - by Route of Administration
- 8. Asia Pacific Medical Nutrition Industry Analysis, Insights and Forecast, 2019-2031
- 8.1. Market Analysis, Insights and Forecast - by Route of Administration
- 8.1.1. Oral and Enteral
- 8.1.2. Parenteral
- 8.2. Market Analysis, Insights and Forecast - by Application
- 8.2.1. Nutritional Support for Malnutrition
- 8.2.2. Nutritional Support for Metabolic Disorders
- 8.2.3. Nutritional Support for Gastrointestinal Diseases
- 8.2.4. Nutritional Support for Cancer
- 8.2.5. Nutritional Support in Neurological Diseases
- 8.2.6. Nutritional Support in Other Diseases
- 8.3. Market Analysis, Insights and Forecast - by End User
- 8.3.1. Pediatric
- 8.3.2. Adult
- 8.1. Market Analysis, Insights and Forecast - by Route of Administration
- 9. Middle East and Africa Medical Nutrition Industry Analysis, Insights and Forecast, 2019-2031
- 9.1. Market Analysis, Insights and Forecast - by Route of Administration
- 9.1.1. Oral and Enteral
- 9.1.2. Parenteral
- 9.2. Market Analysis, Insights and Forecast - by Application
- 9.2.1. Nutritional Support for Malnutrition
- 9.2.2. Nutritional Support for Metabolic Disorders
- 9.2.3. Nutritional Support for Gastrointestinal Diseases
- 9.2.4. Nutritional Support for Cancer
- 9.2.5. Nutritional Support in Neurological Diseases
- 9.2.6. Nutritional Support in Other Diseases
- 9.3. Market Analysis, Insights and Forecast - by End User
- 9.3.1. Pediatric
- 9.3.2. Adult
- 9.1. Market Analysis, Insights and Forecast - by Route of Administration
- 10. South America Medical Nutrition Industry Analysis, Insights and Forecast, 2019-2031
- 10.1. Market Analysis, Insights and Forecast - by Route of Administration
- 10.1.1. Oral and Enteral
- 10.1.2. Parenteral
- 10.2. Market Analysis, Insights and Forecast - by Application
- 10.2.1. Nutritional Support for Malnutrition
- 10.2.2. Nutritional Support for Metabolic Disorders
- 10.2.3. Nutritional Support for Gastrointestinal Diseases
- 10.2.4. Nutritional Support for Cancer
- 10.2.5. Nutritional Support in Neurological Diseases
- 10.2.6. Nutritional Support in Other Diseases
- 10.3. Market Analysis, Insights and Forecast - by End User
- 10.3.1. Pediatric
- 10.3.2. Adult
- 10.1. Market Analysis, Insights and Forecast - by Route of Administration
- 11. North America Medical Nutrition Industry Analysis, Insights and Forecast, 2019-2031
- 11.1. Market Analysis, Insights and Forecast - By Country/Sub-region
- 11.1.1. undefined
- 12. Europe Medical Nutrition Industry Analysis, Insights and Forecast, 2019-2031
- 12.1. Market Analysis, Insights and Forecast - By Country/Sub-region
- 12.1.1. undefined
- 13. Asia Pacific Medical Nutrition Industry Analysis, Insights and Forecast, 2019-2031
- 13.1. Market Analysis, Insights and Forecast - By Country/Sub-region
- 13.1.1. undefined
- 14. Middle East and Africa Medical Nutrition Industry Analysis, Insights and Forecast, 2019-2031
- 14.1. Market Analysis, Insights and Forecast - By Country/Sub-region
- 14.1.1. undefined
- 15. South America Medical Nutrition Industry Analysis, Insights and Forecast, 2019-2031
- 15.1. Market Analysis, Insights and Forecast - By Country/Sub-region
- 15.1.1. undefined
- 16. Competitive Analysis
- 16.1. Global Market Share Analysis 2024
- 16.2. Company Profiles
- 16.2.1 Medifood International Ltd
- 16.2.1.1. Overview
- 16.2.1.2. Products
- 16.2.1.3. SWOT Analysis
- 16.2.1.4. Recent Developments
- 16.2.1.5. Financials (Based on Availability)
- 16.2.2 Abbott Laboratories (Abbott Nutrition)
- 16.2.2.1. Overview
- 16.2.2.2. Products
- 16.2.2.3. SWOT Analysis
- 16.2.2.4. Recent Developments
- 16.2.2.5. Financials (Based on Availability)
- 16.2.3 Fresenius Kabi
- 16.2.3.1. Overview
- 16.2.3.2. Products
- 16.2.3.3. SWOT Analysis
- 16.2.3.4. Recent Developments
- 16.2.3.5. Financials (Based on Availability)
- 16.2.4 Danone (Nutricia)
- 16.2.4.1. Overview
- 16.2.4.2. Products
- 16.2.4.3. SWOT Analysis
- 16.2.4.4. Recent Developments
- 16.2.4.5. Financials (Based on Availability)
- 16.2.5 Perrigo Company PLC
- 16.2.5.1. Overview
- 16.2.5.2. Products
- 16.2.5.3. SWOT Analysis
- 16.2.5.4. Recent Developments
- 16.2.5.5. Financials (Based on Availability)
- 16.2.6 Nestle Health Science
- 16.2.6.1. Overview
- 16.2.6.2. Products
- 16.2.6.3. SWOT Analysis
- 16.2.6.4. Recent Developments
- 16.2.6.5. Financials (Based on Availability)
- 16.2.7 Ajinomoto Cambrooke Inc (Nualtra Ltd)
- 16.2.7.1. Overview
- 16.2.7.2. Products
- 16.2.7.3. SWOT Analysis
- 16.2.7.4. Recent Developments
- 16.2.7.5. Financials (Based on Availability)
- 16.2.8 AYMES International Ltd
- 16.2.8.1. Overview
- 16.2.8.2. Products
- 16.2.8.3. SWOT Analysis
- 16.2.8.4. Recent Developments
- 16.2.8.5. Financials (Based on Availability)
- 16.2.9 Baxter Healthcare
- 16.2.9.1. Overview
- 16.2.9.2. Products
- 16.2.9.3. SWOT Analysis
- 16.2.9.4. Recent Developments
- 16.2.9.5. Financials (Based on Availability)
- 16.2.10 B Braun SE
- 16.2.10.1. Overview
- 16.2.10.2. Products
- 16.2.10.3. SWOT Analysis
- 16.2.10.4. Recent Developments
- 16.2.10.5. Financials (Based on Availability)
- 16.2.11 Reckitt Benckiser
- 16.2.11.1. Overview
- 16.2.11.2. Products
- 16.2.11.3. SWOT Analysis
- 16.2.11.4. Recent Developments
- 16.2.11.5. Financials (Based on Availability)
- 16.2.1 Medifood International Ltd
List of Figures
- Figure 1: Global Medical Nutrition Industry Revenue Breakdown (Million, %) by Region 2024 & 2032
- Figure 2: Global Medical Nutrition Industry Volume Breakdown (K Unit, %) by Region 2024 & 2032
- Figure 3: North America Medical Nutrition Industry Revenue (Million), by Country 2024 & 2032
- Figure 4: North America Medical Nutrition Industry Volume (K Unit), by Country 2024 & 2032
- Figure 5: North America Medical Nutrition Industry Revenue Share (%), by Country 2024 & 2032
- Figure 6: North America Medical Nutrition Industry Volume Share (%), by Country 2024 & 2032
- Figure 7: Europe Medical Nutrition Industry Revenue (Million), by Country 2024 & 2032
- Figure 8: Europe Medical Nutrition Industry Volume (K Unit), by Country 2024 & 2032
- Figure 9: Europe Medical Nutrition Industry Revenue Share (%), by Country 2024 & 2032
- Figure 10: Europe Medical Nutrition Industry Volume Share (%), by Country 2024 & 2032
- Figure 11: Asia Pacific Medical Nutrition Industry Revenue (Million), by Country 2024 & 2032
- Figure 12: Asia Pacific Medical Nutrition Industry Volume (K Unit), by Country 2024 & 2032
- Figure 13: Asia Pacific Medical Nutrition Industry Revenue Share (%), by Country 2024 & 2032
- Figure 14: Asia Pacific Medical Nutrition Industry Volume Share (%), by Country 2024 & 2032
- Figure 15: Middle East and Africa Medical Nutrition Industry Revenue (Million), by Country 2024 & 2032
- Figure 16: Middle East and Africa Medical Nutrition Industry Volume (K Unit), by Country 2024 & 2032
- Figure 17: Middle East and Africa Medical Nutrition Industry Revenue Share (%), by Country 2024 & 2032
- Figure 18: Middle East and Africa Medical Nutrition Industry Volume Share (%), by Country 2024 & 2032
- Figure 19: South America Medical Nutrition Industry Revenue (Million), by Country 2024 & 2032
- Figure 20: South America Medical Nutrition Industry Volume (K Unit), by Country 2024 & 2032
- Figure 21: South America Medical Nutrition Industry Revenue Share (%), by Country 2024 & 2032
- Figure 22: South America Medical Nutrition Industry Volume Share (%), by Country 2024 & 2032
- Figure 23: North America Medical Nutrition Industry Revenue (Million), by Route of Administration 2024 & 2032
- Figure 24: North America Medical Nutrition Industry Volume (K Unit), by Route of Administration 2024 & 2032
- Figure 25: North America Medical Nutrition Industry Revenue Share (%), by Route of Administration 2024 & 2032
- Figure 26: North America Medical Nutrition Industry Volume Share (%), by Route of Administration 2024 & 2032
- Figure 27: North America Medical Nutrition Industry Revenue (Million), by Application 2024 & 2032
- Figure 28: North America Medical Nutrition Industry Volume (K Unit), by Application 2024 & 2032
- Figure 29: North America Medical Nutrition Industry Revenue Share (%), by Application 2024 & 2032
- Figure 30: North America Medical Nutrition Industry Volume Share (%), by Application 2024 & 2032
- Figure 31: North America Medical Nutrition Industry Revenue (Million), by End User 2024 & 2032
- Figure 32: North America Medical Nutrition Industry Volume (K Unit), by End User 2024 & 2032
- Figure 33: North America Medical Nutrition Industry Revenue Share (%), by End User 2024 & 2032
- Figure 34: North America Medical Nutrition Industry Volume Share (%), by End User 2024 & 2032
- Figure 35: North America Medical Nutrition Industry Revenue (Million), by Country 2024 & 2032
- Figure 36: North America Medical Nutrition Industry Volume (K Unit), by Country 2024 & 2032
- Figure 37: North America Medical Nutrition Industry Revenue Share (%), by Country 2024 & 2032
- Figure 38: North America Medical Nutrition Industry Volume Share (%), by Country 2024 & 2032
- Figure 39: Europe Medical Nutrition Industry Revenue (Million), by Route of Administration 2024 & 2032
- Figure 40: Europe Medical Nutrition Industry Volume (K Unit), by Route of Administration 2024 & 2032
- Figure 41: Europe Medical Nutrition Industry Revenue Share (%), by Route of Administration 2024 & 2032
- Figure 42: Europe Medical Nutrition Industry Volume Share (%), by Route of Administration 2024 & 2032
- Figure 43: Europe Medical Nutrition Industry Revenue (Million), by Application 2024 & 2032
- Figure 44: Europe Medical Nutrition Industry Volume (K Unit), by Application 2024 & 2032
- Figure 45: Europe Medical Nutrition Industry Revenue Share (%), by Application 2024 & 2032
- Figure 46: Europe Medical Nutrition Industry Volume Share (%), by Application 2024 & 2032
- Figure 47: Europe Medical Nutrition Industry Revenue (Million), by End User 2024 & 2032
- Figure 48: Europe Medical Nutrition Industry Volume (K Unit), by End User 2024 & 2032
- Figure 49: Europe Medical Nutrition Industry Revenue Share (%), by End User 2024 & 2032
- Figure 50: Europe Medical Nutrition Industry Volume Share (%), by End User 2024 & 2032
- Figure 51: Europe Medical Nutrition Industry Revenue (Million), by Country 2024 & 2032
- Figure 52: Europe Medical Nutrition Industry Volume (K Unit), by Country 2024 & 2032
- Figure 53: Europe Medical Nutrition Industry Revenue Share (%), by Country 2024 & 2032
- Figure 54: Europe Medical Nutrition Industry Volume Share (%), by Country 2024 & 2032
- Figure 55: Asia Pacific Medical Nutrition Industry Revenue (Million), by Route of Administration 2024 & 2032
- Figure 56: Asia Pacific Medical Nutrition Industry Volume (K Unit), by Route of Administration 2024 & 2032
- Figure 57: Asia Pacific Medical Nutrition Industry Revenue Share (%), by Route of Administration 2024 & 2032
- Figure 58: Asia Pacific Medical Nutrition Industry Volume Share (%), by Route of Administration 2024 & 2032
- Figure 59: Asia Pacific Medical Nutrition Industry Revenue (Million), by Application 2024 & 2032
- Figure 60: Asia Pacific Medical Nutrition Industry Volume (K Unit), by Application 2024 & 2032
- Figure 61: Asia Pacific Medical Nutrition Industry Revenue Share (%), by Application 2024 & 2032
- Figure 62: Asia Pacific Medical Nutrition Industry Volume Share (%), by Application 2024 & 2032
- Figure 63: Asia Pacific Medical Nutrition Industry Revenue (Million), by End User 2024 & 2032
- Figure 64: Asia Pacific Medical Nutrition Industry Volume (K Unit), by End User 2024 & 2032
- Figure 65: Asia Pacific Medical Nutrition Industry Revenue Share (%), by End User 2024 & 2032
- Figure 66: Asia Pacific Medical Nutrition Industry Volume Share (%), by End User 2024 & 2032
- Figure 67: Asia Pacific Medical Nutrition Industry Revenue (Million), by Country 2024 & 2032
- Figure 68: Asia Pacific Medical Nutrition Industry Volume (K Unit), by Country 2024 & 2032
- Figure 69: Asia Pacific Medical Nutrition Industry Revenue Share (%), by Country 2024 & 2032
- Figure 70: Asia Pacific Medical Nutrition Industry Volume Share (%), by Country 2024 & 2032
- Figure 71: Middle East and Africa Medical Nutrition Industry Revenue (Million), by Route of Administration 2024 & 2032
- Figure 72: Middle East and Africa Medical Nutrition Industry Volume (K Unit), by Route of Administration 2024 & 2032
- Figure 73: Middle East and Africa Medical Nutrition Industry Revenue Share (%), by Route of Administration 2024 & 2032
- Figure 74: Middle East and Africa Medical Nutrition Industry Volume Share (%), by Route of Administration 2024 & 2032
- Figure 75: Middle East and Africa Medical Nutrition Industry Revenue (Million), by Application 2024 & 2032
- Figure 76: Middle East and Africa Medical Nutrition Industry Volume (K Unit), by Application 2024 & 2032
- Figure 77: Middle East and Africa Medical Nutrition Industry Revenue Share (%), by Application 2024 & 2032
- Figure 78: Middle East and Africa Medical Nutrition Industry Volume Share (%), by Application 2024 & 2032
- Figure 79: Middle East and Africa Medical Nutrition Industry Revenue (Million), by End User 2024 & 2032
- Figure 80: Middle East and Africa Medical Nutrition Industry Volume (K Unit), by End User 2024 & 2032
- Figure 81: Middle East and Africa Medical Nutrition Industry Revenue Share (%), by End User 2024 & 2032
- Figure 82: Middle East and Africa Medical Nutrition Industry Volume Share (%), by End User 2024 & 2032
- Figure 83: Middle East and Africa Medical Nutrition Industry Revenue (Million), by Country 2024 & 2032
- Figure 84: Middle East and Africa Medical Nutrition Industry Volume (K Unit), by Country 2024 & 2032
- Figure 85: Middle East and Africa Medical Nutrition Industry Revenue Share (%), by Country 2024 & 2032
- Figure 86: Middle East and Africa Medical Nutrition Industry Volume Share (%), by Country 2024 & 2032
- Figure 87: South America Medical Nutrition Industry Revenue (Million), by Route of Administration 2024 & 2032
- Figure 88: South America Medical Nutrition Industry Volume (K Unit), by Route of Administration 2024 & 2032
- Figure 89: South America Medical Nutrition Industry Revenue Share (%), by Route of Administration 2024 & 2032
- Figure 90: South America Medical Nutrition Industry Volume Share (%), by Route of Administration 2024 & 2032
- Figure 91: South America Medical Nutrition Industry Revenue (Million), by Application 2024 & 2032
- Figure 92: South America Medical Nutrition Industry Volume (K Unit), by Application 2024 & 2032
- Figure 93: South America Medical Nutrition Industry Revenue Share (%), by Application 2024 & 2032
- Figure 94: South America Medical Nutrition Industry Volume Share (%), by Application 2024 & 2032
- Figure 95: South America Medical Nutrition Industry Revenue (Million), by End User 2024 & 2032
- Figure 96: South America Medical Nutrition Industry Volume (K Unit), by End User 2024 & 2032
- Figure 97: South America Medical Nutrition Industry Revenue Share (%), by End User 2024 & 2032
- Figure 98: South America Medical Nutrition Industry Volume Share (%), by End User 2024 & 2032
- Figure 99: South America Medical Nutrition Industry Revenue (Million), by Country 2024 & 2032
- Figure 100: South America Medical Nutrition Industry Volume (K Unit), by Country 2024 & 2032
- Figure 101: South America Medical Nutrition Industry Revenue Share (%), by Country 2024 & 2032
- Figure 102: South America Medical Nutrition Industry Volume Share (%), by Country 2024 & 2032
List of Tables
- Table 1: Global Medical Nutrition Industry Revenue Million Forecast, by Region 2019 & 2032
- Table 2: Global Medical Nutrition Industry Volume K Unit Forecast, by Region 2019 & 2032
- Table 3: Global Medical Nutrition Industry Revenue Million Forecast, by Route of Administration 2019 & 2032
- Table 4: Global Medical Nutrition Industry Volume K Unit Forecast, by Route of Administration 2019 & 2032
- Table 5: Global Medical Nutrition Industry Revenue Million Forecast, by Application 2019 & 2032
- Table 6: Global Medical Nutrition Industry Volume K Unit Forecast, by Application 2019 & 2032
- Table 7: Global Medical Nutrition Industry Revenue Million Forecast, by End User 2019 & 2032
- Table 8: Global Medical Nutrition Industry Volume K Unit Forecast, by End User 2019 & 2032
- Table 9: Global Medical Nutrition Industry Revenue Million Forecast, by Region 2019 & 2032
- Table 10: Global Medical Nutrition Industry Volume K Unit Forecast, by Region 2019 & 2032
- Table 11: Global Medical Nutrition Industry Revenue Million Forecast, by Country 2019 & 2032
- Table 12: Global Medical Nutrition Industry Volume K Unit Forecast, by Country 2019 & 2032
- Table 13: Global Medical Nutrition Industry Revenue Million Forecast, by Country 2019 & 2032
- Table 14: Global Medical Nutrition Industry Volume K Unit Forecast, by Country 2019 & 2032
- Table 15: Global Medical Nutrition Industry Revenue Million Forecast, by Country 2019 & 2032
- Table 16: Global Medical Nutrition Industry Volume K Unit Forecast, by Country 2019 & 2032
- Table 17: Global Medical Nutrition Industry Revenue Million Forecast, by Country 2019 & 2032
- Table 18: Global Medical Nutrition Industry Volume K Unit Forecast, by Country 2019 & 2032
- Table 19: Global Medical Nutrition Industry Revenue Million Forecast, by Country 2019 & 2032
- Table 20: Global Medical Nutrition Industry Volume K Unit Forecast, by Country 2019 & 2032
- Table 21: Global Medical Nutrition Industry Revenue Million Forecast, by Route of Administration 2019 & 2032
- Table 22: Global Medical Nutrition Industry Volume K Unit Forecast, by Route of Administration 2019 & 2032
- Table 23: Global Medical Nutrition Industry Revenue Million Forecast, by Application 2019 & 2032
- Table 24: Global Medical Nutrition Industry Volume K Unit Forecast, by Application 2019 & 2032
- Table 25: Global Medical Nutrition Industry Revenue Million Forecast, by End User 2019 & 2032
- Table 26: Global Medical Nutrition Industry Volume K Unit Forecast, by End User 2019 & 2032
- Table 27: Global Medical Nutrition Industry Revenue Million Forecast, by Country 2019 & 2032
- Table 28: Global Medical Nutrition Industry Volume K Unit Forecast, by Country 2019 & 2032
- Table 29: United States Medical Nutrition Industry Revenue (Million) Forecast, by Application 2019 & 2032
- Table 30: United States Medical Nutrition Industry Volume (K Unit) Forecast, by Application 2019 & 2032
- Table 31: Canada Medical Nutrition Industry Revenue (Million) Forecast, by Application 2019 & 2032
- Table 32: Canada Medical Nutrition Industry Volume (K Unit) Forecast, by Application 2019 & 2032
- Table 33: Mexico Medical Nutrition Industry Revenue (Million) Forecast, by Application 2019 & 2032
- Table 34: Mexico Medical Nutrition Industry Volume (K Unit) Forecast, by Application 2019 & 2032
- Table 35: Global Medical Nutrition Industry Revenue Million Forecast, by Route of Administration 2019 & 2032
- Table 36: Global Medical Nutrition Industry Volume K Unit Forecast, by Route of Administration 2019 & 2032
- Table 37: Global Medical Nutrition Industry Revenue Million Forecast, by Application 2019 & 2032
- Table 38: Global Medical Nutrition Industry Volume K Unit Forecast, by Application 2019 & 2032
- Table 39: Global Medical Nutrition Industry Revenue Million Forecast, by End User 2019 & 2032
- Table 40: Global Medical Nutrition Industry Volume K Unit Forecast, by End User 2019 & 2032
- Table 41: Global Medical Nutrition Industry Revenue Million Forecast, by Country 2019 & 2032
- Table 42: Global Medical Nutrition Industry Volume K Unit Forecast, by Country 2019 & 2032
- Table 43: Germany Medical Nutrition Industry Revenue (Million) Forecast, by Application 2019 & 2032
- Table 44: Germany Medical Nutrition Industry Volume (K Unit) Forecast, by Application 2019 & 2032
- Table 45: United Kingdom Medical Nutrition Industry Revenue (Million) Forecast, by Application 2019 & 2032
- Table 46: United Kingdom Medical Nutrition Industry Volume (K Unit) Forecast, by Application 2019 & 2032
- Table 47: France Medical Nutrition Industry Revenue (Million) Forecast, by Application 2019 & 2032
- Table 48: France Medical Nutrition Industry Volume (K Unit) Forecast, by Application 2019 & 2032
- Table 49: Italy Medical Nutrition Industry Revenue (Million) Forecast, by Application 2019 & 2032
- Table 50: Italy Medical Nutrition Industry Volume (K Unit) Forecast, by Application 2019 & 2032
- Table 51: Spain Medical Nutrition Industry Revenue (Million) Forecast, by Application 2019 & 2032
- Table 52: Spain Medical Nutrition Industry Volume (K Unit) Forecast, by Application 2019 & 2032
- Table 53: Rest of Europe Medical Nutrition Industry Revenue (Million) Forecast, by Application 2019 & 2032
- Table 54: Rest of Europe Medical Nutrition Industry Volume (K Unit) Forecast, by Application 2019 & 2032
- Table 55: Global Medical Nutrition Industry Revenue Million Forecast, by Route of Administration 2019 & 2032
- Table 56: Global Medical Nutrition Industry Volume K Unit Forecast, by Route of Administration 2019 & 2032
- Table 57: Global Medical Nutrition Industry Revenue Million Forecast, by Application 2019 & 2032
- Table 58: Global Medical Nutrition Industry Volume K Unit Forecast, by Application 2019 & 2032
- Table 59: Global Medical Nutrition Industry Revenue Million Forecast, by End User 2019 & 2032
- Table 60: Global Medical Nutrition Industry Volume K Unit Forecast, by End User 2019 & 2032
- Table 61: Global Medical Nutrition Industry Revenue Million Forecast, by Country 2019 & 2032
- Table 62: Global Medical Nutrition Industry Volume K Unit Forecast, by Country 2019 & 2032
- Table 63: China Medical Nutrition Industry Revenue (Million) Forecast, by Application 2019 & 2032
- Table 64: China Medical Nutrition Industry Volume (K Unit) Forecast, by Application 2019 & 2032
- Table 65: Japan Medical Nutrition Industry Revenue (Million) Forecast, by Application 2019 & 2032
- Table 66: Japan Medical Nutrition Industry Volume (K Unit) Forecast, by Application 2019 & 2032
- Table 67: India Medical Nutrition Industry Revenue (Million) Forecast, by Application 2019 & 2032
- Table 68: India Medical Nutrition Industry Volume (K Unit) Forecast, by Application 2019 & 2032
- Table 69: Australia Medical Nutrition Industry Revenue (Million) Forecast, by Application 2019 & 2032
- Table 70: Australia Medical Nutrition Industry Volume (K Unit) Forecast, by Application 2019 & 2032
- Table 71: South Korea Medical Nutrition Industry Revenue (Million) Forecast, by Application 2019 & 2032
- Table 72: South Korea Medical Nutrition Industry Volume (K Unit) Forecast, by Application 2019 & 2032
- Table 73: Rest of Asia Pacific Medical Nutrition Industry Revenue (Million) Forecast, by Application 2019 & 2032
- Table 74: Rest of Asia Pacific Medical Nutrition Industry Volume (K Unit) Forecast, by Application 2019 & 2032
- Table 75: Global Medical Nutrition Industry Revenue Million Forecast, by Route of Administration 2019 & 2032
- Table 76: Global Medical Nutrition Industry Volume K Unit Forecast, by Route of Administration 2019 & 2032
- Table 77: Global Medical Nutrition Industry Revenue Million Forecast, by Application 2019 & 2032
- Table 78: Global Medical Nutrition Industry Volume K Unit Forecast, by Application 2019 & 2032
- Table 79: Global Medical Nutrition Industry Revenue Million Forecast, by End User 2019 & 2032
- Table 80: Global Medical Nutrition Industry Volume K Unit Forecast, by End User 2019 & 2032
- Table 81: Global Medical Nutrition Industry Revenue Million Forecast, by Country 2019 & 2032
- Table 82: Global Medical Nutrition Industry Volume K Unit Forecast, by Country 2019 & 2032
- Table 83: GCC Medical Nutrition Industry Revenue (Million) Forecast, by Application 2019 & 2032
- Table 84: GCC Medical Nutrition Industry Volume (K Unit) Forecast, by Application 2019 & 2032
- Table 85: South Africa Medical Nutrition Industry Revenue (Million) Forecast, by Application 2019 & 2032
- Table 86: South Africa Medical Nutrition Industry Volume (K Unit) Forecast, by Application 2019 & 2032
- Table 87: Rest of Middle East and Africa Medical Nutrition Industry Revenue (Million) Forecast, by Application 2019 & 2032
- Table 88: Rest of Middle East and Africa Medical Nutrition Industry Volume (K Unit) Forecast, by Application 2019 & 2032
- Table 89: Global Medical Nutrition Industry Revenue Million Forecast, by Route of Administration 2019 & 2032
- Table 90: Global Medical Nutrition Industry Volume K Unit Forecast, by Route of Administration 2019 & 2032
- Table 91: Global Medical Nutrition Industry Revenue Million Forecast, by Application 2019 & 2032
- Table 92: Global Medical Nutrition Industry Volume K Unit Forecast, by Application 2019 & 2032
- Table 93: Global Medical Nutrition Industry Revenue Million Forecast, by End User 2019 & 2032
- Table 94: Global Medical Nutrition Industry Volume K Unit Forecast, by End User 2019 & 2032
- Table 95: Global Medical Nutrition Industry Revenue Million Forecast, by Country 2019 & 2032
- Table 96: Global Medical Nutrition Industry Volume K Unit Forecast, by Country 2019 & 2032
- Table 97: Brazil Medical Nutrition Industry Revenue (Million) Forecast, by Application 2019 & 2032
- Table 98: Brazil Medical Nutrition Industry Volume (K Unit) Forecast, by Application 2019 & 2032
- Table 99: Argentina Medical Nutrition Industry Revenue (Million) Forecast, by Application 2019 & 2032
- Table 100: Argentina Medical Nutrition Industry Volume (K Unit) Forecast, by Application 2019 & 2032
- Table 101: Rest of South America Medical Nutrition Industry Revenue (Million) Forecast, by Application 2019 & 2032
- Table 102: Rest of South America Medical Nutrition Industry Volume (K Unit) Forecast, by Application 2019 & 2032
Frequently Asked Questions
1. What is the projected Compound Annual Growth Rate (CAGR) of the Medical Nutrition Industry?
The projected CAGR is approximately 8.05%.
2. Which companies are prominent players in the Medical Nutrition Industry?
Key companies in the market include Medifood International Ltd, Abbott Laboratories (Abbott Nutrition), Fresenius Kabi, Danone (Nutricia), Perrigo Company PLC, Nestle Health Science, Ajinomoto Cambrooke Inc (Nualtra Ltd), AYMES International Ltd, Baxter Healthcare, B Braun SE, Reckitt Benckiser.
3. What are the main segments of the Medical Nutrition Industry?
The market segments include Route of Administration, Application, End User.
4. Can you provide details about the market size?
The market size is estimated to be USD 72.29 Million as of 2022.
5. What are some drivers contributing to market growth?
Increasing Prevalence of Metabolic Disorders; High Spending on Healthcare; Growing Geriatric Population.
6. What are the notable trends driving market growth?
Oral and Enteral Segment is Expected to Hold a Significant Market Share Over the Forecast Period.
7. Are there any restraints impacting market growth?
Imprecise Perception About Clinical Nutrition; Reduction in Birth Rates.
8. Can you provide examples of recent developments in the market?
October 2022: Hologram Sciences, and Maeil Health Nutrition entered into a strategic partnership to deliver personalized nutrition solutions to the Korean market.
9. What pricing options are available for accessing the report?
Pricing options include single-user, multi-user, and enterprise licenses priced at USD 4750, USD 5250, and USD 8750 respectively.
10. Is the market size provided in terms of value or volume?
The market size is provided in terms of value, measured in Million and volume, measured in K Unit.
11. Are there any specific market keywords associated with the report?
Yes, the market keyword associated with the report is "Medical Nutrition Industry," which aids in identifying and referencing the specific market segment covered.
12. How do I determine which pricing option suits my needs best?
The pricing options vary based on user requirements and access needs. Individual users may opt for single-user licenses, while businesses requiring broader access may choose multi-user or enterprise licenses for cost-effective access to the report.
13. Are there any additional resources or data provided in the Medical Nutrition Industry report?
While the report offers comprehensive insights, it's advisable to review the specific contents or supplementary materials provided to ascertain if additional resources or data are available.
14. How can I stay updated on further developments or reports in the Medical Nutrition Industry?
To stay informed about further developments, trends, and reports in the Medical Nutrition Industry, consider subscribing to industry newsletters, following relevant companies and organizations, or regularly checking reputable industry news sources and publications.
Methodology
Step 1 - Identification of Relevant Samples Size from Population Database


Step 2 - Approaches for Defining Global Market Size (Value, Volume* & Price*)

Note*: In applicable scenarios
Step 3 - Data Sources
Primary Research
- Web Analytics
- Survey Reports
- Research Institute
- Latest Research Reports
- Opinion Leaders
Secondary Research
- Annual Reports
- White Paper
- Latest Press Release
- Industry Association
- Paid Database
- Investor Presentations

Step 4 - Data Triangulation
Involves using different sources of information in order to increase the validity of a study
These sources are likely to be stakeholders in a program - participants, other researchers, program staff, other community members, and so on.
Then we put all data in single framework & apply various statistical tools to find out the dynamic on the market.
During the analysis stage, feedback from the stakeholder groups would be compared to determine areas of agreement as well as areas of divergence


