
Key Insights
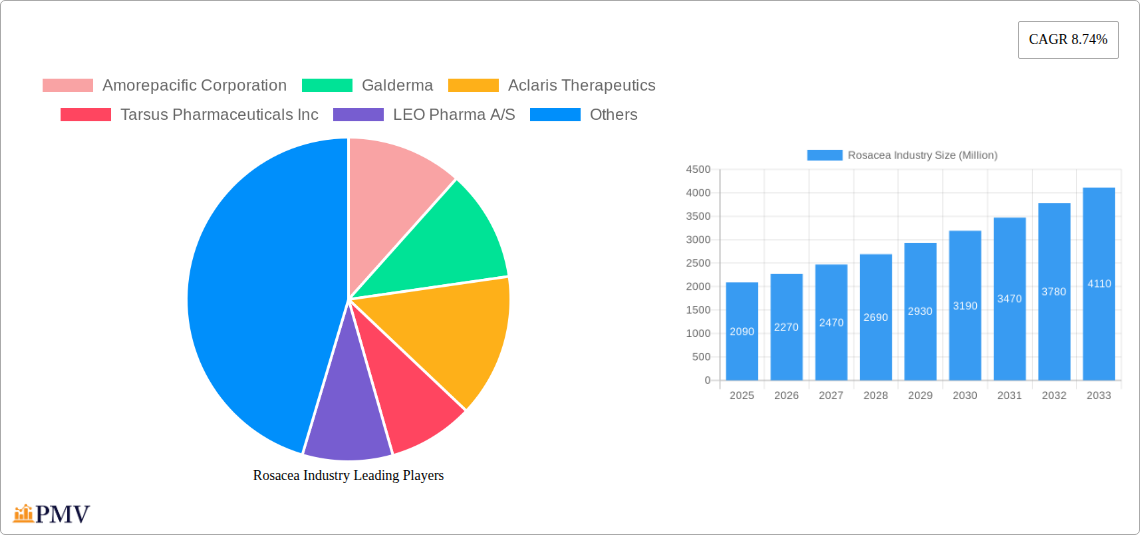
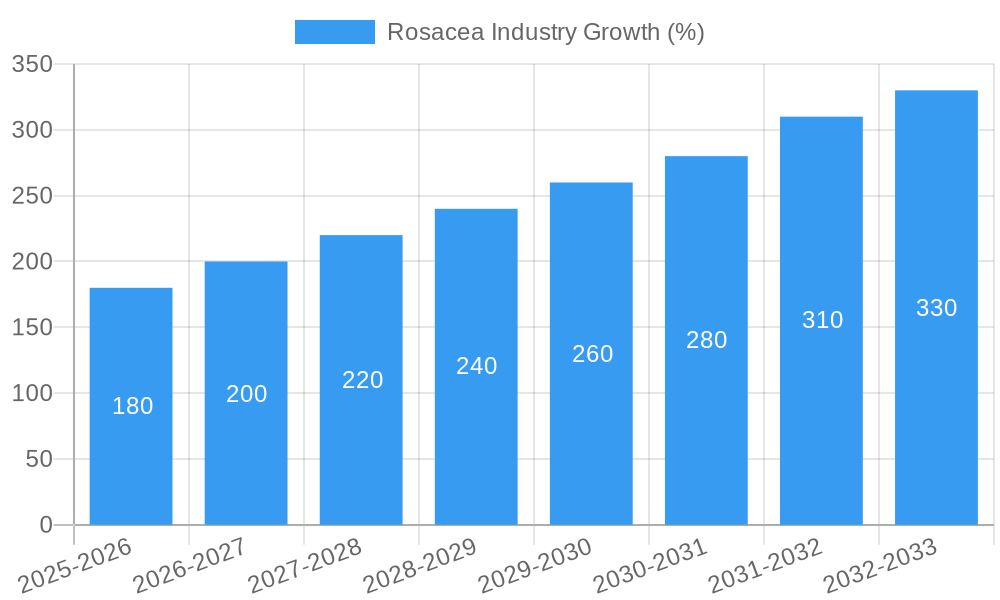
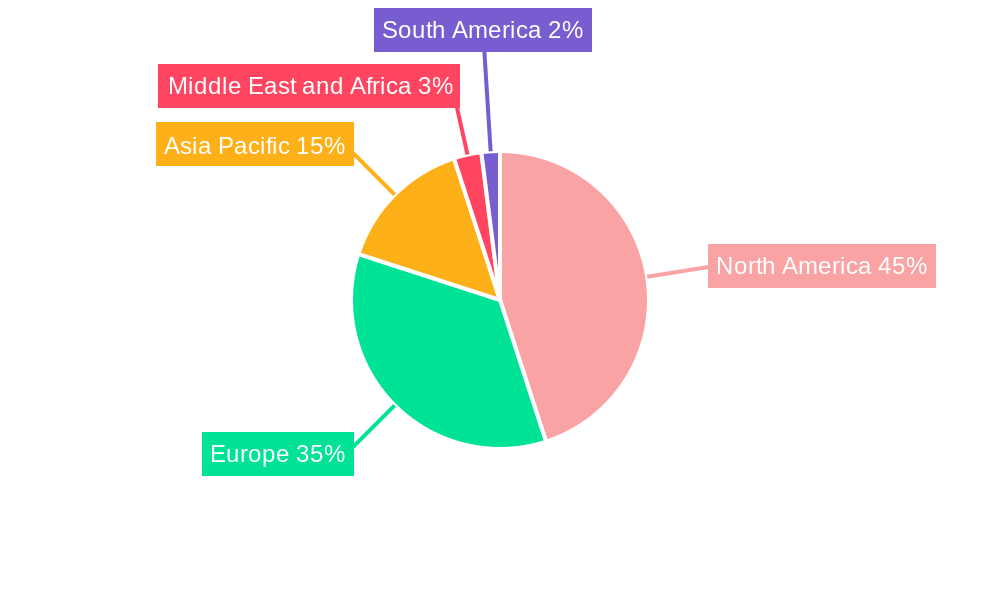
The global rosacea market, valued at $2.09 billion in 2025, is projected to experience robust growth, driven by increasing prevalence of the condition, rising awareness among patients, and advancements in treatment options. The Compound Annual Growth Rate (CAGR) of 8.74% from 2025 to 2033 indicates a significant expansion of the market over the forecast period. Key drivers include the development of novel therapies targeting the underlying inflammatory mechanisms of rosacea, a growing demand for effective topical treatments, and a shift towards personalized medicine approaches tailored to individual patient needs. Market segmentation reveals a substantial portion attributed to topical treatments, reflecting the widespread use of creams and gels for managing symptoms. Antibiotics, Alpha-agonists, retinoids, and corticosteroids currently dominate the drug class segment, although the emergence of newer biologics and targeted therapies holds significant promise for future growth. Geographic analysis suggests North America and Europe currently hold larger market shares due to higher healthcare expenditure and established dermatological infrastructure; however, rapidly growing economies in Asia-Pacific are projected to witness significant expansion in the coming years. Challenges include the lack of a universally effective cure, potential side effects associated with certain treatments, and variations in disease severity and response to therapy.
Despite challenges, the market's growth trajectory is positive. Increasing investment in rosacea research and development, coupled with a greater understanding of disease pathogenesis, is fueling the development of innovative therapies. The rise in teledermatology and remote patient monitoring is also expected to improve access to specialized care and enhance treatment adherence. Furthermore, the increasing availability of over-the-counter and prescription medications through diverse distribution channels contributes to market expansion. Competition among pharmaceutical companies is further stimulating innovation and driving down costs, making treatment more accessible to a broader patient population. The market is poised for further consolidation as companies continue to invest in research and development, seeking to capitalize on the growing unmet medical need. This positive outlook underscores the significant potential of the rosacea market throughout the forecast period.
Rosacea Industry Market Report: 2019-2033
This comprehensive report provides a detailed analysis of the global Rosacea Industry, encompassing market size, competitive landscape, growth drivers, and future outlook. The study period covers 2019-2033, with a base year of 2025 and a forecast period of 2025-2033. The report is meticulously researched, offering actionable insights for industry stakeholders, including pharmaceutical companies, investors, and researchers. The global market value is estimated at $XX Million in 2025, projected to reach $XX Million by 2033, demonstrating a robust CAGR of XX%.
Rosacea Industry Market Structure & Competitive Dynamics
The Rosacea Industry is characterized by a moderately concentrated market structure, with several key players vying for market share. Market concentration is influenced by factors such as R&D investments, regulatory approvals, and successful product launches. Innovation ecosystems are vibrant, with ongoing research into novel drug classes and formulations to address unmet clinical needs. The regulatory landscape, particularly in major markets like the US and Europe, plays a crucial role in shaping market dynamics. Product substitutes, including over-the-counter treatments and traditional remedies, pose a competitive challenge to established players. End-user trends, including rising awareness of rosacea and demand for effective, safe treatments, drive market growth. M&A activity in the sector has been moderate, with deal values ranging from $XX Million to $XX Million in recent years. Key examples include strategic acquisitions aimed at expanding product portfolios and gaining access to new technologies.
- Market Share: Amorepacific Corporation holds an estimated XX% market share, followed by Galderma at XX%.
- M&A Activity: Recent deals have focused on expanding geographical reach and therapeutic areas within dermatology.
Rosacea Industry Industry Trends & Insights
The Rosacea Industry is witnessing robust growth, fueled by several factors. Rising prevalence of rosacea globally, coupled with increased awareness and diagnosis rates, is a major growth driver. Technological advancements in drug delivery systems, such as topical nanocarriers and microneedle patches, are improving treatment efficacy and patient compliance. Consumer preferences are shifting towards personalized treatments and non-invasive options. The competitive landscape is dynamic, with ongoing research and development leading to the introduction of novel therapies and improved formulations. The market experienced a CAGR of XX% during the historical period (2019-2024) and is projected to maintain a healthy CAGR of XX% during the forecast period (2025-2033). Market penetration of prescription rosacea treatments remains relatively low, indicating significant untapped potential for growth.
Dominant Markets & Segments in Rosacea Industry
The North American market currently dominates the global Rosacea Industry, driven by high healthcare expenditure, robust regulatory frameworks, and a significant patient pool. Within drug classes, topical antibiotics currently hold the largest market share, but the retinoid segment is experiencing rapid growth due to the efficacy and tolerability of newer formulations. Topical administration remains the preferred mode of delivery, although oral medications continue to play a role in managing severe cases.
Key Drivers of Regional Dominance:
- North America: High healthcare expenditure, advanced healthcare infrastructure, and strong regulatory support.
- Europe: Increasing prevalence of rosacea, coupled with rising awareness and adoption of modern treatments.
Segmental Dominance:
- By Drug Class: Topical Antibiotics represent the largest market segment, followed by topical retinoids, reflecting their efficacy and widespread use.
- By Mode of Administration: Topical formulations account for the majority of the market, owing to their convenience and lower systemic side-effect profiles.
Rosacea Industry Product Innovations
Recent advancements in rosacea treatments focus on improved efficacy, enhanced tolerability, and novel drug delivery systems. New formulations combine existing drug classes to enhance therapeutic outcomes. Nanotechnology-based drug delivery systems are gaining traction for their ability to target specific skin layers, minimizing side effects and maximizing efficacy. The market also witnesses an increased focus on personalized medicine approaches, offering tailored treatments based on individual patient needs and genetic profiles.
Report Segmentation & Scope
This report segments the Rosacea Industry market based on drug class (Antibiotics, Alpha Agonists, Retinoids, Corticosteroids, Immunosuppressants, Other Drug Classes) and mode of administration (Topical, Oral). Each segment is analyzed in detail, providing market size estimations, growth projections, and competitive dynamics. Growth projections vary across segments, reflecting differences in therapeutic efficacy and market acceptance.
Key Drivers of Rosacea Industry Growth
Several factors contribute to the Rosacea Industry's growth. The rising prevalence of rosacea globally is a major driver, as is increased awareness and improved diagnostic capabilities. Technological innovations, such as novel drug delivery systems, also contribute significantly. Favorable regulatory environments in key markets and increased investment in R&D further accelerate market growth.
Challenges in the Rosacea Industry Sector
Despite significant market potential, challenges persist. Regulatory hurdles for new drug approvals can be substantial, impacting the speed of innovation. Supply chain disruptions can impact product availability and pricing. Competition from generic drugs and over-the-counter treatments also poses a challenge. These challenges may affect market growth rate by an estimated XX% in the coming years.
Leading Players in the Rosacea Industry Market
- Amorepacific Corporation
- Galderma
- Aclaris Therapeutics
- Tarsus Pharmaceuticals Inc
- LEO Pharma A/S
- Hovione FarmaCiencia SA
- Sol-Gel Technologies Ltd
- Journey Medical Corporation (Fortress Biotech Inc)
- Zydus Group
- Bausch Health Companies Inc
Key Developments in Rosacea Industry Sector
June 2023: Sol-Gel Technologies, Ltd. and Searchlight Pharma Inc. signed an exclusive license agreement for TWYNEO and EPSOLAY for the Canadian market. EPSOLAY (benzoyl peroxide, 5% cream) treats inflammatory lesions of rosacea in adults. This development expands market access for these products and strengthens Sol-Gel Technologies' presence in the Canadian market.
April 2023: Zydus Lifesciences received final approval from the United States FDA to manufacture and market Metronidazole Topical cream to treat rosacea in the United States market. This approval significantly boosts the market availability of a widely used rosacea treatment, enhancing competition and potentially lowering treatment costs.
Strategic Rosacea Industry Market Outlook
The Rosacea Industry is poised for significant growth, driven by rising prevalence, technological innovation, and increased patient awareness. Strategic opportunities exist in developing novel therapies targeting unmet needs, exploring personalized medicine approaches, and expanding market access in emerging economies. Companies focused on innovation and strategic partnerships are best positioned to capture significant market share in the coming years.
Rosacea Industry Segmentation
-
1. Drug Class
- 1.1. Antibiotics
- 1.2. Alpha Agonists
- 1.3. Retinoid
- 1.4. Corticosteroids
- 1.5. Immunosuppressants
- 1.6. Other Drug Classes
-
2. Mode of Administration
- 2.1. Topical
- 2.2. Oral
Rosacea Industry Segmentation By Geography
-
1. North America
- 1.1. United States
- 1.2. Canada
- 1.3. Mexico
-
2. Europe
- 2.1. Germany
- 2.2. United Kingdom
- 2.3. France
- 2.4. Italy
- 2.5. Spain
- 2.6. Rest of Europe
-
3. Asia Pacific
- 3.1. China
- 3.2. Japan
- 3.3. India
- 3.4. Australia
- 3.5. South Korea
- 3.6. Rest of Asia Pacific
-
4. Middle East and Africa
- 4.1. GCC
- 4.2. South Africa
- 4.3. Rest of Middle East and Africa
-
5. South America
- 5.1. Brazil
- 5.2. Argentina
- 5.3. Rest of South America
Rosacea Industry REPORT HIGHLIGHTS
| Aspects | Details |
|---|---|
| Study Period | 2019-2033 |
| Base Year | 2024 |
| Estimated Year | 2025 |
| Forecast Period | 2025-2033 |
| Historical Period | 2019-2024 |
| Growth Rate | CAGR of 8.74% from 2019-2033 |
| Segmentation |
|
Table of Contents
- 1. Introduction
- 1.1. Research Scope
- 1.2. Market Segmentation
- 1.3. Research Methodology
- 1.4. Definitions and Assumptions
- 2. Executive Summary
- 2.1. Introduction
- 3. Market Dynamics
- 3.1. Introduction
- 3.2. Market Drivers
- 3.2.1. Increasing Incidence and Prevalence of Rosacea; Increasing Inclination Toward Combination Products
- 3.3. Market Restrains
- 3.3.1. Increased Use of Generic Drugs
- 3.4. Market Trends
- 3.4.1. Antibiotics Segment is Expected to Have a Significant Market Share During the Forecast Period
- 4. Market Factor Analysis
- 4.1. Porters Five Forces
- 4.2. Supply/Value Chain
- 4.3. PESTEL analysis
- 4.4. Market Entropy
- 4.5. Patent/Trademark Analysis
- 5. Global Rosacea Industry Analysis, Insights and Forecast, 2019-2031
- 5.1. Market Analysis, Insights and Forecast - by Drug Class
- 5.1.1. Antibiotics
- 5.1.2. Alpha Agonists
- 5.1.3. Retinoid
- 5.1.4. Corticosteroids
- 5.1.5. Immunosuppressants
- 5.1.6. Other Drug Classes
- 5.2. Market Analysis, Insights and Forecast - by Mode of Administration
- 5.2.1. Topical
- 5.2.2. Oral
- 5.3. Market Analysis, Insights and Forecast - by Region
- 5.3.1. North America
- 5.3.2. Europe
- 5.3.3. Asia Pacific
- 5.3.4. Middle East and Africa
- 5.3.5. South America
- 5.1. Market Analysis, Insights and Forecast - by Drug Class
- 6. North America Rosacea Industry Analysis, Insights and Forecast, 2019-2031
- 6.1. Market Analysis, Insights and Forecast - by Drug Class
- 6.1.1. Antibiotics
- 6.1.2. Alpha Agonists
- 6.1.3. Retinoid
- 6.1.4. Corticosteroids
- 6.1.5. Immunosuppressants
- 6.1.6. Other Drug Classes
- 6.2. Market Analysis, Insights and Forecast - by Mode of Administration
- 6.2.1. Topical
- 6.2.2. Oral
- 6.1. Market Analysis, Insights and Forecast - by Drug Class
- 7. Europe Rosacea Industry Analysis, Insights and Forecast, 2019-2031
- 7.1. Market Analysis, Insights and Forecast - by Drug Class
- 7.1.1. Antibiotics
- 7.1.2. Alpha Agonists
- 7.1.3. Retinoid
- 7.1.4. Corticosteroids
- 7.1.5. Immunosuppressants
- 7.1.6. Other Drug Classes
- 7.2. Market Analysis, Insights and Forecast - by Mode of Administration
- 7.2.1. Topical
- 7.2.2. Oral
- 7.1. Market Analysis, Insights and Forecast - by Drug Class
- 8. Asia Pacific Rosacea Industry Analysis, Insights and Forecast, 2019-2031
- 8.1. Market Analysis, Insights and Forecast - by Drug Class
- 8.1.1. Antibiotics
- 8.1.2. Alpha Agonists
- 8.1.3. Retinoid
- 8.1.4. Corticosteroids
- 8.1.5. Immunosuppressants
- 8.1.6. Other Drug Classes
- 8.2. Market Analysis, Insights and Forecast - by Mode of Administration
- 8.2.1. Topical
- 8.2.2. Oral
- 8.1. Market Analysis, Insights and Forecast - by Drug Class
- 9. Middle East and Africa Rosacea Industry Analysis, Insights and Forecast, 2019-2031
- 9.1. Market Analysis, Insights and Forecast - by Drug Class
- 9.1.1. Antibiotics
- 9.1.2. Alpha Agonists
- 9.1.3. Retinoid
- 9.1.4. Corticosteroids
- 9.1.5. Immunosuppressants
- 9.1.6. Other Drug Classes
- 9.2. Market Analysis, Insights and Forecast - by Mode of Administration
- 9.2.1. Topical
- 9.2.2. Oral
- 9.1. Market Analysis, Insights and Forecast - by Drug Class
- 10. South America Rosacea Industry Analysis, Insights and Forecast, 2019-2031
- 10.1. Market Analysis, Insights and Forecast - by Drug Class
- 10.1.1. Antibiotics
- 10.1.2. Alpha Agonists
- 10.1.3. Retinoid
- 10.1.4. Corticosteroids
- 10.1.5. Immunosuppressants
- 10.1.6. Other Drug Classes
- 10.2. Market Analysis, Insights and Forecast - by Mode of Administration
- 10.2.1. Topical
- 10.2.2. Oral
- 10.1. Market Analysis, Insights and Forecast - by Drug Class
- 11. North America Rosacea Industry Analysis, Insights and Forecast, 2019-2031
- 11.1. Market Analysis, Insights and Forecast - By Country/Sub-region
- 11.1.1 United States
- 11.1.2 Canada
- 11.1.3 Mexico
- 12. Europe Rosacea Industry Analysis, Insights and Forecast, 2019-2031
- 12.1. Market Analysis, Insights and Forecast - By Country/Sub-region
- 12.1.1 Germany
- 12.1.2 United Kingdom
- 12.1.3 France
- 12.1.4 Italy
- 12.1.5 Spain
- 12.1.6 Rest of Europe
- 13. Asia Pacific Rosacea Industry Analysis, Insights and Forecast, 2019-2031
- 13.1. Market Analysis, Insights and Forecast - By Country/Sub-region
- 13.1.1 China
- 13.1.2 Japan
- 13.1.3 India
- 13.1.4 Australia
- 13.1.5 South Korea
- 13.1.6 Rest of Asia Pacific
- 14. Middle East and Africa Rosacea Industry Analysis, Insights and Forecast, 2019-2031
- 14.1. Market Analysis, Insights and Forecast - By Country/Sub-region
- 14.1.1 GCC
- 14.1.2 South Africa
- 14.1.3 Rest of Middle East and Africa
- 15. South America Rosacea Industry Analysis, Insights and Forecast, 2019-2031
- 15.1. Market Analysis, Insights and Forecast - By Country/Sub-region
- 15.1.1 Brazil
- 15.1.2 Argentina
- 15.1.3 Rest of South America
- 16. Competitive Analysis
- 16.1. Global Market Share Analysis 2024
- 16.2. Company Profiles
- 16.2.1 Amorepacific Corporation
- 16.2.1.1. Overview
- 16.2.1.2. Products
- 16.2.1.3. SWOT Analysis
- 16.2.1.4. Recent Developments
- 16.2.1.5. Financials (Based on Availability)
- 16.2.2 Galderma
- 16.2.2.1. Overview
- 16.2.2.2. Products
- 16.2.2.3. SWOT Analysis
- 16.2.2.4. Recent Developments
- 16.2.2.5. Financials (Based on Availability)
- 16.2.3 Aclaris Therapeutics
- 16.2.3.1. Overview
- 16.2.3.2. Products
- 16.2.3.3. SWOT Analysis
- 16.2.3.4. Recent Developments
- 16.2.3.5. Financials (Based on Availability)
- 16.2.4 Tarsus Pharmaceuticals Inc
- 16.2.4.1. Overview
- 16.2.4.2. Products
- 16.2.4.3. SWOT Analysis
- 16.2.4.4. Recent Developments
- 16.2.4.5. Financials (Based on Availability)
- 16.2.5 LEO Pharma A/S
- 16.2.5.1. Overview
- 16.2.5.2. Products
- 16.2.5.3. SWOT Analysis
- 16.2.5.4. Recent Developments
- 16.2.5.5. Financials (Based on Availability)
- 16.2.6 Hovione FarmaCiencia SA
- 16.2.6.1. Overview
- 16.2.6.2. Products
- 16.2.6.3. SWOT Analysis
- 16.2.6.4. Recent Developments
- 16.2.6.5. Financials (Based on Availability)
- 16.2.7 Sol-Gel Technologies Ltd *List Not Exhaustive
- 16.2.7.1. Overview
- 16.2.7.2. Products
- 16.2.7.3. SWOT Analysis
- 16.2.7.4. Recent Developments
- 16.2.7.5. Financials (Based on Availability)
- 16.2.8 Journey Medical Corporation (Fortress Biotech Inc )
- 16.2.8.1. Overview
- 16.2.8.2. Products
- 16.2.8.3. SWOT Analysis
- 16.2.8.4. Recent Developments
- 16.2.8.5. Financials (Based on Availability)
- 16.2.9 Zydus Group
- 16.2.9.1. Overview
- 16.2.9.2. Products
- 16.2.9.3. SWOT Analysis
- 16.2.9.4. Recent Developments
- 16.2.9.5. Financials (Based on Availability)
- 16.2.10 Bausch Health Companies Inc
- 16.2.10.1. Overview
- 16.2.10.2. Products
- 16.2.10.3. SWOT Analysis
- 16.2.10.4. Recent Developments
- 16.2.10.5. Financials (Based on Availability)
- 16.2.1 Amorepacific Corporation
List of Figures
- Figure 1: Global Rosacea Industry Revenue Breakdown (Million, %) by Region 2024 & 2032
- Figure 2: North America Rosacea Industry Revenue (Million), by Country 2024 & 2032
- Figure 3: North America Rosacea Industry Revenue Share (%), by Country 2024 & 2032
- Figure 4: Europe Rosacea Industry Revenue (Million), by Country 2024 & 2032
- Figure 5: Europe Rosacea Industry Revenue Share (%), by Country 2024 & 2032
- Figure 6: Asia Pacific Rosacea Industry Revenue (Million), by Country 2024 & 2032
- Figure 7: Asia Pacific Rosacea Industry Revenue Share (%), by Country 2024 & 2032
- Figure 8: Middle East and Africa Rosacea Industry Revenue (Million), by Country 2024 & 2032
- Figure 9: Middle East and Africa Rosacea Industry Revenue Share (%), by Country 2024 & 2032
- Figure 10: South America Rosacea Industry Revenue (Million), by Country 2024 & 2032
- Figure 11: South America Rosacea Industry Revenue Share (%), by Country 2024 & 2032
- Figure 12: North America Rosacea Industry Revenue (Million), by Drug Class 2024 & 2032
- Figure 13: North America Rosacea Industry Revenue Share (%), by Drug Class 2024 & 2032
- Figure 14: North America Rosacea Industry Revenue (Million), by Mode of Administration 2024 & 2032
- Figure 15: North America Rosacea Industry Revenue Share (%), by Mode of Administration 2024 & 2032
- Figure 16: North America Rosacea Industry Revenue (Million), by Country 2024 & 2032
- Figure 17: North America Rosacea Industry Revenue Share (%), by Country 2024 & 2032
- Figure 18: Europe Rosacea Industry Revenue (Million), by Drug Class 2024 & 2032
- Figure 19: Europe Rosacea Industry Revenue Share (%), by Drug Class 2024 & 2032
- Figure 20: Europe Rosacea Industry Revenue (Million), by Mode of Administration 2024 & 2032
- Figure 21: Europe Rosacea Industry Revenue Share (%), by Mode of Administration 2024 & 2032
- Figure 22: Europe Rosacea Industry Revenue (Million), by Country 2024 & 2032
- Figure 23: Europe Rosacea Industry Revenue Share (%), by Country 2024 & 2032
- Figure 24: Asia Pacific Rosacea Industry Revenue (Million), by Drug Class 2024 & 2032
- Figure 25: Asia Pacific Rosacea Industry Revenue Share (%), by Drug Class 2024 & 2032
- Figure 26: Asia Pacific Rosacea Industry Revenue (Million), by Mode of Administration 2024 & 2032
- Figure 27: Asia Pacific Rosacea Industry Revenue Share (%), by Mode of Administration 2024 & 2032
- Figure 28: Asia Pacific Rosacea Industry Revenue (Million), by Country 2024 & 2032
- Figure 29: Asia Pacific Rosacea Industry Revenue Share (%), by Country 2024 & 2032
- Figure 30: Middle East and Africa Rosacea Industry Revenue (Million), by Drug Class 2024 & 2032
- Figure 31: Middle East and Africa Rosacea Industry Revenue Share (%), by Drug Class 2024 & 2032
- Figure 32: Middle East and Africa Rosacea Industry Revenue (Million), by Mode of Administration 2024 & 2032
- Figure 33: Middle East and Africa Rosacea Industry Revenue Share (%), by Mode of Administration 2024 & 2032
- Figure 34: Middle East and Africa Rosacea Industry Revenue (Million), by Country 2024 & 2032
- Figure 35: Middle East and Africa Rosacea Industry Revenue Share (%), by Country 2024 & 2032
- Figure 36: South America Rosacea Industry Revenue (Million), by Drug Class 2024 & 2032
- Figure 37: South America Rosacea Industry Revenue Share (%), by Drug Class 2024 & 2032
- Figure 38: South America Rosacea Industry Revenue (Million), by Mode of Administration 2024 & 2032
- Figure 39: South America Rosacea Industry Revenue Share (%), by Mode of Administration 2024 & 2032
- Figure 40: South America Rosacea Industry Revenue (Million), by Country 2024 & 2032
- Figure 41: South America Rosacea Industry Revenue Share (%), by Country 2024 & 2032
List of Tables
- Table 1: Global Rosacea Industry Revenue Million Forecast, by Region 2019 & 2032
- Table 2: Global Rosacea Industry Revenue Million Forecast, by Drug Class 2019 & 2032
- Table 3: Global Rosacea Industry Revenue Million Forecast, by Mode of Administration 2019 & 2032
- Table 4: Global Rosacea Industry Revenue Million Forecast, by Region 2019 & 2032
- Table 5: Global Rosacea Industry Revenue Million Forecast, by Country 2019 & 2032
- Table 6: United States Rosacea Industry Revenue (Million) Forecast, by Application 2019 & 2032
- Table 7: Canada Rosacea Industry Revenue (Million) Forecast, by Application 2019 & 2032
- Table 8: Mexico Rosacea Industry Revenue (Million) Forecast, by Application 2019 & 2032
- Table 9: Global Rosacea Industry Revenue Million Forecast, by Country 2019 & 2032
- Table 10: Germany Rosacea Industry Revenue (Million) Forecast, by Application 2019 & 2032
- Table 11: United Kingdom Rosacea Industry Revenue (Million) Forecast, by Application 2019 & 2032
- Table 12: France Rosacea Industry Revenue (Million) Forecast, by Application 2019 & 2032
- Table 13: Italy Rosacea Industry Revenue (Million) Forecast, by Application 2019 & 2032
- Table 14: Spain Rosacea Industry Revenue (Million) Forecast, by Application 2019 & 2032
- Table 15: Rest of Europe Rosacea Industry Revenue (Million) Forecast, by Application 2019 & 2032
- Table 16: Global Rosacea Industry Revenue Million Forecast, by Country 2019 & 2032
- Table 17: China Rosacea Industry Revenue (Million) Forecast, by Application 2019 & 2032
- Table 18: Japan Rosacea Industry Revenue (Million) Forecast, by Application 2019 & 2032
- Table 19: India Rosacea Industry Revenue (Million) Forecast, by Application 2019 & 2032
- Table 20: Australia Rosacea Industry Revenue (Million) Forecast, by Application 2019 & 2032
- Table 21: South Korea Rosacea Industry Revenue (Million) Forecast, by Application 2019 & 2032
- Table 22: Rest of Asia Pacific Rosacea Industry Revenue (Million) Forecast, by Application 2019 & 2032
- Table 23: Global Rosacea Industry Revenue Million Forecast, by Country 2019 & 2032
- Table 24: GCC Rosacea Industry Revenue (Million) Forecast, by Application 2019 & 2032
- Table 25: South Africa Rosacea Industry Revenue (Million) Forecast, by Application 2019 & 2032
- Table 26: Rest of Middle East and Africa Rosacea Industry Revenue (Million) Forecast, by Application 2019 & 2032
- Table 27: Global Rosacea Industry Revenue Million Forecast, by Country 2019 & 2032
- Table 28: Brazil Rosacea Industry Revenue (Million) Forecast, by Application 2019 & 2032
- Table 29: Argentina Rosacea Industry Revenue (Million) Forecast, by Application 2019 & 2032
- Table 30: Rest of South America Rosacea Industry Revenue (Million) Forecast, by Application 2019 & 2032
- Table 31: Global Rosacea Industry Revenue Million Forecast, by Drug Class 2019 & 2032
- Table 32: Global Rosacea Industry Revenue Million Forecast, by Mode of Administration 2019 & 2032
- Table 33: Global Rosacea Industry Revenue Million Forecast, by Country 2019 & 2032
- Table 34: United States Rosacea Industry Revenue (Million) Forecast, by Application 2019 & 2032
- Table 35: Canada Rosacea Industry Revenue (Million) Forecast, by Application 2019 & 2032
- Table 36: Mexico Rosacea Industry Revenue (Million) Forecast, by Application 2019 & 2032
- Table 37: Global Rosacea Industry Revenue Million Forecast, by Drug Class 2019 & 2032
- Table 38: Global Rosacea Industry Revenue Million Forecast, by Mode of Administration 2019 & 2032
- Table 39: Global Rosacea Industry Revenue Million Forecast, by Country 2019 & 2032
- Table 40: Germany Rosacea Industry Revenue (Million) Forecast, by Application 2019 & 2032
- Table 41: United Kingdom Rosacea Industry Revenue (Million) Forecast, by Application 2019 & 2032
- Table 42: France Rosacea Industry Revenue (Million) Forecast, by Application 2019 & 2032
- Table 43: Italy Rosacea Industry Revenue (Million) Forecast, by Application 2019 & 2032
- Table 44: Spain Rosacea Industry Revenue (Million) Forecast, by Application 2019 & 2032
- Table 45: Rest of Europe Rosacea Industry Revenue (Million) Forecast, by Application 2019 & 2032
- Table 46: Global Rosacea Industry Revenue Million Forecast, by Drug Class 2019 & 2032
- Table 47: Global Rosacea Industry Revenue Million Forecast, by Mode of Administration 2019 & 2032
- Table 48: Global Rosacea Industry Revenue Million Forecast, by Country 2019 & 2032
- Table 49: China Rosacea Industry Revenue (Million) Forecast, by Application 2019 & 2032
- Table 50: Japan Rosacea Industry Revenue (Million) Forecast, by Application 2019 & 2032
- Table 51: India Rosacea Industry Revenue (Million) Forecast, by Application 2019 & 2032
- Table 52: Australia Rosacea Industry Revenue (Million) Forecast, by Application 2019 & 2032
- Table 53: South Korea Rosacea Industry Revenue (Million) Forecast, by Application 2019 & 2032
- Table 54: Rest of Asia Pacific Rosacea Industry Revenue (Million) Forecast, by Application 2019 & 2032
- Table 55: Global Rosacea Industry Revenue Million Forecast, by Drug Class 2019 & 2032
- Table 56: Global Rosacea Industry Revenue Million Forecast, by Mode of Administration 2019 & 2032
- Table 57: Global Rosacea Industry Revenue Million Forecast, by Country 2019 & 2032
- Table 58: GCC Rosacea Industry Revenue (Million) Forecast, by Application 2019 & 2032
- Table 59: South Africa Rosacea Industry Revenue (Million) Forecast, by Application 2019 & 2032
- Table 60: Rest of Middle East and Africa Rosacea Industry Revenue (Million) Forecast, by Application 2019 & 2032
- Table 61: Global Rosacea Industry Revenue Million Forecast, by Drug Class 2019 & 2032
- Table 62: Global Rosacea Industry Revenue Million Forecast, by Mode of Administration 2019 & 2032
- Table 63: Global Rosacea Industry Revenue Million Forecast, by Country 2019 & 2032
- Table 64: Brazil Rosacea Industry Revenue (Million) Forecast, by Application 2019 & 2032
- Table 65: Argentina Rosacea Industry Revenue (Million) Forecast, by Application 2019 & 2032
- Table 66: Rest of South America Rosacea Industry Revenue (Million) Forecast, by Application 2019 & 2032
Frequently Asked Questions
1. What is the projected Compound Annual Growth Rate (CAGR) of the Rosacea Industry?
The projected CAGR is approximately 8.74%.
2. Which companies are prominent players in the Rosacea Industry?
Key companies in the market include Amorepacific Corporation, Galderma, Aclaris Therapeutics, Tarsus Pharmaceuticals Inc, LEO Pharma A/S, Hovione FarmaCiencia SA, Sol-Gel Technologies Ltd *List Not Exhaustive, Journey Medical Corporation (Fortress Biotech Inc ), Zydus Group, Bausch Health Companies Inc.
3. What are the main segments of the Rosacea Industry?
The market segments include Drug Class, Mode of Administration.
4. Can you provide details about the market size?
The market size is estimated to be USD 2.09 Million as of 2022.
5. What are some drivers contributing to market growth?
Increasing Incidence and Prevalence of Rosacea; Increasing Inclination Toward Combination Products.
6. What are the notable trends driving market growth?
Antibiotics Segment is Expected to Have a Significant Market Share During the Forecast Period.
7. Are there any restraints impacting market growth?
Increased Use of Generic Drugs.
8. Can you provide examples of recent developments in the market?
June 2023: Sol-Gel Technologies, Ltd. and Searchlight Pharma Inc. signed an exclusive license agreement for TWYNEO and EPSOLAY for the Canadian market. EPSOLAY (benzoyl peroxide, 5% cream) treats inflammatory lesions of rosacea in adults.
9. What pricing options are available for accessing the report?
Pricing options include single-user, multi-user, and enterprise licenses priced at USD 4750, USD 5250, and USD 8750 respectively.
10. Is the market size provided in terms of value or volume?
The market size is provided in terms of value, measured in Million.
11. Are there any specific market keywords associated with the report?
Yes, the market keyword associated with the report is "Rosacea Industry," which aids in identifying and referencing the specific market segment covered.
12. How do I determine which pricing option suits my needs best?
The pricing options vary based on user requirements and access needs. Individual users may opt for single-user licenses, while businesses requiring broader access may choose multi-user or enterprise licenses for cost-effective access to the report.
13. Are there any additional resources or data provided in the Rosacea Industry report?
While the report offers comprehensive insights, it's advisable to review the specific contents or supplementary materials provided to ascertain if additional resources or data are available.
14. How can I stay updated on further developments or reports in the Rosacea Industry?
To stay informed about further developments, trends, and reports in the Rosacea Industry, consider subscribing to industry newsletters, following relevant companies and organizations, or regularly checking reputable industry news sources and publications.
Methodology
Step 1 - Identification of Relevant Samples Size from Population Database


Step 2 - Approaches for Defining Global Market Size (Value, Volume* & Price*)

Note*: In applicable scenarios
Step 3 - Data Sources
Primary Research
- Web Analytics
- Survey Reports
- Research Institute
- Latest Research Reports
- Opinion Leaders
Secondary Research
- Annual Reports
- White Paper
- Latest Press Release
- Industry Association
- Paid Database
- Investor Presentations

Step 4 - Data Triangulation
Involves using different sources of information in order to increase the validity of a study
These sources are likely to be stakeholders in a program - participants, other researchers, program staff, other community members, and so on.
Then we put all data in single framework & apply various statistical tools to find out the dynamic on the market.
During the analysis stage, feedback from the stakeholder groups would be compared to determine areas of agreement as well as areas of divergence


