
Key Insights
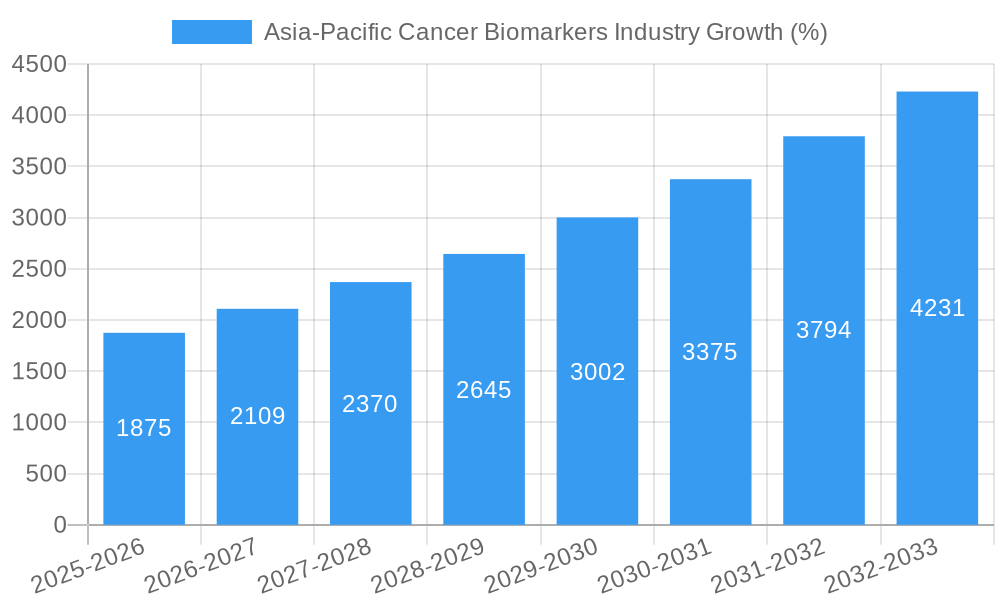
The Asia-Pacific cancer biomarkers market is experiencing robust growth, driven by rising cancer incidence rates, increasing awareness of early detection and personalized medicine, and significant investments in research and development. The market's Compound Annual Growth Rate (CAGR) of 12.50% from 2019 to 2024 suggests a substantial expansion, projected to continue through 2033. Key drivers include the increasing prevalence of cancers like prostate, breast, lung, colorectal, and cervical cancers across the region's diverse populations. Technological advancements in OMICS technologies, imaging technologies, immunoassays, and cytogenetics are further fueling market expansion, enabling more accurate and efficient biomarker profiling. The significant market segment of protein biomarkers benefits from established technologies and widespread adoption, while genetic biomarkers are experiencing rapid growth due to their potential for personalized cancer therapies. However, high costs associated with advanced technologies and limited access to diagnostic tools in certain regions pose challenges to market penetration. Furthermore, regulatory hurdles and the complexity of biomarker development and validation could impede growth to some extent. This dynamic interplay of factors will shape the future of the Asia-Pacific cancer biomarkers market, with significant opportunities for growth despite existing constraints.
The strong growth trajectory is expected to continue, propelled by increasing government support for healthcare infrastructure and initiatives focused on early cancer detection in countries like China, India, and Japan. The expanding private sector involvement in diagnostics and therapeutics also contributes to market expansion. The segmentation analysis reveals that OMICS technologies, owing to their comprehensive profiling capabilities, hold a significant market share within the profiling technology segment. Within cancer types, prostate, breast, and lung cancers represent the largest market segments due to their high prevalence in the region. The competitive landscape features a mix of established global players and emerging regional companies, leading to increased innovation and market dynamism. The ongoing research into new biomarkers and improved diagnostic methods holds significant potential to accelerate market growth in the coming years. This continued expansion hinges upon addressing the existing challenges related to affordability and accessibility, ensuring broader access to these life-saving technologies.
Asia-Pacific Cancer Biomarkers Market: A Comprehensive Report (2019-2033)
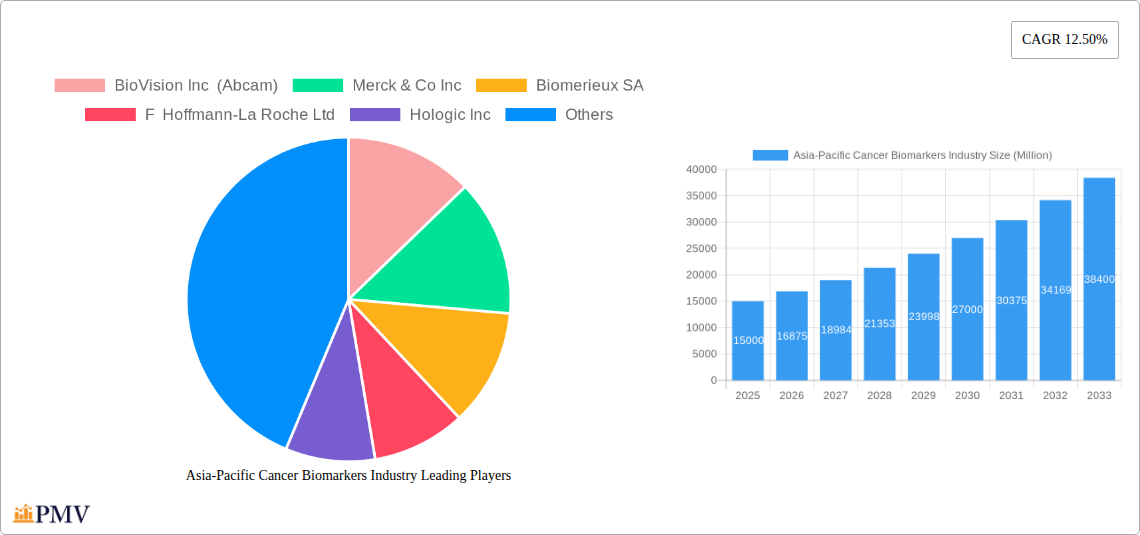
This comprehensive report provides an in-depth analysis of the Asia-Pacific cancer biomarkers industry, offering valuable insights for stakeholders across the value chain. The study period covers 2019-2033, with 2025 as the base and estimated year. The forecast period spans 2025-2033, and the historical period covers 2019-2024. The report meticulously examines market segmentation by cancer type (Prostate, Breast, Lung, Colorectal, Cervical, Other), biomarker type (Protein, Genetic, Other), and profiling technology (OMICS, Imaging, Immunoassays, Cytogenetics). Key players analyzed include BioVision Inc (Abcam), Merck & Co Inc, Biomerieux SA, F Hoffmann-La Roche Ltd, Hologic Inc, Celera Corporation (Quest Diagnostics), ASURAGEN INC, Qiagen NV, Illumina Inc, Abbott Laboratories Inc, Thermo Fisher Scientific, and Agilent Technologies. The report projects significant growth, driven by technological advancements and increasing cancer prevalence across the region.
Asia-Pacific Cancer Biomarkers Industry Market Structure & Competitive Dynamics
The Asia-Pacific cancer biomarkers market exhibits a moderately concentrated structure, with a few multinational corporations holding substantial market share. However, the presence of several innovative smaller players creates a dynamic competitive landscape. The market is characterized by ongoing mergers and acquisitions (M&A) activity, with deal values exceeding xx Million in the past five years. These M&A activities primarily involve strategic acquisitions of smaller companies with specialized technologies or a strong presence in specific geographic regions within the Asia-Pacific region. The regulatory framework is evolving, with varying levels of stringency across different countries, influencing market entry strategies and product approvals. The industry witnesses constant innovation, driven by advancements in OMICS technologies, imaging techniques, and immunoassays. Significant substitutions are occurring, with newer, more sensitive, and specific biomarker assays replacing older methods. End-user trends show a preference for rapid, accurate, and minimally invasive diagnostic tools.
- Market Concentration: Moderately concentrated, with top 5 players holding approximately xx% market share in 2025.
- Innovation Ecosystems: Robust, with active collaborations between research institutions, biotech companies, and pharmaceutical firms.
- Regulatory Frameworks: Variable across countries; impacting product approvals and market entry strategies.
- M&A Activity: Significant activity observed, with total deal values exceeding xx Million between 2020-2024.
Asia-Pacific Cancer Biomarkers Industry Industry Trends & Insights
The Asia-Pacific cancer biomarkers market is experiencing robust growth, driven by several key factors. The rising prevalence of cancer across the region is a primary driver, fueled by aging populations, changing lifestyles, and environmental factors. Technological advancements, particularly in OMICS technologies and advanced imaging, are enabling the development of more precise and sensitive diagnostic tools. Increased government investment in healthcare infrastructure and research initiatives is further stimulating market growth. Growing awareness among healthcare professionals and patients regarding the importance of early cancer detection is driving demand. However, challenges persist, including high costs associated with advanced technologies, regulatory hurdles for new product approvals, and variations in healthcare infrastructure across different countries. The market is projected to achieve a CAGR of xx% during the forecast period (2025-2033), with significant market penetration expected in emerging economies.
Dominant Markets & Segments in Asia-Pacific Cancer Biomarkers Industry
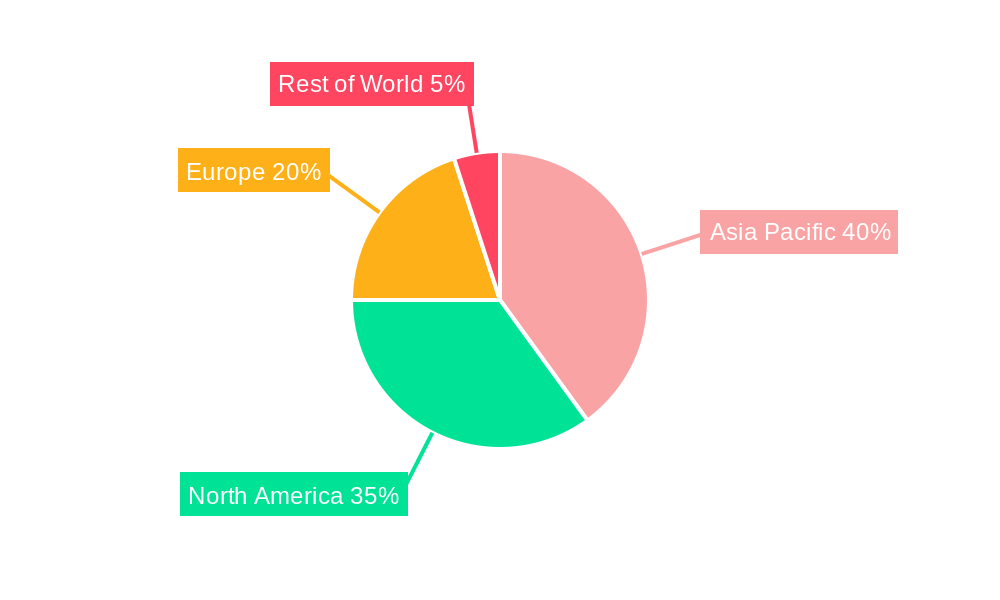
Within the Asia-Pacific region, Japan, China, and Australia are currently dominant markets for cancer biomarkers, fueled by advanced healthcare infrastructure, high cancer incidence rates, and robust research ecosystems. Among cancer types, breast cancer and lung cancer currently hold the largest market segments, driven by high prevalence and the availability of advanced diagnostic tools. Protein biomarkers constitute the largest segment by biomarker type, owing to established technologies and wider clinical acceptance. OMICS technologies are the leading profiling technology, facilitating high-throughput screening and improved diagnostic accuracy.
- Key Drivers for Dominant Markets:
- Japan: Advanced healthcare infrastructure, strong R&D capabilities.
- China: High cancer prevalence, increasing healthcare expenditure.
- Australia: Well-established healthcare systems, early adoption of advanced technologies.
- Dominant Segments:
- Cancer Type: Breast cancer and lung cancer.
- Biomarker Type: Protein biomarkers.
- Profiling Technology: OMICS technologies.
Asia-Pacific Cancer Biomarkers Industry Product Innovations
Recent innovations in the Asia-Pacific cancer biomarkers market focus on developing highly sensitive and specific assays, utilizing advanced technologies such as next-generation sequencing (NGS) and liquid biopsies. These innovations allow for earlier and more accurate cancer detection, personalized treatment approaches, and improved patient outcomes. Companies are focusing on developing point-of-care diagnostics to improve accessibility in remote areas, leveraging AI and machine learning for enhanced data analysis and biomarker discovery. The market shows a clear trend toward minimally invasive techniques, improving patient comfort and compliance.
Report Segmentation & Scope
This report segments the Asia-Pacific cancer biomarkers market across various parameters:
- Cancer Type: Prostate, Breast, Lung, Colorectal, Cervical, Other. Each segment's market size and growth projections are detailed, along with competitive dynamics.
- Biomarker Type: Protein, Genetic, Other. The report analyzes the prevalence and applications of each biomarker type, alongside growth estimates.
- Profiling Technology: OMICS, Imaging, Immunoassays, Cytogenetics. This section compares the strengths, limitations, and market penetration of each technology.
Each segment's analysis includes market size estimations, growth projections, and competitive landscape assessments, providing a complete picture of the market structure.
Key Drivers of Asia-Pacific Cancer Biomarkers Industry Growth
Several key factors drive the growth of the Asia-Pacific cancer biomarkers industry. The rising incidence of cancer, particularly in rapidly aging populations, is a major factor. Technological advancements, including improved sensitivity and specificity of assays, and the development of minimally invasive diagnostic procedures also contribute significantly. Increased government investment in healthcare infrastructure and research and development, coupled with growing awareness of early detection and personalized medicine, further accelerates market expansion.
Challenges in the Asia-Pacific Cancer Biomarkers Industry Sector
Despite its strong growth potential, the Asia-Pacific cancer biomarkers industry faces challenges, including high costs associated with advanced technologies, which can limit accessibility, particularly in lower-income countries. Regulatory hurdles and varying approval processes across different nations also create complexities for market entry. The need for skilled professionals capable of operating and interpreting complex diagnostic tools poses an additional constraint. Finally, intense competition among established players and emerging companies necessitates constant innovation and strategic partnerships.
Leading Players in the Asia-Pacific Cancer Biomarkers Industry Market
- BioVision Inc (Abcam)
- Merck & Co Inc
- Biomerieux SA
- F Hoffmann-La Roche Ltd
- Hologic Inc
- Celera Corporation (Quest Diagnostics)
- ASURAGEN INC
- Qiagen NV
- Illumina Inc
- Abbott Laboratories Inc
- Thermo Fisher Scientific
- Agilent Technologies
Key Developments in Asia-Pacific Cancer Biomarkers Industry Sector
- October 2022: The Garvan Institute of Medical Research in Australia discovered a new biomarker for prostate cancer, potentially improving diagnosis and treatment of aggressive forms.
- February 2022: The University of South Australia identified novel biomarkers linking aggressive breast cancer cells to dual CXCR4-CCR7 cell surface protein complexes, advancing understanding of metastasis.
Strategic Asia-Pacific Cancer Biomarkers Industry Market Outlook
The Asia-Pacific cancer biomarkers market presents significant growth opportunities. Continued technological advancements, coupled with increasing healthcare expenditure and rising cancer prevalence, are projected to drive substantial market expansion. Strategic partnerships between research institutions, biotech companies, and pharmaceutical firms will play a vital role in accelerating innovation. Focus on developing cost-effective and accessible diagnostic tools for broader patient access will be critical for future success. The market holds substantial potential for companies that can effectively navigate regulatory complexities and cater to the diverse healthcare needs across the region.
Asia-Pacific Cancer Biomarkers Industry Segmentation
-
1. Cancer Type
- 1.1. Prostate Cancer
- 1.2. Breast Cancer
- 1.3. Lung Cancer
- 1.4. Colorectal Cancer
- 1.5. Cervical Cancer
- 1.6. Other Cancer Type
-
2. Type of Biomarker
- 2.1. Protein Biomarkers
- 2.2. Genetic Biomarkers
- 2.3. Other Types of Biomarkers
-
3. Profiling Technology
- 3.1. OMICS Technologies
- 3.2. Imaging Technologies
- 3.3. Immunoassays
- 3.4. Cytogenetics
-
4. Geography
- 4.1. China
- 4.2. Japan
- 4.3. India
- 4.4. Australia
- 4.5. South Korea
- 4.6. Rest of Asia-Pacific
Asia-Pacific Cancer Biomarkers Industry Segmentation By Geography
- 1. China
- 2. Japan
- 3. India
- 4. Australia
- 5. South Korea
- 6. Rest of Asia Pacific
Asia-Pacific Cancer Biomarkers Industry REPORT HIGHLIGHTS
| Aspects | Details |
|---|---|
| Study Period | 2019-2033 |
| Base Year | 2024 |
| Estimated Year | 2025 |
| Forecast Period | 2025-2033 |
| Historical Period | 2019-2024 |
| Growth Rate | CAGR of 12.50% from 2019-2033 |
| Segmentation |
|
Table of Contents
- 1. Introduction
- 1.1. Research Scope
- 1.2. Market Segmentation
- 1.3. Research Methodology
- 1.4. Definitions and Assumptions
- 2. Executive Summary
- 2.1. Introduction
- 3. Market Dynamics
- 3.1. Introduction
- 3.2. Market Drivers
- 3.2.1. Rising Prevalence of Cancer; Increasing Research Activities and Growing Usage of Biomarkers in Drug Development
- 3.3. Market Restrains
- 3.3.1. High Cost of Diagnosis; Reimbursement Issues
- 3.4. Market Trends
- 3.4.1. Breast Cancer is Expected to Grow with a Significant CAGR in the Market Over the Forecast Period
- 4. Market Factor Analysis
- 4.1. Porters Five Forces
- 4.2. Supply/Value Chain
- 4.3. PESTEL analysis
- 4.4. Market Entropy
- 4.5. Patent/Trademark Analysis
- 5. Asia-Pacific Cancer Biomarkers Industry Analysis, Insights and Forecast, 2019-2031
- 5.1. Market Analysis, Insights and Forecast - by Cancer Type
- 5.1.1. Prostate Cancer
- 5.1.2. Breast Cancer
- 5.1.3. Lung Cancer
- 5.1.4. Colorectal Cancer
- 5.1.5. Cervical Cancer
- 5.1.6. Other Cancer Type
- 5.2. Market Analysis, Insights and Forecast - by Type of Biomarker
- 5.2.1. Protein Biomarkers
- 5.2.2. Genetic Biomarkers
- 5.2.3. Other Types of Biomarkers
- 5.3. Market Analysis, Insights and Forecast - by Profiling Technology
- 5.3.1. OMICS Technologies
- 5.3.2. Imaging Technologies
- 5.3.3. Immunoassays
- 5.3.4. Cytogenetics
- 5.4. Market Analysis, Insights and Forecast - by Geography
- 5.4.1. China
- 5.4.2. Japan
- 5.4.3. India
- 5.4.4. Australia
- 5.4.5. South Korea
- 5.4.6. Rest of Asia-Pacific
- 5.5. Market Analysis, Insights and Forecast - by Region
- 5.5.1. China
- 5.5.2. Japan
- 5.5.3. India
- 5.5.4. Australia
- 5.5.5. South Korea
- 5.5.6. Rest of Asia Pacific
- 5.1. Market Analysis, Insights and Forecast - by Cancer Type
- 6. China Asia-Pacific Cancer Biomarkers Industry Analysis, Insights and Forecast, 2019-2031
- 6.1. Market Analysis, Insights and Forecast - by Cancer Type
- 6.1.1. Prostate Cancer
- 6.1.2. Breast Cancer
- 6.1.3. Lung Cancer
- 6.1.4. Colorectal Cancer
- 6.1.5. Cervical Cancer
- 6.1.6. Other Cancer Type
- 6.2. Market Analysis, Insights and Forecast - by Type of Biomarker
- 6.2.1. Protein Biomarkers
- 6.2.2. Genetic Biomarkers
- 6.2.3. Other Types of Biomarkers
- 6.3. Market Analysis, Insights and Forecast - by Profiling Technology
- 6.3.1. OMICS Technologies
- 6.3.2. Imaging Technologies
- 6.3.3. Immunoassays
- 6.3.4. Cytogenetics
- 6.4. Market Analysis, Insights and Forecast - by Geography
- 6.4.1. China
- 6.4.2. Japan
- 6.4.3. India
- 6.4.4. Australia
- 6.4.5. South Korea
- 6.4.6. Rest of Asia-Pacific
- 6.1. Market Analysis, Insights and Forecast - by Cancer Type
- 7. Japan Asia-Pacific Cancer Biomarkers Industry Analysis, Insights and Forecast, 2019-2031
- 7.1. Market Analysis, Insights and Forecast - by Cancer Type
- 7.1.1. Prostate Cancer
- 7.1.2. Breast Cancer
- 7.1.3. Lung Cancer
- 7.1.4. Colorectal Cancer
- 7.1.5. Cervical Cancer
- 7.1.6. Other Cancer Type
- 7.2. Market Analysis, Insights and Forecast - by Type of Biomarker
- 7.2.1. Protein Biomarkers
- 7.2.2. Genetic Biomarkers
- 7.2.3. Other Types of Biomarkers
- 7.3. Market Analysis, Insights and Forecast - by Profiling Technology
- 7.3.1. OMICS Technologies
- 7.3.2. Imaging Technologies
- 7.3.3. Immunoassays
- 7.3.4. Cytogenetics
- 7.4. Market Analysis, Insights and Forecast - by Geography
- 7.4.1. China
- 7.4.2. Japan
- 7.4.3. India
- 7.4.4. Australia
- 7.4.5. South Korea
- 7.4.6. Rest of Asia-Pacific
- 7.1. Market Analysis, Insights and Forecast - by Cancer Type
- 8. India Asia-Pacific Cancer Biomarkers Industry Analysis, Insights and Forecast, 2019-2031
- 8.1. Market Analysis, Insights and Forecast - by Cancer Type
- 8.1.1. Prostate Cancer
- 8.1.2. Breast Cancer
- 8.1.3. Lung Cancer
- 8.1.4. Colorectal Cancer
- 8.1.5. Cervical Cancer
- 8.1.6. Other Cancer Type
- 8.2. Market Analysis, Insights and Forecast - by Type of Biomarker
- 8.2.1. Protein Biomarkers
- 8.2.2. Genetic Biomarkers
- 8.2.3. Other Types of Biomarkers
- 8.3. Market Analysis, Insights and Forecast - by Profiling Technology
- 8.3.1. OMICS Technologies
- 8.3.2. Imaging Technologies
- 8.3.3. Immunoassays
- 8.3.4. Cytogenetics
- 8.4. Market Analysis, Insights and Forecast - by Geography
- 8.4.1. China
- 8.4.2. Japan
- 8.4.3. India
- 8.4.4. Australia
- 8.4.5. South Korea
- 8.4.6. Rest of Asia-Pacific
- 8.1. Market Analysis, Insights and Forecast - by Cancer Type
- 9. Australia Asia-Pacific Cancer Biomarkers Industry Analysis, Insights and Forecast, 2019-2031
- 9.1. Market Analysis, Insights and Forecast - by Cancer Type
- 9.1.1. Prostate Cancer
- 9.1.2. Breast Cancer
- 9.1.3. Lung Cancer
- 9.1.4. Colorectal Cancer
- 9.1.5. Cervical Cancer
- 9.1.6. Other Cancer Type
- 9.2. Market Analysis, Insights and Forecast - by Type of Biomarker
- 9.2.1. Protein Biomarkers
- 9.2.2. Genetic Biomarkers
- 9.2.3. Other Types of Biomarkers
- 9.3. Market Analysis, Insights and Forecast - by Profiling Technology
- 9.3.1. OMICS Technologies
- 9.3.2. Imaging Technologies
- 9.3.3. Immunoassays
- 9.3.4. Cytogenetics
- 9.4. Market Analysis, Insights and Forecast - by Geography
- 9.4.1. China
- 9.4.2. Japan
- 9.4.3. India
- 9.4.4. Australia
- 9.4.5. South Korea
- 9.4.6. Rest of Asia-Pacific
- 9.1. Market Analysis, Insights and Forecast - by Cancer Type
- 10. South Korea Asia-Pacific Cancer Biomarkers Industry Analysis, Insights and Forecast, 2019-2031
- 10.1. Market Analysis, Insights and Forecast - by Cancer Type
- 10.1.1. Prostate Cancer
- 10.1.2. Breast Cancer
- 10.1.3. Lung Cancer
- 10.1.4. Colorectal Cancer
- 10.1.5. Cervical Cancer
- 10.1.6. Other Cancer Type
- 10.2. Market Analysis, Insights and Forecast - by Type of Biomarker
- 10.2.1. Protein Biomarkers
- 10.2.2. Genetic Biomarkers
- 10.2.3. Other Types of Biomarkers
- 10.3. Market Analysis, Insights and Forecast - by Profiling Technology
- 10.3.1. OMICS Technologies
- 10.3.2. Imaging Technologies
- 10.3.3. Immunoassays
- 10.3.4. Cytogenetics
- 10.4. Market Analysis, Insights and Forecast - by Geography
- 10.4.1. China
- 10.4.2. Japan
- 10.4.3. India
- 10.4.4. Australia
- 10.4.5. South Korea
- 10.4.6. Rest of Asia-Pacific
- 10.1. Market Analysis, Insights and Forecast - by Cancer Type
- 11. Rest of Asia Pacific Asia-Pacific Cancer Biomarkers Industry Analysis, Insights and Forecast, 2019-2031
- 11.1. Market Analysis, Insights and Forecast - by Cancer Type
- 11.1.1. Prostate Cancer
- 11.1.2. Breast Cancer
- 11.1.3. Lung Cancer
- 11.1.4. Colorectal Cancer
- 11.1.5. Cervical Cancer
- 11.1.6. Other Cancer Type
- 11.2. Market Analysis, Insights and Forecast - by Type of Biomarker
- 11.2.1. Protein Biomarkers
- 11.2.2. Genetic Biomarkers
- 11.2.3. Other Types of Biomarkers
- 11.3. Market Analysis, Insights and Forecast - by Profiling Technology
- 11.3.1. OMICS Technologies
- 11.3.2. Imaging Technologies
- 11.3.3. Immunoassays
- 11.3.4. Cytogenetics
- 11.4. Market Analysis, Insights and Forecast - by Geography
- 11.4.1. China
- 11.4.2. Japan
- 11.4.3. India
- 11.4.4. Australia
- 11.4.5. South Korea
- 11.4.6. Rest of Asia-Pacific
- 11.1. Market Analysis, Insights and Forecast - by Cancer Type
- 12. China Asia-Pacific Cancer Biomarkers Industry Analysis, Insights and Forecast, 2019-2031
- 13. Japan Asia-Pacific Cancer Biomarkers Industry Analysis, Insights and Forecast, 2019-2031
- 14. India Asia-Pacific Cancer Biomarkers Industry Analysis, Insights and Forecast, 2019-2031
- 15. South Korea Asia-Pacific Cancer Biomarkers Industry Analysis, Insights and Forecast, 2019-2031
- 16. Taiwan Asia-Pacific Cancer Biomarkers Industry Analysis, Insights and Forecast, 2019-2031
- 17. Australia Asia-Pacific Cancer Biomarkers Industry Analysis, Insights and Forecast, 2019-2031
- 18. Rest of Asia-Pacific Asia-Pacific Cancer Biomarkers Industry Analysis, Insights and Forecast, 2019-2031
- 19. Competitive Analysis
- 19.1. Market Share Analysis 2024
- 19.2. Company Profiles
- 19.2.1 BioVision Inc (Abcam)
- 19.2.1.1. Overview
- 19.2.1.2. Products
- 19.2.1.3. SWOT Analysis
- 19.2.1.4. Recent Developments
- 19.2.1.5. Financials (Based on Availability)
- 19.2.2 Merck & Co Inc
- 19.2.2.1. Overview
- 19.2.2.2. Products
- 19.2.2.3. SWOT Analysis
- 19.2.2.4. Recent Developments
- 19.2.2.5. Financials (Based on Availability)
- 19.2.3 Biomerieux SA
- 19.2.3.1. Overview
- 19.2.3.2. Products
- 19.2.3.3. SWOT Analysis
- 19.2.3.4. Recent Developments
- 19.2.3.5. Financials (Based on Availability)
- 19.2.4 F Hoffmann-La Roche Ltd
- 19.2.4.1. Overview
- 19.2.4.2. Products
- 19.2.4.3. SWOT Analysis
- 19.2.4.4. Recent Developments
- 19.2.4.5. Financials (Based on Availability)
- 19.2.5 Hologic Inc
- 19.2.5.1. Overview
- 19.2.5.2. Products
- 19.2.5.3. SWOT Analysis
- 19.2.5.4. Recent Developments
- 19.2.5.5. Financials (Based on Availability)
- 19.2.6 Celera Corporation (Quest Diagnostics)
- 19.2.6.1. Overview
- 19.2.6.2. Products
- 19.2.6.3. SWOT Analysis
- 19.2.6.4. Recent Developments
- 19.2.6.5. Financials (Based on Availability)
- 19.2.7 ASURAGEN INC
- 19.2.7.1. Overview
- 19.2.7.2. Products
- 19.2.7.3. SWOT Analysis
- 19.2.7.4. Recent Developments
- 19.2.7.5. Financials (Based on Availability)
- 19.2.8 Qiagen NV
- 19.2.8.1. Overview
- 19.2.8.2. Products
- 19.2.8.3. SWOT Analysis
- 19.2.8.4. Recent Developments
- 19.2.8.5. Financials (Based on Availability)
- 19.2.9 Illumina Inc
- 19.2.9.1. Overview
- 19.2.9.2. Products
- 19.2.9.3. SWOT Analysis
- 19.2.9.4. Recent Developments
- 19.2.9.5. Financials (Based on Availability)
- 19.2.10 Abbott Laboratories Inc
- 19.2.10.1. Overview
- 19.2.10.2. Products
- 19.2.10.3. SWOT Analysis
- 19.2.10.4. Recent Developments
- 19.2.10.5. Financials (Based on Availability)
- 19.2.11 Thermo Fisher Scientific
- 19.2.11.1. Overview
- 19.2.11.2. Products
- 19.2.11.3. SWOT Analysis
- 19.2.11.4. Recent Developments
- 19.2.11.5. Financials (Based on Availability)
- 19.2.12 Agilent Technologies
- 19.2.12.1. Overview
- 19.2.12.2. Products
- 19.2.12.3. SWOT Analysis
- 19.2.12.4. Recent Developments
- 19.2.12.5. Financials (Based on Availability)
- 19.2.1 BioVision Inc (Abcam)
List of Figures
- Figure 1: Asia-Pacific Cancer Biomarkers Industry Revenue Breakdown (Million, %) by Product 2024 & 2032
- Figure 2: Asia-Pacific Cancer Biomarkers Industry Share (%) by Company 2024
List of Tables
- Table 1: Asia-Pacific Cancer Biomarkers Industry Revenue Million Forecast, by Region 2019 & 2032
- Table 2: Asia-Pacific Cancer Biomarkers Industry Volume K Unit Forecast, by Region 2019 & 2032
- Table 3: Asia-Pacific Cancer Biomarkers Industry Revenue Million Forecast, by Cancer Type 2019 & 2032
- Table 4: Asia-Pacific Cancer Biomarkers Industry Volume K Unit Forecast, by Cancer Type 2019 & 2032
- Table 5: Asia-Pacific Cancer Biomarkers Industry Revenue Million Forecast, by Type of Biomarker 2019 & 2032
- Table 6: Asia-Pacific Cancer Biomarkers Industry Volume K Unit Forecast, by Type of Biomarker 2019 & 2032
- Table 7: Asia-Pacific Cancer Biomarkers Industry Revenue Million Forecast, by Profiling Technology 2019 & 2032
- Table 8: Asia-Pacific Cancer Biomarkers Industry Volume K Unit Forecast, by Profiling Technology 2019 & 2032
- Table 9: Asia-Pacific Cancer Biomarkers Industry Revenue Million Forecast, by Geography 2019 & 2032
- Table 10: Asia-Pacific Cancer Biomarkers Industry Volume K Unit Forecast, by Geography 2019 & 2032
- Table 11: Asia-Pacific Cancer Biomarkers Industry Revenue Million Forecast, by Region 2019 & 2032
- Table 12: Asia-Pacific Cancer Biomarkers Industry Volume K Unit Forecast, by Region 2019 & 2032
- Table 13: Asia-Pacific Cancer Biomarkers Industry Revenue Million Forecast, by Country 2019 & 2032
- Table 14: Asia-Pacific Cancer Biomarkers Industry Volume K Unit Forecast, by Country 2019 & 2032
- Table 15: China Asia-Pacific Cancer Biomarkers Industry Revenue (Million) Forecast, by Application 2019 & 2032
- Table 16: China Asia-Pacific Cancer Biomarkers Industry Volume (K Unit) Forecast, by Application 2019 & 2032
- Table 17: Japan Asia-Pacific Cancer Biomarkers Industry Revenue (Million) Forecast, by Application 2019 & 2032
- Table 18: Japan Asia-Pacific Cancer Biomarkers Industry Volume (K Unit) Forecast, by Application 2019 & 2032
- Table 19: India Asia-Pacific Cancer Biomarkers Industry Revenue (Million) Forecast, by Application 2019 & 2032
- Table 20: India Asia-Pacific Cancer Biomarkers Industry Volume (K Unit) Forecast, by Application 2019 & 2032
- Table 21: South Korea Asia-Pacific Cancer Biomarkers Industry Revenue (Million) Forecast, by Application 2019 & 2032
- Table 22: South Korea Asia-Pacific Cancer Biomarkers Industry Volume (K Unit) Forecast, by Application 2019 & 2032
- Table 23: Taiwan Asia-Pacific Cancer Biomarkers Industry Revenue (Million) Forecast, by Application 2019 & 2032
- Table 24: Taiwan Asia-Pacific Cancer Biomarkers Industry Volume (K Unit) Forecast, by Application 2019 & 2032
- Table 25: Australia Asia-Pacific Cancer Biomarkers Industry Revenue (Million) Forecast, by Application 2019 & 2032
- Table 26: Australia Asia-Pacific Cancer Biomarkers Industry Volume (K Unit) Forecast, by Application 2019 & 2032
- Table 27: Rest of Asia-Pacific Asia-Pacific Cancer Biomarkers Industry Revenue (Million) Forecast, by Application 2019 & 2032
- Table 28: Rest of Asia-Pacific Asia-Pacific Cancer Biomarkers Industry Volume (K Unit) Forecast, by Application 2019 & 2032
- Table 29: Asia-Pacific Cancer Biomarkers Industry Revenue Million Forecast, by Cancer Type 2019 & 2032
- Table 30: Asia-Pacific Cancer Biomarkers Industry Volume K Unit Forecast, by Cancer Type 2019 & 2032
- Table 31: Asia-Pacific Cancer Biomarkers Industry Revenue Million Forecast, by Type of Biomarker 2019 & 2032
- Table 32: Asia-Pacific Cancer Biomarkers Industry Volume K Unit Forecast, by Type of Biomarker 2019 & 2032
- Table 33: Asia-Pacific Cancer Biomarkers Industry Revenue Million Forecast, by Profiling Technology 2019 & 2032
- Table 34: Asia-Pacific Cancer Biomarkers Industry Volume K Unit Forecast, by Profiling Technology 2019 & 2032
- Table 35: Asia-Pacific Cancer Biomarkers Industry Revenue Million Forecast, by Geography 2019 & 2032
- Table 36: Asia-Pacific Cancer Biomarkers Industry Volume K Unit Forecast, by Geography 2019 & 2032
- Table 37: Asia-Pacific Cancer Biomarkers Industry Revenue Million Forecast, by Country 2019 & 2032
- Table 38: Asia-Pacific Cancer Biomarkers Industry Volume K Unit Forecast, by Country 2019 & 2032
- Table 39: Asia-Pacific Cancer Biomarkers Industry Revenue Million Forecast, by Cancer Type 2019 & 2032
- Table 40: Asia-Pacific Cancer Biomarkers Industry Volume K Unit Forecast, by Cancer Type 2019 & 2032
- Table 41: Asia-Pacific Cancer Biomarkers Industry Revenue Million Forecast, by Type of Biomarker 2019 & 2032
- Table 42: Asia-Pacific Cancer Biomarkers Industry Volume K Unit Forecast, by Type of Biomarker 2019 & 2032
- Table 43: Asia-Pacific Cancer Biomarkers Industry Revenue Million Forecast, by Profiling Technology 2019 & 2032
- Table 44: Asia-Pacific Cancer Biomarkers Industry Volume K Unit Forecast, by Profiling Technology 2019 & 2032
- Table 45: Asia-Pacific Cancer Biomarkers Industry Revenue Million Forecast, by Geography 2019 & 2032
- Table 46: Asia-Pacific Cancer Biomarkers Industry Volume K Unit Forecast, by Geography 2019 & 2032
- Table 47: Asia-Pacific Cancer Biomarkers Industry Revenue Million Forecast, by Country 2019 & 2032
- Table 48: Asia-Pacific Cancer Biomarkers Industry Volume K Unit Forecast, by Country 2019 & 2032
- Table 49: Asia-Pacific Cancer Biomarkers Industry Revenue Million Forecast, by Cancer Type 2019 & 2032
- Table 50: Asia-Pacific Cancer Biomarkers Industry Volume K Unit Forecast, by Cancer Type 2019 & 2032
- Table 51: Asia-Pacific Cancer Biomarkers Industry Revenue Million Forecast, by Type of Biomarker 2019 & 2032
- Table 52: Asia-Pacific Cancer Biomarkers Industry Volume K Unit Forecast, by Type of Biomarker 2019 & 2032
- Table 53: Asia-Pacific Cancer Biomarkers Industry Revenue Million Forecast, by Profiling Technology 2019 & 2032
- Table 54: Asia-Pacific Cancer Biomarkers Industry Volume K Unit Forecast, by Profiling Technology 2019 & 2032
- Table 55: Asia-Pacific Cancer Biomarkers Industry Revenue Million Forecast, by Geography 2019 & 2032
- Table 56: Asia-Pacific Cancer Biomarkers Industry Volume K Unit Forecast, by Geography 2019 & 2032
- Table 57: Asia-Pacific Cancer Biomarkers Industry Revenue Million Forecast, by Country 2019 & 2032
- Table 58: Asia-Pacific Cancer Biomarkers Industry Volume K Unit Forecast, by Country 2019 & 2032
- Table 59: Asia-Pacific Cancer Biomarkers Industry Revenue Million Forecast, by Cancer Type 2019 & 2032
- Table 60: Asia-Pacific Cancer Biomarkers Industry Volume K Unit Forecast, by Cancer Type 2019 & 2032
- Table 61: Asia-Pacific Cancer Biomarkers Industry Revenue Million Forecast, by Type of Biomarker 2019 & 2032
- Table 62: Asia-Pacific Cancer Biomarkers Industry Volume K Unit Forecast, by Type of Biomarker 2019 & 2032
- Table 63: Asia-Pacific Cancer Biomarkers Industry Revenue Million Forecast, by Profiling Technology 2019 & 2032
- Table 64: Asia-Pacific Cancer Biomarkers Industry Volume K Unit Forecast, by Profiling Technology 2019 & 2032
- Table 65: Asia-Pacific Cancer Biomarkers Industry Revenue Million Forecast, by Geography 2019 & 2032
- Table 66: Asia-Pacific Cancer Biomarkers Industry Volume K Unit Forecast, by Geography 2019 & 2032
- Table 67: Asia-Pacific Cancer Biomarkers Industry Revenue Million Forecast, by Country 2019 & 2032
- Table 68: Asia-Pacific Cancer Biomarkers Industry Volume K Unit Forecast, by Country 2019 & 2032
- Table 69: Asia-Pacific Cancer Biomarkers Industry Revenue Million Forecast, by Cancer Type 2019 & 2032
- Table 70: Asia-Pacific Cancer Biomarkers Industry Volume K Unit Forecast, by Cancer Type 2019 & 2032
- Table 71: Asia-Pacific Cancer Biomarkers Industry Revenue Million Forecast, by Type of Biomarker 2019 & 2032
- Table 72: Asia-Pacific Cancer Biomarkers Industry Volume K Unit Forecast, by Type of Biomarker 2019 & 2032
- Table 73: Asia-Pacific Cancer Biomarkers Industry Revenue Million Forecast, by Profiling Technology 2019 & 2032
- Table 74: Asia-Pacific Cancer Biomarkers Industry Volume K Unit Forecast, by Profiling Technology 2019 & 2032
- Table 75: Asia-Pacific Cancer Biomarkers Industry Revenue Million Forecast, by Geography 2019 & 2032
- Table 76: Asia-Pacific Cancer Biomarkers Industry Volume K Unit Forecast, by Geography 2019 & 2032
- Table 77: Asia-Pacific Cancer Biomarkers Industry Revenue Million Forecast, by Country 2019 & 2032
- Table 78: Asia-Pacific Cancer Biomarkers Industry Volume K Unit Forecast, by Country 2019 & 2032
- Table 79: Asia-Pacific Cancer Biomarkers Industry Revenue Million Forecast, by Cancer Type 2019 & 2032
- Table 80: Asia-Pacific Cancer Biomarkers Industry Volume K Unit Forecast, by Cancer Type 2019 & 2032
- Table 81: Asia-Pacific Cancer Biomarkers Industry Revenue Million Forecast, by Type of Biomarker 2019 & 2032
- Table 82: Asia-Pacific Cancer Biomarkers Industry Volume K Unit Forecast, by Type of Biomarker 2019 & 2032
- Table 83: Asia-Pacific Cancer Biomarkers Industry Revenue Million Forecast, by Profiling Technology 2019 & 2032
- Table 84: Asia-Pacific Cancer Biomarkers Industry Volume K Unit Forecast, by Profiling Technology 2019 & 2032
- Table 85: Asia-Pacific Cancer Biomarkers Industry Revenue Million Forecast, by Geography 2019 & 2032
- Table 86: Asia-Pacific Cancer Biomarkers Industry Volume K Unit Forecast, by Geography 2019 & 2032
- Table 87: Asia-Pacific Cancer Biomarkers Industry Revenue Million Forecast, by Country 2019 & 2032
- Table 88: Asia-Pacific Cancer Biomarkers Industry Volume K Unit Forecast, by Country 2019 & 2032
Frequently Asked Questions
1. What is the projected Compound Annual Growth Rate (CAGR) of the Asia-Pacific Cancer Biomarkers Industry?
The projected CAGR is approximately 12.50%.
2. Which companies are prominent players in the Asia-Pacific Cancer Biomarkers Industry?
Key companies in the market include BioVision Inc (Abcam), Merck & Co Inc, Biomerieux SA, F Hoffmann-La Roche Ltd, Hologic Inc, Celera Corporation (Quest Diagnostics), ASURAGEN INC, Qiagen NV, Illumina Inc, Abbott Laboratories Inc, Thermo Fisher Scientific, Agilent Technologies.
3. What are the main segments of the Asia-Pacific Cancer Biomarkers Industry?
The market segments include Cancer Type, Type of Biomarker, Profiling Technology, Geography.
4. Can you provide details about the market size?
The market size is estimated to be USD XX Million as of 2022.
5. What are some drivers contributing to market growth?
Rising Prevalence of Cancer; Increasing Research Activities and Growing Usage of Biomarkers in Drug Development.
6. What are the notable trends driving market growth?
Breast Cancer is Expected to Grow with a Significant CAGR in the Market Over the Forecast Period.
7. Are there any restraints impacting market growth?
High Cost of Diagnosis; Reimbursement Issues.
8. Can you provide examples of recent developments in the market?
October 2022: The Garvan Institute of Medical Research in Australia discovered a new biomarker for prostate cancer that could lead to better diagnosis and treatment for men with the aggressive form of this disease.
9. What pricing options are available for accessing the report?
Pricing options include single-user, multi-user, and enterprise licenses priced at USD 4750, USD 5250, and USD 8750 respectively.
10. Is the market size provided in terms of value or volume?
The market size is provided in terms of value, measured in Million and volume, measured in K Unit.
11. Are there any specific market keywords associated with the report?
Yes, the market keyword associated with the report is "Asia-Pacific Cancer Biomarkers Industry," which aids in identifying and referencing the specific market segment covered.
12. How do I determine which pricing option suits my needs best?
The pricing options vary based on user requirements and access needs. Individual users may opt for single-user licenses, while businesses requiring broader access may choose multi-user or enterprise licenses for cost-effective access to the report.
13. Are there any additional resources or data provided in the Asia-Pacific Cancer Biomarkers Industry report?
While the report offers comprehensive insights, it's advisable to review the specific contents or supplementary materials provided to ascertain if additional resources or data are available.
14. How can I stay updated on further developments or reports in the Asia-Pacific Cancer Biomarkers Industry?
To stay informed about further developments, trends, and reports in the Asia-Pacific Cancer Biomarkers Industry, consider subscribing to industry newsletters, following relevant companies and organizations, or regularly checking reputable industry news sources and publications.
Methodology
Step 1 - Identification of Relevant Samples Size from Population Database


Step 2 - Approaches for Defining Global Market Size (Value, Volume* & Price*)

Note*: In applicable scenarios
Step 3 - Data Sources
Primary Research
- Web Analytics
- Survey Reports
- Research Institute
- Latest Research Reports
- Opinion Leaders
Secondary Research
- Annual Reports
- White Paper
- Latest Press Release
- Industry Association
- Paid Database
- Investor Presentations

Step 4 - Data Triangulation
Involves using different sources of information in order to increase the validity of a study
These sources are likely to be stakeholders in a program - participants, other researchers, program staff, other community members, and so on.
Then we put all data in single framework & apply various statistical tools to find out the dynamic on the market.
During the analysis stage, feedback from the stakeholder groups would be compared to determine areas of agreement as well as areas of divergence


