
Key Insights
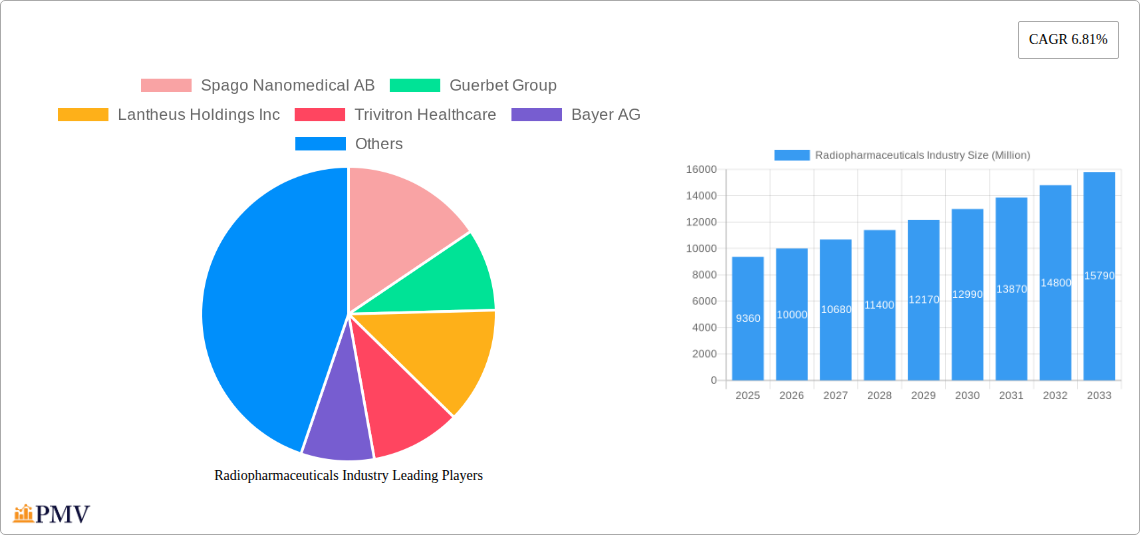
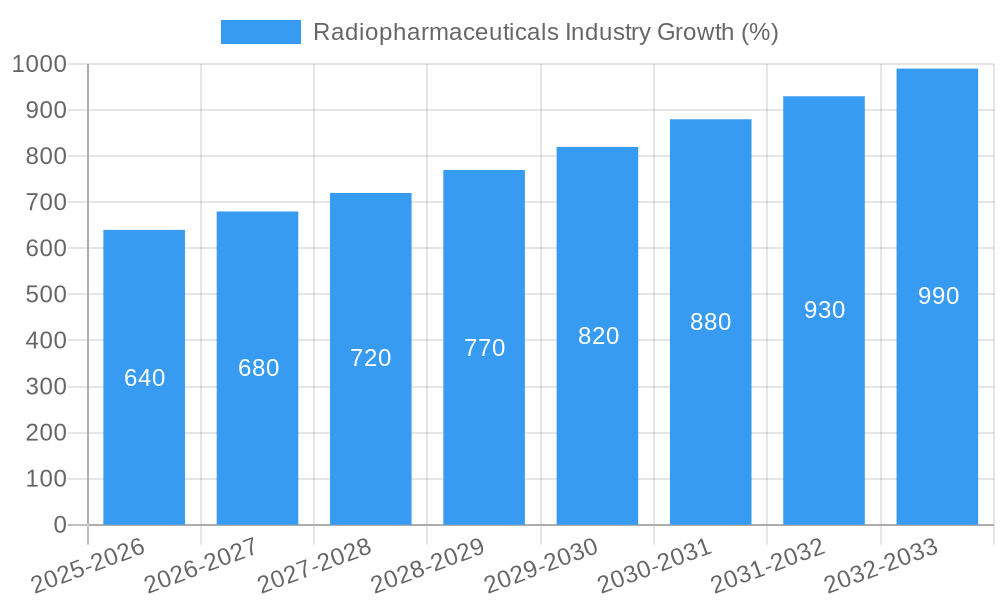
The global radiopharmaceuticals market, valued at $9.36 billion in 2025, is projected to experience robust growth, exhibiting a compound annual growth rate (CAGR) of 6.81% from 2025 to 2033. This expansion is fueled by several key factors. The rising prevalence of chronic diseases like cancer, cardiovascular ailments, and neurological disorders is driving increased demand for diagnostic and therapeutic radiopharmaceuticals. Advancements in imaging technologies, such as SPECT and PET, are enhancing diagnostic capabilities, leading to earlier and more accurate disease detection. Furthermore, the development of novel radiopharmaceuticals with improved efficacy and reduced side effects is contributing to market growth. The increasing adoption of targeted therapies, particularly in oncology, is another significant driver. Growth is also expected to be stimulated by ongoing research and development efforts focused on improving existing radiopharmaceuticals and developing new ones for unmet medical needs. This includes exploring new radioisotopes and developing more targeted delivery systems for improved therapeutic outcomes.
However, the market faces certain challenges. Regulatory hurdles associated with the approval and licensing of new radiopharmaceuticals can slow down market entry and expansion. The high cost of production and the specialized infrastructure required for handling radioactive materials can limit accessibility and affordability, particularly in developing nations. Competition among established players and emerging companies could also impact market dynamics. Nevertheless, the substantial unmet medical needs, coupled with continuous technological innovations and expanding healthcare infrastructure, particularly in emerging economies, promise to propel the radiopharmaceuticals market to significant growth in the coming years. The market segmentation by imaging modality (SPECT, PET, Ultrasound), diagnostic and therapeutic applications, and regional variations will influence specific growth trajectories within the broader market.
Radiopharmaceuticals Industry: Market Analysis, Trends, and Forecast 2019-2033
This comprehensive report provides an in-depth analysis of the Radiopharmaceuticals industry, offering valuable insights into market dynamics, competitive landscapes, and future growth prospects. The study period covers 2019-2033, with a base year of 2025 and a forecast period of 2025-2033. The report utilizes data from the historical period (2019-2024) to project future market trends. The global market size in 2025 is estimated at $XX Million.
Radiopharmaceuticals Industry Market Structure & Competitive Dynamics
The radiopharmaceuticals market is characterized by a moderately concentrated structure with several key players vying for market share. Market concentration is influenced by factors including regulatory hurdles, technological advancements, and the complex manufacturing processes involved. Innovation ecosystems play a vital role, with significant investment in R&D driving the development of novel radiopharmaceuticals and imaging technologies. Stringent regulatory frameworks, particularly concerning safety and efficacy, shape industry practices and influence market entry. The presence of substitute products, such as alternative imaging modalities (e.g., MRI, CT), creates competitive pressure. End-user trends, driven by increasing demand for minimally invasive diagnostic and therapeutic procedures, are key growth drivers. Mergers and acquisitions (M&A) activities have been significant, with deal values exceeding $XX Million in recent years, leading to consolidation within the industry and reshaping competitive landscapes.
- Market Share: The top 5 players hold approximately 60% of the global market share in 2025.
- M&A Activity: Significant M&A activity has been observed in the past five years, with an estimated $XX Million in deal value. Examples include [Insert specific M&A examples with deal values if available, otherwise state "Specific deal details are confidential"].
- Competitive Dynamics: Competition is intense, characterized by ongoing innovation, pricing pressures, and strategic partnerships.
Radiopharmaceuticals Industry Industry Trends & Insights
The radiopharmaceuticals market is experiencing robust growth, driven by several factors. Technological advancements, such as the development of novel radiotracers and improved imaging techniques, are enhancing diagnostic accuracy and therapeutic effectiveness. Increasing prevalence of chronic diseases, particularly cancer and cardiovascular diseases, is fuelling demand for advanced diagnostic tools. Consumer preferences are shifting towards minimally invasive procedures, bolstering the adoption of radiopharmaceuticals. Furthermore, supportive regulatory policies and increasing healthcare expenditure in several regions are contributing to market expansion. The Compound Annual Growth Rate (CAGR) is projected to be XX% during the forecast period (2025-2033). Market penetration is expected to reach XX% by 2033. Competitive dynamics remain fierce, with companies investing heavily in R&D and strategic alliances to maintain their market positions.
Dominant Markets & Segments in Radiopharmaceuticals Industry
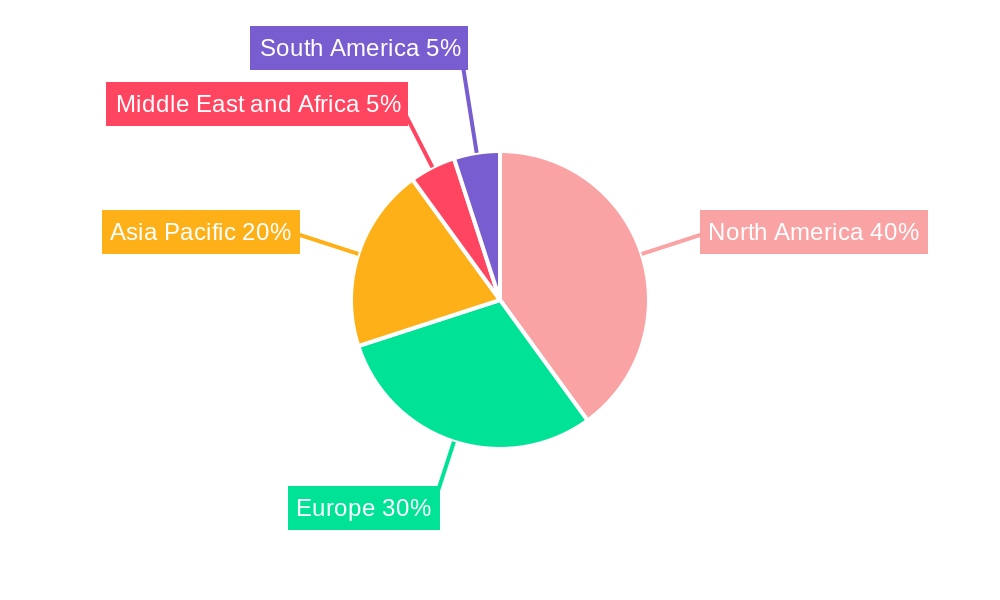
The North American region holds the largest market share, driven by high healthcare expenditure, advanced healthcare infrastructure, and the presence of major industry players. Within segments, PET imaging holds a significant share due to its high sensitivity and specificity. The therapeutic application segment shows strong growth potential, particularly in oncology, with lymphoma and endocrine tumor treatments representing substantial market segments.
Key Drivers for North American Dominance:
- High healthcare expenditure
- Advanced healthcare infrastructure
- Strong regulatory framework
- Presence of major industry players
- High adoption rate of advanced diagnostic imaging technologies.
Dominant Segments: PET imaging (F-18 FDG dominates), therapeutic applications for oncology (lymphoma and endocrine tumors), and SPECT applications for cardiology.
Regional Market Share: North America accounts for approximately 40% of the global market. Europe and Asia Pacific are also key markets, with substantial growth potential.
Radiopharmaceuticals Industry Product Innovations
Recent advancements focus on developing targeted radiopharmaceuticals, theranostic agents, and improved imaging technologies to enhance diagnostic accuracy and treatment efficacy. These innovations aim to improve patient outcomes, reduce side effects, and increase the efficiency of cancer detection and treatment. The focus is on precision medicine approaches, allowing for personalized therapies and more targeted diagnostic imaging.
Report Segmentation & Scope
The report segments the radiopharmaceuticals market by various parameters, including:
Radiopharmaceuticals: By Type of Imaging Modality: SPECT, PET, Ultrasound, etc. – Growth projections vary significantly depending on technological advancement and adoption in different healthcare settings.
Diagnostic Application: SPECT Applications (Cardiology, Oncology, etc.), PET Applications (Oncology, Neurology etc.), Ultrasound Applications (various). – Market size and growth projections for each application are influenced by disease prevalence and the use of other imaging modalities.
Therapeutic Application: Thyroid, Lymphoma, Endocrine Tumors, Other Therapeutic Applications. – Growth varies due to treatment efficacy, patient access, and the availability of other therapeutic options.
Contrast Media: By Type: Detailed analysis of specific contrast media types, their uses, and market sizes are provided.
Barium-based Contrast Media: By Procedure: Segmentation is included based on the specific procedures where barium-based contrast media is used, allowing for a more granular understanding of market trends.
SPECT: Tc-, Tl-, Ga-, I-, Other SPECTs – Each isotope has a specific application, impacting market size.
PET: F-, Rb-, Other PETs – Similar to SPECT, each isotope has specific applications and market sizes.
By Application: This section delves into the application-specific market sizes of radiopharmaceuticals, breaking down the use by modality and clinical area.
Other SPECT Applications and PET Applications: This includes a detailed discussion of novel applications and emerging uses for these modalities.
Ultrasound: By Application: This examines the use of radiopharmaceuticals in conjunction with ultrasound technologies for specific medical applications.
Key Drivers of Radiopharmaceuticals Industry Growth
Technological advancements, rising prevalence of chronic diseases (especially cancer), increasing healthcare spending, supportive regulatory frameworks, and growing demand for minimally invasive procedures are driving market growth. The development of new and improved radiotracers, improved imaging techniques, and targeted therapies all contribute to accelerated growth.
Challenges in the Radiopharmaceuticals Industry Sector
Challenges include stringent regulatory approvals, complex manufacturing processes, potential supply chain disruptions, and price competition. Regulatory hurdles impact the time to market for new products, while manufacturing complexities influence production costs. Supply chain issues (particularly isotope availability) can lead to shortages and price fluctuations, impacting market stability.
Leading Players in the Radiopharmaceuticals Industry Market
- Spago Nanomedical AB
- Guerbet Group
- Lantheus Holdings Inc
- Trivitron Healthcare
- Bayer AG
- Siemens Healthineers
- Otsuka Pharmaceuticals Co Ltd
- Nano Therapeutics Pvt Ltd
- GE Company (GE Healthcare)
- Bracco Imaging SpA
- Triad Isotopes
- Cardinal Health Inc
- NTP Radioisotopes SOC Ltd
- Koninklijke Philips NV
- Curium Pharma
Key Developments in Radiopharmaceuticals Industry Sector
- 2022 Q4: Lantheus Holdings Inc. launched a new radiopharmaceutical for myocardial perfusion imaging.
- 2023 Q1: Guerbet Group announced a strategic partnership to expand its radiopharmaceutical portfolio in Asia.
- 2023 Q2: Several companies announced significant investments in R&D for targeted radiopharmaceuticals.
- [Add more specific examples with dates and impacts if available]
Strategic Radiopharmaceuticals Industry Market Outlook
The radiopharmaceuticals market presents significant growth opportunities, driven by technological innovation and increasing healthcare needs. Focus on personalized medicine, advancements in targeted therapies, and expansion into emerging markets will shape the future of the industry. Strategic partnerships, acquisitions, and continued R&D investment are crucial for companies to capitalize on this growth potential.
Radiopharmaceuticals Industry Segmentation
-
1. Imaging Modality
- 1.1. SPECT
- 1.2. PET
- 1.3. MRI
- 1.4. Ultrasound
-
2. Application
- 2.1. Oncology
- 2.2. Cardiology
- 2.3. Neurology
- 2.4. Gastrointestinal
-
3. Type
- 3.1. Radiopharmaceuticals
- 3.2. Contrast media
Radiopharmaceuticals Industry Segmentation By Geography
-
1. North America
- 1.1. United States
- 1.2. Canada
- 1.3. Mexico
-
2. Europe
- 2.1. United Kingdom
- 2.2. Germany
- 2.3. France
- 2.4. Italy
- 2.5. Spain
- 2.6. Rest of Europe
-
3. Asia Pacific
- 3.1. China
- 3.2. Japan
- 3.3. India
- 3.4. Australia
- 3.5. South Korea
- 3.6. Rest of Asia Pacific
-
4. Middle East and Africa
- 4.1. GCC
- 4.2. South Africa
- 4.3. Rest of Middle East and Africa
-
5. South America
- 5.1. Brazil
- 5.2. Argentina
- 5.3. Rest of South America
Radiopharmaceuticals Industry REPORT HIGHLIGHTS
| Aspects | Details |
|---|---|
| Study Period | 2019-2033 |
| Base Year | 2024 |
| Estimated Year | 2025 |
| Forecast Period | 2025-2033 |
| Historical Period | 2019-2024 |
| Growth Rate | CAGR of 6.81% from 2019-2033 |
| Segmentation |
|
Table of Contents
- 1. Introduction
- 1.1. Research Scope
- 1.2. Market Segmentation
- 1.3. Research Methodology
- 1.4. Definitions and Assumptions
- 2. Executive Summary
- 2.1. Introduction
- 3. Market Dynamics
- 3.1. Introduction
- 3.2. Market Drivers
- 3.2.1. Technology Advancements in Medical Imaging; Increasing Demand for Image-guided Procedures and Diagnostics; High Prevalence of Cancers and Cardiac Diseases
- 3.3. Market Restrains
- 3.3.1. High Costs of the Techniques; Limited Health Insurance Coverage; Short Half-life of Radiopharmaceuticals
- 3.4. Market Trends
- 3.4.1 The Cardiology Sub-segment Captured the Largest Market Share
- 3.4.2 and It is Expected to Retain its Dominance Over the Forecast Period
- 4. Market Factor Analysis
- 4.1. Porters Five Forces
- 4.2. Supply/Value Chain
- 4.3. PESTEL analysis
- 4.4. Market Entropy
- 4.5. Patent/Trademark Analysis
- 5. Global Radiopharmaceuticals Industry Analysis, Insights and Forecast, 2019-2031
- 5.1. Market Analysis, Insights and Forecast - by Imaging Modality
- 5.1.1. SPECT
- 5.1.2. PET
- 5.1.3. MRI
- 5.1.4. Ultrasound
- 5.2. Market Analysis, Insights and Forecast - by Application
- 5.2.1. Oncology
- 5.2.2. Cardiology
- 5.2.3. Neurology
- 5.2.4. Gastrointestinal
- 5.3. Market Analysis, Insights and Forecast - by Type
- 5.3.1. Radiopharmaceuticals
- 5.3.2. Contrast media
- 5.4. Market Analysis, Insights and Forecast - by Region
- 5.4.1. North America
- 5.4.2. Europe
- 5.4.3. Asia Pacific
- 5.4.4. Middle East and Africa
- 5.4.5. South America
- 5.1. Market Analysis, Insights and Forecast - by Imaging Modality
- 6. North America Radiopharmaceuticals Industry Analysis, Insights and Forecast, 2019-2031
- 6.1. Market Analysis, Insights and Forecast - by Imaging Modality
- 6.1.1. SPECT
- 6.1.2. PET
- 6.1.3. MRI
- 6.1.4. Ultrasound
- 6.2. Market Analysis, Insights and Forecast - by Application
- 6.2.1. Oncology
- 6.2.2. Cardiology
- 6.2.3. Neurology
- 6.2.4. Gastrointestinal
- 6.3. Market Analysis, Insights and Forecast - by Type
- 6.3.1. Radiopharmaceuticals
- 6.3.2. Contrast media
- 6.1. Market Analysis, Insights and Forecast - by Imaging Modality
- 7. Europe Radiopharmaceuticals Industry Analysis, Insights and Forecast, 2019-2031
- 7.1. Market Analysis, Insights and Forecast - by Imaging Modality
- 7.1.1. SPECT
- 7.1.2. PET
- 7.1.3. MRI
- 7.1.4. Ultrasound
- 7.2. Market Analysis, Insights and Forecast - by Application
- 7.2.1. Oncology
- 7.2.2. Cardiology
- 7.2.3. Neurology
- 7.2.4. Gastrointestinal
- 7.3. Market Analysis, Insights and Forecast - by Type
- 7.3.1. Radiopharmaceuticals
- 7.3.2. Contrast media
- 7.1. Market Analysis, Insights and Forecast - by Imaging Modality
- 8. Asia Pacific Radiopharmaceuticals Industry Analysis, Insights and Forecast, 2019-2031
- 8.1. Market Analysis, Insights and Forecast - by Imaging Modality
- 8.1.1. SPECT
- 8.1.2. PET
- 8.1.3. MRI
- 8.1.4. Ultrasound
- 8.2. Market Analysis, Insights and Forecast - by Application
- 8.2.1. Oncology
- 8.2.2. Cardiology
- 8.2.3. Neurology
- 8.2.4. Gastrointestinal
- 8.3. Market Analysis, Insights and Forecast - by Type
- 8.3.1. Radiopharmaceuticals
- 8.3.2. Contrast media
- 8.1. Market Analysis, Insights and Forecast - by Imaging Modality
- 9. Middle East and Africa Radiopharmaceuticals Industry Analysis, Insights and Forecast, 2019-2031
- 9.1. Market Analysis, Insights and Forecast - by Imaging Modality
- 9.1.1. SPECT
- 9.1.2. PET
- 9.1.3. MRI
- 9.1.4. Ultrasound
- 9.2. Market Analysis, Insights and Forecast - by Application
- 9.2.1. Oncology
- 9.2.2. Cardiology
- 9.2.3. Neurology
- 9.2.4. Gastrointestinal
- 9.3. Market Analysis, Insights and Forecast - by Type
- 9.3.1. Radiopharmaceuticals
- 9.3.2. Contrast media
- 9.1. Market Analysis, Insights and Forecast - by Imaging Modality
- 10. South America Radiopharmaceuticals Industry Analysis, Insights and Forecast, 2019-2031
- 10.1. Market Analysis, Insights and Forecast - by Imaging Modality
- 10.1.1. SPECT
- 10.1.2. PET
- 10.1.3. MRI
- 10.1.4. Ultrasound
- 10.2. Market Analysis, Insights and Forecast - by Application
- 10.2.1. Oncology
- 10.2.2. Cardiology
- 10.2.3. Neurology
- 10.2.4. Gastrointestinal
- 10.3. Market Analysis, Insights and Forecast - by Type
- 10.3.1. Radiopharmaceuticals
- 10.3.2. Contrast media
- 10.1. Market Analysis, Insights and Forecast - by Imaging Modality
- 11. North America Radiopharmaceuticals Industry Analysis, Insights and Forecast, 2019-2031
- 11.1. Market Analysis, Insights and Forecast - By Country/Sub-region
- 11.1.1 United States
- 11.1.2 Canada
- 11.1.3 Mexico
- 12. Europe Radiopharmaceuticals Industry Analysis, Insights and Forecast, 2019-2031
- 12.1. Market Analysis, Insights and Forecast - By Country/Sub-region
- 12.1.1 United Kingdom
- 12.1.2 Germany
- 12.1.3 France
- 12.1.4 Italy
- 12.1.5 Spain
- 12.1.6 Rest of Europe
- 13. Asia Pacific Radiopharmaceuticals Industry Analysis, Insights and Forecast, 2019-2031
- 13.1. Market Analysis, Insights and Forecast - By Country/Sub-region
- 13.1.1 China
- 13.1.2 Japan
- 13.1.3 India
- 13.1.4 Australia
- 13.1.5 South Korea
- 13.1.6 Rest of Asia Pacific
- 14. Middle East and Africa Radiopharmaceuticals Industry Analysis, Insights and Forecast, 2019-2031
- 14.1. Market Analysis, Insights and Forecast - By Country/Sub-region
- 14.1.1 GCC
- 14.1.2 South Africa
- 14.1.3 Rest of Middle East and Africa
- 15. South America Radiopharmaceuticals Industry Analysis, Insights and Forecast, 2019-2031
- 15.1. Market Analysis, Insights and Forecast - By Country/Sub-region
- 15.1.1 Brazil
- 15.1.2 Argentina
- 15.1.3 Rest of South America
- 16. Competitive Analysis
- 16.1. Global Market Share Analysis 2024
- 16.2. Company Profiles
- 16.2.1 Spago Nanomedical AB
- 16.2.1.1. Overview
- 16.2.1.2. Products
- 16.2.1.3. SWOT Analysis
- 16.2.1.4. Recent Developments
- 16.2.1.5. Financials (Based on Availability)
- 16.2.2 Guerbet Group
- 16.2.2.1. Overview
- 16.2.2.2. Products
- 16.2.2.3. SWOT Analysis
- 16.2.2.4. Recent Developments
- 16.2.2.5. Financials (Based on Availability)
- 16.2.3 Lantheus Holdings Inc
- 16.2.3.1. Overview
- 16.2.3.2. Products
- 16.2.3.3. SWOT Analysis
- 16.2.3.4. Recent Developments
- 16.2.3.5. Financials (Based on Availability)
- 16.2.4 Trivitron Healthcare
- 16.2.4.1. Overview
- 16.2.4.2. Products
- 16.2.4.3. SWOT Analysis
- 16.2.4.4. Recent Developments
- 16.2.4.5. Financials (Based on Availability)
- 16.2.5 Bayer AG
- 16.2.5.1. Overview
- 16.2.5.2. Products
- 16.2.5.3. SWOT Analysis
- 16.2.5.4. Recent Developments
- 16.2.5.5. Financials (Based on Availability)
- 16.2.6 Siemens Healthineers
- 16.2.6.1. Overview
- 16.2.6.2. Products
- 16.2.6.3. SWOT Analysis
- 16.2.6.4. Recent Developments
- 16.2.6.5. Financials (Based on Availability)
- 16.2.7 Otsuka Pharmaceuticals Co Ltd
- 16.2.7.1. Overview
- 16.2.7.2. Products
- 16.2.7.3. SWOT Analysis
- 16.2.7.4. Recent Developments
- 16.2.7.5. Financials (Based on Availability)
- 16.2.8 Nano Therapeutics Pvt Ltd
- 16.2.8.1. Overview
- 16.2.8.2. Products
- 16.2.8.3. SWOT Analysis
- 16.2.8.4. Recent Developments
- 16.2.8.5. Financials (Based on Availability)
- 16.2.9 GE Company (GE Healthcare)
- 16.2.9.1. Overview
- 16.2.9.2. Products
- 16.2.9.3. SWOT Analysis
- 16.2.9.4. Recent Developments
- 16.2.9.5. Financials (Based on Availability)
- 16.2.10 Bracco Imaging SpA
- 16.2.10.1. Overview
- 16.2.10.2. Products
- 16.2.10.3. SWOT Analysis
- 16.2.10.4. Recent Developments
- 16.2.10.5. Financials (Based on Availability)
- 16.2.11 Triad Isotopes
- 16.2.11.1. Overview
- 16.2.11.2. Products
- 16.2.11.3. SWOT Analysis
- 16.2.11.4. Recent Developments
- 16.2.11.5. Financials (Based on Availability)
- 16.2.12 Cardinal Health Inc
- 16.2.12.1. Overview
- 16.2.12.2. Products
- 16.2.12.3. SWOT Analysis
- 16.2.12.4. Recent Developments
- 16.2.12.5. Financials (Based on Availability)
- 16.2.13 NTP Radioisotopes SOC Ltd
- 16.2.13.1. Overview
- 16.2.13.2. Products
- 16.2.13.3. SWOT Analysis
- 16.2.13.4. Recent Developments
- 16.2.13.5. Financials (Based on Availability)
- 16.2.14 Koninklijke Philips NV
- 16.2.14.1. Overview
- 16.2.14.2. Products
- 16.2.14.3. SWOT Analysis
- 16.2.14.4. Recent Developments
- 16.2.14.5. Financials (Based on Availability)
- 16.2.15 Curium Pharma
- 16.2.15.1. Overview
- 16.2.15.2. Products
- 16.2.15.3. SWOT Analysis
- 16.2.15.4. Recent Developments
- 16.2.15.5. Financials (Based on Availability)
- 16.2.1 Spago Nanomedical AB
List of Figures
- Figure 1: Global Radiopharmaceuticals Industry Revenue Breakdown (Million, %) by Region 2024 & 2032
- Figure 2: Global Radiopharmaceuticals Industry Volume Breakdown (K Unit, %) by Region 2024 & 2032
- Figure 3: North America Radiopharmaceuticals Industry Revenue (Million), by Country 2024 & 2032
- Figure 4: North America Radiopharmaceuticals Industry Volume (K Unit), by Country 2024 & 2032
- Figure 5: North America Radiopharmaceuticals Industry Revenue Share (%), by Country 2024 & 2032
- Figure 6: North America Radiopharmaceuticals Industry Volume Share (%), by Country 2024 & 2032
- Figure 7: Europe Radiopharmaceuticals Industry Revenue (Million), by Country 2024 & 2032
- Figure 8: Europe Radiopharmaceuticals Industry Volume (K Unit), by Country 2024 & 2032
- Figure 9: Europe Radiopharmaceuticals Industry Revenue Share (%), by Country 2024 & 2032
- Figure 10: Europe Radiopharmaceuticals Industry Volume Share (%), by Country 2024 & 2032
- Figure 11: Asia Pacific Radiopharmaceuticals Industry Revenue (Million), by Country 2024 & 2032
- Figure 12: Asia Pacific Radiopharmaceuticals Industry Volume (K Unit), by Country 2024 & 2032
- Figure 13: Asia Pacific Radiopharmaceuticals Industry Revenue Share (%), by Country 2024 & 2032
- Figure 14: Asia Pacific Radiopharmaceuticals Industry Volume Share (%), by Country 2024 & 2032
- Figure 15: Middle East and Africa Radiopharmaceuticals Industry Revenue (Million), by Country 2024 & 2032
- Figure 16: Middle East and Africa Radiopharmaceuticals Industry Volume (K Unit), by Country 2024 & 2032
- Figure 17: Middle East and Africa Radiopharmaceuticals Industry Revenue Share (%), by Country 2024 & 2032
- Figure 18: Middle East and Africa Radiopharmaceuticals Industry Volume Share (%), by Country 2024 & 2032
- Figure 19: South America Radiopharmaceuticals Industry Revenue (Million), by Country 2024 & 2032
- Figure 20: South America Radiopharmaceuticals Industry Volume (K Unit), by Country 2024 & 2032
- Figure 21: South America Radiopharmaceuticals Industry Revenue Share (%), by Country 2024 & 2032
- Figure 22: South America Radiopharmaceuticals Industry Volume Share (%), by Country 2024 & 2032
- Figure 23: North America Radiopharmaceuticals Industry Revenue (Million), by Imaging Modality 2024 & 2032
- Figure 24: North America Radiopharmaceuticals Industry Volume (K Unit), by Imaging Modality 2024 & 2032
- Figure 25: North America Radiopharmaceuticals Industry Revenue Share (%), by Imaging Modality 2024 & 2032
- Figure 26: North America Radiopharmaceuticals Industry Volume Share (%), by Imaging Modality 2024 & 2032
- Figure 27: North America Radiopharmaceuticals Industry Revenue (Million), by Application 2024 & 2032
- Figure 28: North America Radiopharmaceuticals Industry Volume (K Unit), by Application 2024 & 2032
- Figure 29: North America Radiopharmaceuticals Industry Revenue Share (%), by Application 2024 & 2032
- Figure 30: North America Radiopharmaceuticals Industry Volume Share (%), by Application 2024 & 2032
- Figure 31: North America Radiopharmaceuticals Industry Revenue (Million), by Type 2024 & 2032
- Figure 32: North America Radiopharmaceuticals Industry Volume (K Unit), by Type 2024 & 2032
- Figure 33: North America Radiopharmaceuticals Industry Revenue Share (%), by Type 2024 & 2032
- Figure 34: North America Radiopharmaceuticals Industry Volume Share (%), by Type 2024 & 2032
- Figure 35: North America Radiopharmaceuticals Industry Revenue (Million), by Country 2024 & 2032
- Figure 36: North America Radiopharmaceuticals Industry Volume (K Unit), by Country 2024 & 2032
- Figure 37: North America Radiopharmaceuticals Industry Revenue Share (%), by Country 2024 & 2032
- Figure 38: North America Radiopharmaceuticals Industry Volume Share (%), by Country 2024 & 2032
- Figure 39: Europe Radiopharmaceuticals Industry Revenue (Million), by Imaging Modality 2024 & 2032
- Figure 40: Europe Radiopharmaceuticals Industry Volume (K Unit), by Imaging Modality 2024 & 2032
- Figure 41: Europe Radiopharmaceuticals Industry Revenue Share (%), by Imaging Modality 2024 & 2032
- Figure 42: Europe Radiopharmaceuticals Industry Volume Share (%), by Imaging Modality 2024 & 2032
- Figure 43: Europe Radiopharmaceuticals Industry Revenue (Million), by Application 2024 & 2032
- Figure 44: Europe Radiopharmaceuticals Industry Volume (K Unit), by Application 2024 & 2032
- Figure 45: Europe Radiopharmaceuticals Industry Revenue Share (%), by Application 2024 & 2032
- Figure 46: Europe Radiopharmaceuticals Industry Volume Share (%), by Application 2024 & 2032
- Figure 47: Europe Radiopharmaceuticals Industry Revenue (Million), by Type 2024 & 2032
- Figure 48: Europe Radiopharmaceuticals Industry Volume (K Unit), by Type 2024 & 2032
- Figure 49: Europe Radiopharmaceuticals Industry Revenue Share (%), by Type 2024 & 2032
- Figure 50: Europe Radiopharmaceuticals Industry Volume Share (%), by Type 2024 & 2032
- Figure 51: Europe Radiopharmaceuticals Industry Revenue (Million), by Country 2024 & 2032
- Figure 52: Europe Radiopharmaceuticals Industry Volume (K Unit), by Country 2024 & 2032
- Figure 53: Europe Radiopharmaceuticals Industry Revenue Share (%), by Country 2024 & 2032
- Figure 54: Europe Radiopharmaceuticals Industry Volume Share (%), by Country 2024 & 2032
- Figure 55: Asia Pacific Radiopharmaceuticals Industry Revenue (Million), by Imaging Modality 2024 & 2032
- Figure 56: Asia Pacific Radiopharmaceuticals Industry Volume (K Unit), by Imaging Modality 2024 & 2032
- Figure 57: Asia Pacific Radiopharmaceuticals Industry Revenue Share (%), by Imaging Modality 2024 & 2032
- Figure 58: Asia Pacific Radiopharmaceuticals Industry Volume Share (%), by Imaging Modality 2024 & 2032
- Figure 59: Asia Pacific Radiopharmaceuticals Industry Revenue (Million), by Application 2024 & 2032
- Figure 60: Asia Pacific Radiopharmaceuticals Industry Volume (K Unit), by Application 2024 & 2032
- Figure 61: Asia Pacific Radiopharmaceuticals Industry Revenue Share (%), by Application 2024 & 2032
- Figure 62: Asia Pacific Radiopharmaceuticals Industry Volume Share (%), by Application 2024 & 2032
- Figure 63: Asia Pacific Radiopharmaceuticals Industry Revenue (Million), by Type 2024 & 2032
- Figure 64: Asia Pacific Radiopharmaceuticals Industry Volume (K Unit), by Type 2024 & 2032
- Figure 65: Asia Pacific Radiopharmaceuticals Industry Revenue Share (%), by Type 2024 & 2032
- Figure 66: Asia Pacific Radiopharmaceuticals Industry Volume Share (%), by Type 2024 & 2032
- Figure 67: Asia Pacific Radiopharmaceuticals Industry Revenue (Million), by Country 2024 & 2032
- Figure 68: Asia Pacific Radiopharmaceuticals Industry Volume (K Unit), by Country 2024 & 2032
- Figure 69: Asia Pacific Radiopharmaceuticals Industry Revenue Share (%), by Country 2024 & 2032
- Figure 70: Asia Pacific Radiopharmaceuticals Industry Volume Share (%), by Country 2024 & 2032
- Figure 71: Middle East and Africa Radiopharmaceuticals Industry Revenue (Million), by Imaging Modality 2024 & 2032
- Figure 72: Middle East and Africa Radiopharmaceuticals Industry Volume (K Unit), by Imaging Modality 2024 & 2032
- Figure 73: Middle East and Africa Radiopharmaceuticals Industry Revenue Share (%), by Imaging Modality 2024 & 2032
- Figure 74: Middle East and Africa Radiopharmaceuticals Industry Volume Share (%), by Imaging Modality 2024 & 2032
- Figure 75: Middle East and Africa Radiopharmaceuticals Industry Revenue (Million), by Application 2024 & 2032
- Figure 76: Middle East and Africa Radiopharmaceuticals Industry Volume (K Unit), by Application 2024 & 2032
- Figure 77: Middle East and Africa Radiopharmaceuticals Industry Revenue Share (%), by Application 2024 & 2032
- Figure 78: Middle East and Africa Radiopharmaceuticals Industry Volume Share (%), by Application 2024 & 2032
- Figure 79: Middle East and Africa Radiopharmaceuticals Industry Revenue (Million), by Type 2024 & 2032
- Figure 80: Middle East and Africa Radiopharmaceuticals Industry Volume (K Unit), by Type 2024 & 2032
- Figure 81: Middle East and Africa Radiopharmaceuticals Industry Revenue Share (%), by Type 2024 & 2032
- Figure 82: Middle East and Africa Radiopharmaceuticals Industry Volume Share (%), by Type 2024 & 2032
- Figure 83: Middle East and Africa Radiopharmaceuticals Industry Revenue (Million), by Country 2024 & 2032
- Figure 84: Middle East and Africa Radiopharmaceuticals Industry Volume (K Unit), by Country 2024 & 2032
- Figure 85: Middle East and Africa Radiopharmaceuticals Industry Revenue Share (%), by Country 2024 & 2032
- Figure 86: Middle East and Africa Radiopharmaceuticals Industry Volume Share (%), by Country 2024 & 2032
- Figure 87: South America Radiopharmaceuticals Industry Revenue (Million), by Imaging Modality 2024 & 2032
- Figure 88: South America Radiopharmaceuticals Industry Volume (K Unit), by Imaging Modality 2024 & 2032
- Figure 89: South America Radiopharmaceuticals Industry Revenue Share (%), by Imaging Modality 2024 & 2032
- Figure 90: South America Radiopharmaceuticals Industry Volume Share (%), by Imaging Modality 2024 & 2032
- Figure 91: South America Radiopharmaceuticals Industry Revenue (Million), by Application 2024 & 2032
- Figure 92: South America Radiopharmaceuticals Industry Volume (K Unit), by Application 2024 & 2032
- Figure 93: South America Radiopharmaceuticals Industry Revenue Share (%), by Application 2024 & 2032
- Figure 94: South America Radiopharmaceuticals Industry Volume Share (%), by Application 2024 & 2032
- Figure 95: South America Radiopharmaceuticals Industry Revenue (Million), by Type 2024 & 2032
- Figure 96: South America Radiopharmaceuticals Industry Volume (K Unit), by Type 2024 & 2032
- Figure 97: South America Radiopharmaceuticals Industry Revenue Share (%), by Type 2024 & 2032
- Figure 98: South America Radiopharmaceuticals Industry Volume Share (%), by Type 2024 & 2032
- Figure 99: South America Radiopharmaceuticals Industry Revenue (Million), by Country 2024 & 2032
- Figure 100: South America Radiopharmaceuticals Industry Volume (K Unit), by Country 2024 & 2032
- Figure 101: South America Radiopharmaceuticals Industry Revenue Share (%), by Country 2024 & 2032
- Figure 102: South America Radiopharmaceuticals Industry Volume Share (%), by Country 2024 & 2032
List of Tables
- Table 1: Global Radiopharmaceuticals Industry Revenue Million Forecast, by Region 2019 & 2032
- Table 2: Global Radiopharmaceuticals Industry Volume K Unit Forecast, by Region 2019 & 2032
- Table 3: Global Radiopharmaceuticals Industry Revenue Million Forecast, by Imaging Modality 2019 & 2032
- Table 4: Global Radiopharmaceuticals Industry Volume K Unit Forecast, by Imaging Modality 2019 & 2032
- Table 5: Global Radiopharmaceuticals Industry Revenue Million Forecast, by Application 2019 & 2032
- Table 6: Global Radiopharmaceuticals Industry Volume K Unit Forecast, by Application 2019 & 2032
- Table 7: Global Radiopharmaceuticals Industry Revenue Million Forecast, by Type 2019 & 2032
- Table 8: Global Radiopharmaceuticals Industry Volume K Unit Forecast, by Type 2019 & 2032
- Table 9: Global Radiopharmaceuticals Industry Revenue Million Forecast, by Region 2019 & 2032
- Table 10: Global Radiopharmaceuticals Industry Volume K Unit Forecast, by Region 2019 & 2032
- Table 11: Global Radiopharmaceuticals Industry Revenue Million Forecast, by Country 2019 & 2032
- Table 12: Global Radiopharmaceuticals Industry Volume K Unit Forecast, by Country 2019 & 2032
- Table 13: United States Radiopharmaceuticals Industry Revenue (Million) Forecast, by Application 2019 & 2032
- Table 14: United States Radiopharmaceuticals Industry Volume (K Unit) Forecast, by Application 2019 & 2032
- Table 15: Canada Radiopharmaceuticals Industry Revenue (Million) Forecast, by Application 2019 & 2032
- Table 16: Canada Radiopharmaceuticals Industry Volume (K Unit) Forecast, by Application 2019 & 2032
- Table 17: Mexico Radiopharmaceuticals Industry Revenue (Million) Forecast, by Application 2019 & 2032
- Table 18: Mexico Radiopharmaceuticals Industry Volume (K Unit) Forecast, by Application 2019 & 2032
- Table 19: Global Radiopharmaceuticals Industry Revenue Million Forecast, by Country 2019 & 2032
- Table 20: Global Radiopharmaceuticals Industry Volume K Unit Forecast, by Country 2019 & 2032
- Table 21: United Kingdom Radiopharmaceuticals Industry Revenue (Million) Forecast, by Application 2019 & 2032
- Table 22: United Kingdom Radiopharmaceuticals Industry Volume (K Unit) Forecast, by Application 2019 & 2032
- Table 23: Germany Radiopharmaceuticals Industry Revenue (Million) Forecast, by Application 2019 & 2032
- Table 24: Germany Radiopharmaceuticals Industry Volume (K Unit) Forecast, by Application 2019 & 2032
- Table 25: France Radiopharmaceuticals Industry Revenue (Million) Forecast, by Application 2019 & 2032
- Table 26: France Radiopharmaceuticals Industry Volume (K Unit) Forecast, by Application 2019 & 2032
- Table 27: Italy Radiopharmaceuticals Industry Revenue (Million) Forecast, by Application 2019 & 2032
- Table 28: Italy Radiopharmaceuticals Industry Volume (K Unit) Forecast, by Application 2019 & 2032
- Table 29: Spain Radiopharmaceuticals Industry Revenue (Million) Forecast, by Application 2019 & 2032
- Table 30: Spain Radiopharmaceuticals Industry Volume (K Unit) Forecast, by Application 2019 & 2032
- Table 31: Rest of Europe Radiopharmaceuticals Industry Revenue (Million) Forecast, by Application 2019 & 2032
- Table 32: Rest of Europe Radiopharmaceuticals Industry Volume (K Unit) Forecast, by Application 2019 & 2032
- Table 33: Global Radiopharmaceuticals Industry Revenue Million Forecast, by Country 2019 & 2032
- Table 34: Global Radiopharmaceuticals Industry Volume K Unit Forecast, by Country 2019 & 2032
- Table 35: China Radiopharmaceuticals Industry Revenue (Million) Forecast, by Application 2019 & 2032
- Table 36: China Radiopharmaceuticals Industry Volume (K Unit) Forecast, by Application 2019 & 2032
- Table 37: Japan Radiopharmaceuticals Industry Revenue (Million) Forecast, by Application 2019 & 2032
- Table 38: Japan Radiopharmaceuticals Industry Volume (K Unit) Forecast, by Application 2019 & 2032
- Table 39: India Radiopharmaceuticals Industry Revenue (Million) Forecast, by Application 2019 & 2032
- Table 40: India Radiopharmaceuticals Industry Volume (K Unit) Forecast, by Application 2019 & 2032
- Table 41: Australia Radiopharmaceuticals Industry Revenue (Million) Forecast, by Application 2019 & 2032
- Table 42: Australia Radiopharmaceuticals Industry Volume (K Unit) Forecast, by Application 2019 & 2032
- Table 43: South Korea Radiopharmaceuticals Industry Revenue (Million) Forecast, by Application 2019 & 2032
- Table 44: South Korea Radiopharmaceuticals Industry Volume (K Unit) Forecast, by Application 2019 & 2032
- Table 45: Rest of Asia Pacific Radiopharmaceuticals Industry Revenue (Million) Forecast, by Application 2019 & 2032
- Table 46: Rest of Asia Pacific Radiopharmaceuticals Industry Volume (K Unit) Forecast, by Application 2019 & 2032
- Table 47: Global Radiopharmaceuticals Industry Revenue Million Forecast, by Country 2019 & 2032
- Table 48: Global Radiopharmaceuticals Industry Volume K Unit Forecast, by Country 2019 & 2032
- Table 49: GCC Radiopharmaceuticals Industry Revenue (Million) Forecast, by Application 2019 & 2032
- Table 50: GCC Radiopharmaceuticals Industry Volume (K Unit) Forecast, by Application 2019 & 2032
- Table 51: South Africa Radiopharmaceuticals Industry Revenue (Million) Forecast, by Application 2019 & 2032
- Table 52: South Africa Radiopharmaceuticals Industry Volume (K Unit) Forecast, by Application 2019 & 2032
- Table 53: Rest of Middle East and Africa Radiopharmaceuticals Industry Revenue (Million) Forecast, by Application 2019 & 2032
- Table 54: Rest of Middle East and Africa Radiopharmaceuticals Industry Volume (K Unit) Forecast, by Application 2019 & 2032
- Table 55: Global Radiopharmaceuticals Industry Revenue Million Forecast, by Country 2019 & 2032
- Table 56: Global Radiopharmaceuticals Industry Volume K Unit Forecast, by Country 2019 & 2032
- Table 57: Brazil Radiopharmaceuticals Industry Revenue (Million) Forecast, by Application 2019 & 2032
- Table 58: Brazil Radiopharmaceuticals Industry Volume (K Unit) Forecast, by Application 2019 & 2032
- Table 59: Argentina Radiopharmaceuticals Industry Revenue (Million) Forecast, by Application 2019 & 2032
- Table 60: Argentina Radiopharmaceuticals Industry Volume (K Unit) Forecast, by Application 2019 & 2032
- Table 61: Rest of South America Radiopharmaceuticals Industry Revenue (Million) Forecast, by Application 2019 & 2032
- Table 62: Rest of South America Radiopharmaceuticals Industry Volume (K Unit) Forecast, by Application 2019 & 2032
- Table 63: Global Radiopharmaceuticals Industry Revenue Million Forecast, by Imaging Modality 2019 & 2032
- Table 64: Global Radiopharmaceuticals Industry Volume K Unit Forecast, by Imaging Modality 2019 & 2032
- Table 65: Global Radiopharmaceuticals Industry Revenue Million Forecast, by Application 2019 & 2032
- Table 66: Global Radiopharmaceuticals Industry Volume K Unit Forecast, by Application 2019 & 2032
- Table 67: Global Radiopharmaceuticals Industry Revenue Million Forecast, by Type 2019 & 2032
- Table 68: Global Radiopharmaceuticals Industry Volume K Unit Forecast, by Type 2019 & 2032
- Table 69: Global Radiopharmaceuticals Industry Revenue Million Forecast, by Country 2019 & 2032
- Table 70: Global Radiopharmaceuticals Industry Volume K Unit Forecast, by Country 2019 & 2032
- Table 71: United States Radiopharmaceuticals Industry Revenue (Million) Forecast, by Application 2019 & 2032
- Table 72: United States Radiopharmaceuticals Industry Volume (K Unit) Forecast, by Application 2019 & 2032
- Table 73: Canada Radiopharmaceuticals Industry Revenue (Million) Forecast, by Application 2019 & 2032
- Table 74: Canada Radiopharmaceuticals Industry Volume (K Unit) Forecast, by Application 2019 & 2032
- Table 75: Mexico Radiopharmaceuticals Industry Revenue (Million) Forecast, by Application 2019 & 2032
- Table 76: Mexico Radiopharmaceuticals Industry Volume (K Unit) Forecast, by Application 2019 & 2032
- Table 77: Global Radiopharmaceuticals Industry Revenue Million Forecast, by Imaging Modality 2019 & 2032
- Table 78: Global Radiopharmaceuticals Industry Volume K Unit Forecast, by Imaging Modality 2019 & 2032
- Table 79: Global Radiopharmaceuticals Industry Revenue Million Forecast, by Application 2019 & 2032
- Table 80: Global Radiopharmaceuticals Industry Volume K Unit Forecast, by Application 2019 & 2032
- Table 81: Global Radiopharmaceuticals Industry Revenue Million Forecast, by Type 2019 & 2032
- Table 82: Global Radiopharmaceuticals Industry Volume K Unit Forecast, by Type 2019 & 2032
- Table 83: Global Radiopharmaceuticals Industry Revenue Million Forecast, by Country 2019 & 2032
- Table 84: Global Radiopharmaceuticals Industry Volume K Unit Forecast, by Country 2019 & 2032
- Table 85: United Kingdom Radiopharmaceuticals Industry Revenue (Million) Forecast, by Application 2019 & 2032
- Table 86: United Kingdom Radiopharmaceuticals Industry Volume (K Unit) Forecast, by Application 2019 & 2032
- Table 87: Germany Radiopharmaceuticals Industry Revenue (Million) Forecast, by Application 2019 & 2032
- Table 88: Germany Radiopharmaceuticals Industry Volume (K Unit) Forecast, by Application 2019 & 2032
- Table 89: France Radiopharmaceuticals Industry Revenue (Million) Forecast, by Application 2019 & 2032
- Table 90: France Radiopharmaceuticals Industry Volume (K Unit) Forecast, by Application 2019 & 2032
- Table 91: Italy Radiopharmaceuticals Industry Revenue (Million) Forecast, by Application 2019 & 2032
- Table 92: Italy Radiopharmaceuticals Industry Volume (K Unit) Forecast, by Application 2019 & 2032
- Table 93: Spain Radiopharmaceuticals Industry Revenue (Million) Forecast, by Application 2019 & 2032
- Table 94: Spain Radiopharmaceuticals Industry Volume (K Unit) Forecast, by Application 2019 & 2032
- Table 95: Rest of Europe Radiopharmaceuticals Industry Revenue (Million) Forecast, by Application 2019 & 2032
- Table 96: Rest of Europe Radiopharmaceuticals Industry Volume (K Unit) Forecast, by Application 2019 & 2032
- Table 97: Global Radiopharmaceuticals Industry Revenue Million Forecast, by Imaging Modality 2019 & 2032
- Table 98: Global Radiopharmaceuticals Industry Volume K Unit Forecast, by Imaging Modality 2019 & 2032
- Table 99: Global Radiopharmaceuticals Industry Revenue Million Forecast, by Application 2019 & 2032
- Table 100: Global Radiopharmaceuticals Industry Volume K Unit Forecast, by Application 2019 & 2032
- Table 101: Global Radiopharmaceuticals Industry Revenue Million Forecast, by Type 2019 & 2032
- Table 102: Global Radiopharmaceuticals Industry Volume K Unit Forecast, by Type 2019 & 2032
- Table 103: Global Radiopharmaceuticals Industry Revenue Million Forecast, by Country 2019 & 2032
- Table 104: Global Radiopharmaceuticals Industry Volume K Unit Forecast, by Country 2019 & 2032
- Table 105: China Radiopharmaceuticals Industry Revenue (Million) Forecast, by Application 2019 & 2032
- Table 106: China Radiopharmaceuticals Industry Volume (K Unit) Forecast, by Application 2019 & 2032
- Table 107: Japan Radiopharmaceuticals Industry Revenue (Million) Forecast, by Application 2019 & 2032
- Table 108: Japan Radiopharmaceuticals Industry Volume (K Unit) Forecast, by Application 2019 & 2032
- Table 109: India Radiopharmaceuticals Industry Revenue (Million) Forecast, by Application 2019 & 2032
- Table 110: India Radiopharmaceuticals Industry Volume (K Unit) Forecast, by Application 2019 & 2032
- Table 111: Australia Radiopharmaceuticals Industry Revenue (Million) Forecast, by Application 2019 & 2032
- Table 112: Australia Radiopharmaceuticals Industry Volume (K Unit) Forecast, by Application 2019 & 2032
- Table 113: South Korea Radiopharmaceuticals Industry Revenue (Million) Forecast, by Application 2019 & 2032
- Table 114: South Korea Radiopharmaceuticals Industry Volume (K Unit) Forecast, by Application 2019 & 2032
- Table 115: Rest of Asia Pacific Radiopharmaceuticals Industry Revenue (Million) Forecast, by Application 2019 & 2032
- Table 116: Rest of Asia Pacific Radiopharmaceuticals Industry Volume (K Unit) Forecast, by Application 2019 & 2032
- Table 117: Global Radiopharmaceuticals Industry Revenue Million Forecast, by Imaging Modality 2019 & 2032
- Table 118: Global Radiopharmaceuticals Industry Volume K Unit Forecast, by Imaging Modality 2019 & 2032
- Table 119: Global Radiopharmaceuticals Industry Revenue Million Forecast, by Application 2019 & 2032
- Table 120: Global Radiopharmaceuticals Industry Volume K Unit Forecast, by Application 2019 & 2032
- Table 121: Global Radiopharmaceuticals Industry Revenue Million Forecast, by Type 2019 & 2032
- Table 122: Global Radiopharmaceuticals Industry Volume K Unit Forecast, by Type 2019 & 2032
- Table 123: Global Radiopharmaceuticals Industry Revenue Million Forecast, by Country 2019 & 2032
- Table 124: Global Radiopharmaceuticals Industry Volume K Unit Forecast, by Country 2019 & 2032
- Table 125: GCC Radiopharmaceuticals Industry Revenue (Million) Forecast, by Application 2019 & 2032
- Table 126: GCC Radiopharmaceuticals Industry Volume (K Unit) Forecast, by Application 2019 & 2032
- Table 127: South Africa Radiopharmaceuticals Industry Revenue (Million) Forecast, by Application 2019 & 2032
- Table 128: South Africa Radiopharmaceuticals Industry Volume (K Unit) Forecast, by Application 2019 & 2032
- Table 129: Rest of Middle East and Africa Radiopharmaceuticals Industry Revenue (Million) Forecast, by Application 2019 & 2032
- Table 130: Rest of Middle East and Africa Radiopharmaceuticals Industry Volume (K Unit) Forecast, by Application 2019 & 2032
- Table 131: Global Radiopharmaceuticals Industry Revenue Million Forecast, by Imaging Modality 2019 & 2032
- Table 132: Global Radiopharmaceuticals Industry Volume K Unit Forecast, by Imaging Modality 2019 & 2032
- Table 133: Global Radiopharmaceuticals Industry Revenue Million Forecast, by Application 2019 & 2032
- Table 134: Global Radiopharmaceuticals Industry Volume K Unit Forecast, by Application 2019 & 2032
- Table 135: Global Radiopharmaceuticals Industry Revenue Million Forecast, by Type 2019 & 2032
- Table 136: Global Radiopharmaceuticals Industry Volume K Unit Forecast, by Type 2019 & 2032
- Table 137: Global Radiopharmaceuticals Industry Revenue Million Forecast, by Country 2019 & 2032
- Table 138: Global Radiopharmaceuticals Industry Volume K Unit Forecast, by Country 2019 & 2032
- Table 139: Brazil Radiopharmaceuticals Industry Revenue (Million) Forecast, by Application 2019 & 2032
- Table 140: Brazil Radiopharmaceuticals Industry Volume (K Unit) Forecast, by Application 2019 & 2032
- Table 141: Argentina Radiopharmaceuticals Industry Revenue (Million) Forecast, by Application 2019 & 2032
- Table 142: Argentina Radiopharmaceuticals Industry Volume (K Unit) Forecast, by Application 2019 & 2032
- Table 143: Rest of South America Radiopharmaceuticals Industry Revenue (Million) Forecast, by Application 2019 & 2032
- Table 144: Rest of South America Radiopharmaceuticals Industry Volume (K Unit) Forecast, by Application 2019 & 2032
Frequently Asked Questions
1. What is the projected Compound Annual Growth Rate (CAGR) of the Radiopharmaceuticals Industry?
The projected CAGR is approximately 6.81%.
2. Which companies are prominent players in the Radiopharmaceuticals Industry?
Key companies in the market include Spago Nanomedical AB, Guerbet Group, Lantheus Holdings Inc, Trivitron Healthcare, Bayer AG, Siemens Healthineers, Otsuka Pharmaceuticals Co Ltd, Nano Therapeutics Pvt Ltd, GE Company (GE Healthcare), Bracco Imaging SpA, Triad Isotopes, Cardinal Health Inc, NTP Radioisotopes SOC Ltd, Koninklijke Philips NV, Curium Pharma.
3. What are the main segments of the Radiopharmaceuticals Industry?
The market segments include Imaging Modality , Application , Type.
4. Can you provide details about the market size?
The market size is estimated to be USD 9.36 Million as of 2022.
5. What are some drivers contributing to market growth?
Technology Advancements in Medical Imaging; Increasing Demand for Image-guided Procedures and Diagnostics; High Prevalence of Cancers and Cardiac Diseases.
6. What are the notable trends driving market growth?
The Cardiology Sub-segment Captured the Largest Market Share. and It is Expected to Retain its Dominance Over the Forecast Period.
7. Are there any restraints impacting market growth?
High Costs of the Techniques; Limited Health Insurance Coverage; Short Half-life of Radiopharmaceuticals.
8. Can you provide examples of recent developments in the market?
N/A
9. What pricing options are available for accessing the report?
Pricing options include single-user, multi-user, and enterprise licenses priced at USD 4750, USD 5250, and USD 8750 respectively.
10. Is the market size provided in terms of value or volume?
The market size is provided in terms of value, measured in Million and volume, measured in K Unit.
11. Are there any specific market keywords associated with the report?
Yes, the market keyword associated with the report is "Radiopharmaceuticals Industry," which aids in identifying and referencing the specific market segment covered.
12. How do I determine which pricing option suits my needs best?
The pricing options vary based on user requirements and access needs. Individual users may opt for single-user licenses, while businesses requiring broader access may choose multi-user or enterprise licenses for cost-effective access to the report.
13. Are there any additional resources or data provided in the Radiopharmaceuticals Industry report?
While the report offers comprehensive insights, it's advisable to review the specific contents or supplementary materials provided to ascertain if additional resources or data are available.
14. How can I stay updated on further developments or reports in the Radiopharmaceuticals Industry?
To stay informed about further developments, trends, and reports in the Radiopharmaceuticals Industry, consider subscribing to industry newsletters, following relevant companies and organizations, or regularly checking reputable industry news sources and publications.
Methodology
Step 1 - Identification of Relevant Samples Size from Population Database


Step 2 - Approaches for Defining Global Market Size (Value, Volume* & Price*)

Note*: In applicable scenarios
Step 3 - Data Sources
Primary Research
- Web Analytics
- Survey Reports
- Research Institute
- Latest Research Reports
- Opinion Leaders
Secondary Research
- Annual Reports
- White Paper
- Latest Press Release
- Industry Association
- Paid Database
- Investor Presentations

Step 4 - Data Triangulation
Involves using different sources of information in order to increase the validity of a study
These sources are likely to be stakeholders in a program - participants, other researchers, program staff, other community members, and so on.
Then we put all data in single framework & apply various statistical tools to find out the dynamic on the market.
During the analysis stage, feedback from the stakeholder groups would be compared to determine areas of agreement as well as areas of divergence


