
Key Insights
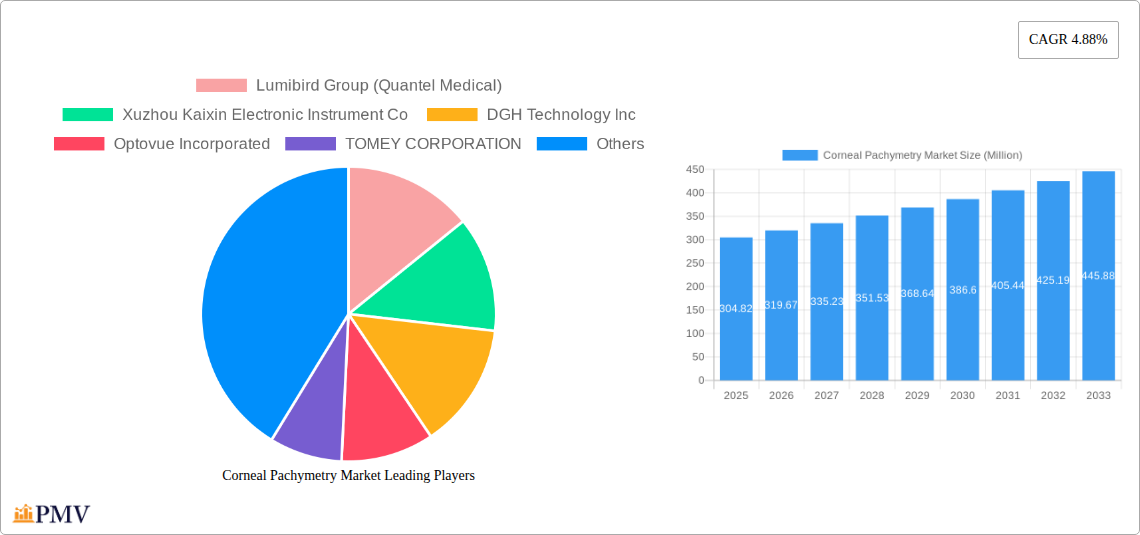
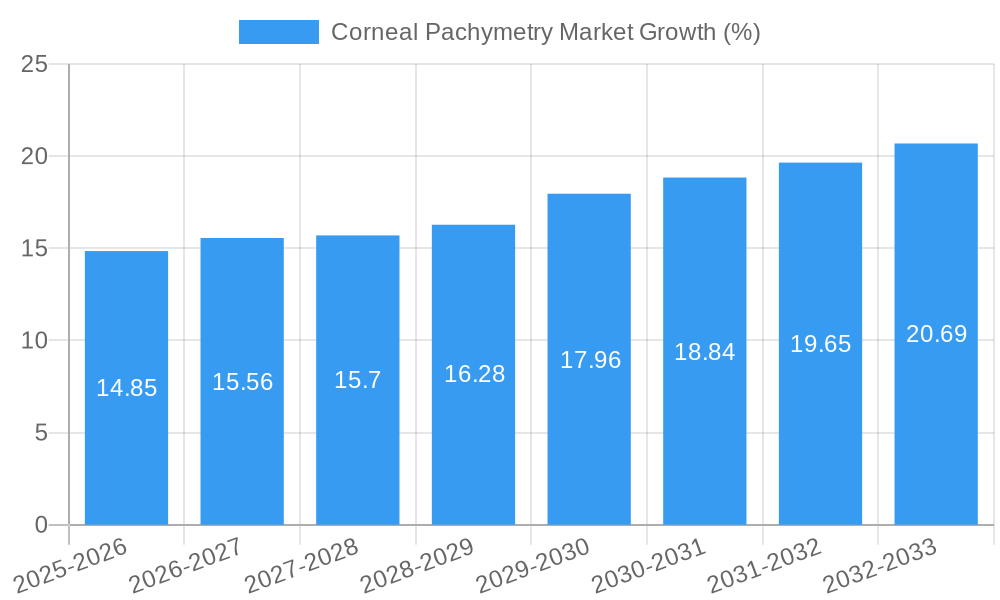
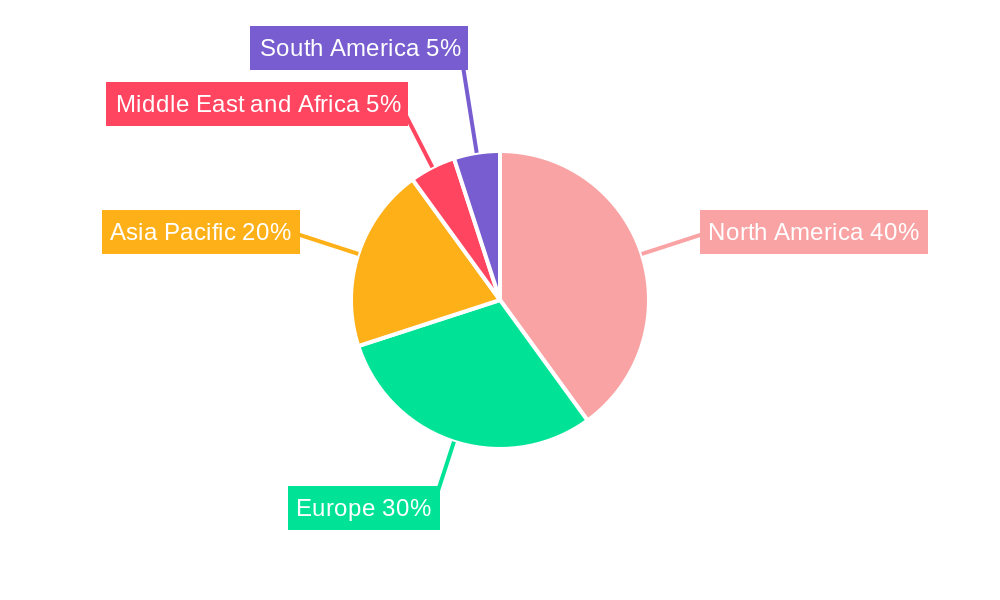
The global corneal pachymetry market, valued at $304.82 million in 2025, is projected to experience robust growth, driven by increasing prevalence of refractive errors and glaucoma, advancements in surgical techniques requiring precise corneal thickness measurements, and the rising adoption of advanced imaging technologies. The market's Compound Annual Growth Rate (CAGR) of 4.88% from 2019 to 2024 suggests a continued upward trajectory through 2033. The significant market segments are driven by the increasing demand for precise and non-invasive corneal thickness measurement techniques. Ultrasonic and optical methods dominate the market, with optical methods expected to show faster growth due to their higher accuracy and improved image quality. Refractive surgery remains a key application segment, fueled by the rising demand for LASIK and other vision correction procedures. However, glaucoma diagnostics, owing to its growing prevalence and the vital role corneal thickness plays in disease management, is expected to be a significant growth driver in the coming years. The North American market, including the United States, Canada, and Mexico, currently holds a substantial share, attributable to advanced healthcare infrastructure and high adoption rates of advanced technologies. However, the Asia-Pacific region, especially China and India, is poised for significant growth due to increasing awareness, rising disposable incomes, and expanding healthcare infrastructure. Competitive landscape is characterized by a mix of established players and emerging companies, leading to continuous innovation and improved product offerings.
The market's growth is, however, tempered by factors such as the high cost of advanced pachymetry devices, which can limit accessibility in developing regions. Furthermore, the need for skilled professionals to operate and interpret the results might pose a challenge for market penetration in regions with limited ophthalmological expertise. Nonetheless, ongoing technological advancements, focusing on improving device portability, ease of use, and image analysis capabilities, are expected to mitigate some of these restraints. The development of integrated systems that combine pachymetry with other diagnostic tools also holds potential for significant market expansion. Future market growth will hinge on overcoming these challenges through strategic partnerships, technological advancements, and increased investment in ophthalmic healthcare infrastructure across various regions.
Corneal Pachymetry Market: A Comprehensive Report (2019-2033)
This detailed report provides a comprehensive analysis of the global Corneal Pachymetry Market, offering invaluable insights for stakeholders across the ophthalmic industry. Covering the period from 2019 to 2033, with 2025 as the base year, this study meticulously examines market dynamics, competitive landscapes, and future growth prospects. The report segments the market by type (Ultrasonic Method, Optical Method) and application (Refractive Surgery, Glaucoma Diagnostics), offering granular analysis of each segment's performance and potential.
Corneal Pachymetry Market Structure & Competitive Dynamics
The Corneal Pachymetry market exhibits a moderately consolidated structure, with several key players vying for market share. Market concentration is moderate, with the top 5 companies holding an estimated xx% of the global market share in 2025. Innovation within the ecosystem is driven by advancements in optical and ultrasonic technologies, aiming for improved accuracy, portability, and integration with other ophthalmic diagnostic tools. Regulatory frameworks vary across geographies, impacting market access and product approvals. The market witnesses a moderate level of M&A activity, with deal values fluctuating based on target company size and technology offerings. Substitutes for corneal pachymetry are limited, primarily relying on alternative diagnostic methods which are often less precise. End-user trends indicate a growing preference for non-invasive, rapid diagnostic tools that integrate seamlessly into existing clinical workflows.
- Market Concentration: Moderately Consolidated (Top 5 players hold xx% market share in 2025).
- M&A Activity: Moderate, with deal values ranging from xx Million to xx Million in recent years.
- Innovation: Focused on improving accuracy, portability, and integration with other diagnostic devices.
- Regulatory Landscape: Varies across regions, impacting market entry and product approvals.
Corneal Pachymetry Market Industry Trends & Insights
The global Corneal Pachymetry market is experiencing robust growth, driven by several key factors. The increasing prevalence of refractive errors and glaucoma is a primary driver, fueling demand for accurate and efficient diagnostic tools. Technological advancements, particularly in optical coherence tomography (OCT) and automated systems, are enhancing the accuracy and speed of corneal thickness measurements. Consumer preferences are shifting towards non-invasive and faster diagnostic methods. The market also exhibits substantial competitive pressure, with manufacturers continually striving to improve product features and reduce costs. The market is projected to exhibit a CAGR of xx% during the forecast period (2025-2033), with market penetration rates expected to increase from xx% in 2025 to xx% by 2033.
Dominant Markets & Segments in Corneal Pachymetry Market
The North American region currently holds the largest market share in the Corneal Pachymetry market, driven by factors such as high healthcare expenditure, advanced healthcare infrastructure, and a high prevalence of eye diseases. Within the segments, the Ultrasonic Method currently holds a larger market share compared to the Optical Method, although the Optical Method is experiencing faster growth due to its superior precision and image quality. In terms of application, the Refractive Surgery segment accounts for a significant portion of the market, followed by the Glaucoma Diagnostics segment.
- North America Dominance: Driven by high healthcare expenditure, advanced infrastructure, and prevalence of eye diseases.
- Ultrasonic Method: Holds a larger market share but faces competition from the rapidly growing Optical Method segment.
- Refractive Surgery Application: Largest application segment due to the high volume of refractive procedures.
Key Drivers for Dominant Regions/Segments:
- North America: High healthcare spending, robust healthcare infrastructure, technological advancements.
- Ultrasonic Method: Cost-effectiveness, established technology, wide availability.
- Refractive Surgery: Increasing prevalence of refractive errors, advancements in surgical techniques.
Corneal Pachymetry Market Product Innovations
Recent product developments focus on improving the accuracy, speed, and ease of use of corneal pachymetry devices. Manufacturers are integrating advanced imaging technologies, such as OCT and Scheimpflug imaging, to enhance diagnostic capabilities. Miniaturization and portability are also key trends, enabling point-of-care testing and improved access in underserved areas. These innovations are enhancing market fit by providing clinicians with more efficient and precise tools for diagnosis and treatment planning.
Report Segmentation & Scope
The report segments the Corneal Pachymetry market by Type:
- Ultrasonic Method: This segment is characterized by established technology and cost-effectiveness. It is projected to witness steady growth during the forecast period, with a market size of xx Million in 2033. Competitive dynamics are moderate.
- Optical Method: This segment demonstrates faster growth due to its superior precision and image quality. Its market size is expected to reach xx Million by 2033. The competitive landscape is dynamic with technological advancements.
By Application:
- Refractive Surgery: This segment constitutes a major portion of the market due to the high volume of refractive surgeries. It's expected to grow at xx% CAGR to reach xx Million by 2033. The segment is highly competitive.
- Glaucoma Diagnostics: This segment is also experiencing growth due to the increasing prevalence of glaucoma. It's projected to reach a market size of xx Million by 2033. Competitive dynamics are moderate.
Key Drivers of Corneal Pachymetry Market Growth
The market's growth is propelled by several factors: the rising prevalence of refractive errors and glaucoma, technological advancements leading to improved accuracy and speed of corneal thickness measurement, the increasing demand for non-invasive diagnostic techniques, and government initiatives promoting eye health and vision care. Furthermore, the integration of corneal pachymetry with other ophthalmic diagnostic tools creates synergistic opportunities for growth.
Challenges in the Corneal Pachymetry Market Sector
The market faces challenges, including the high cost of advanced devices, the need for skilled personnel to operate them, and potential reimbursement issues in certain healthcare systems. The competitive landscape also presents challenges, requiring continuous innovation and cost optimization to maintain market share. Strict regulatory approvals in some regions can also impede market penetration. These factors collectively influence market growth, although the overall outlook remains positive.
Leading Players in the Corneal Pachymetry Market Market
- Lumibird Group (Quantel Medical)
- Xuzhou Kaixin Electronic Instrument Co
- DGH Technology Inc
- Optovue Incorporated
- TOMEY CORPORATION
- Reichert Inc
- Carl Zeiss AG
- Sonomed Escalon
- Topcon Corporation
- NIDEK CO LTD
Key Developments in Corneal Pachymetry Market Sector
- December 2022: Entod Pharmaceuticals launched its GLO division for Glaucoma treatment, expanding its ophthalmic subspecialty division. This development is expected to stimulate demand for corneal pachymetry devices in glaucoma diagnostics.
- January 2023: Bausch + Lomb Corp. and the Glaucoma Research Foundation (GRF) launched the "Screen, Protect, Cure" campaign to raise glaucoma awareness. This initiative is likely to increase the screening rate and subsequently increase the demand for corneal pachymetry devices.
Strategic Corneal Pachymetry Market Outlook
The future of the Corneal Pachymetry market appears promising, with continued growth driven by technological advancements, increasing prevalence of eye diseases, and expansion into emerging markets. Strategic opportunities lie in developing cost-effective and portable devices, integrating AI for automated analysis, and fostering collaborations to expand market access. Focus on improving user-friendliness and integration with electronic health records (EHR) systems will also be crucial for future success.
Corneal Pachymetry Market Segmentation
-
1. Type
- 1.1. Ultrasonic Method
- 1.2. Optical Method
-
2. Application
- 2.1. Refractive Surgery
- 2.2. Glaucoma Diagnostics
Corneal Pachymetry Market Segmentation By Geography
-
1. North America
- 1.1. United States
- 1.2. Canada
- 1.3. Mexico
-
2. Europe
- 2.1. Germany
- 2.2. United Kingdom
- 2.3. France
- 2.4. Italy
- 2.5. Spain
- 2.6. Rest of Europe
-
3. Asia Pacific
- 3.1. China
- 3.2. Japan
- 3.3. India
- 3.4. Australia
- 3.5. South Korea
- 3.6. Rest of Asia Pacific
-
4. Middle East and Africa
- 4.1. GCC
- 4.2. South Africa
- 4.3. Rest of Middle East and Africa
-
5. South America
- 5.1. Brazil
- 5.2. Argentina
- 5.3. Rest of South America
Corneal Pachymetry Market REPORT HIGHLIGHTS
| Aspects | Details |
|---|---|
| Study Period | 2019-2033 |
| Base Year | 2024 |
| Estimated Year | 2025 |
| Forecast Period | 2025-2033 |
| Historical Period | 2019-2024 |
| Growth Rate | CAGR of 4.88% from 2019-2033 |
| Segmentation |
|
Table of Contents
- 1. Introduction
- 1.1. Research Scope
- 1.2. Market Segmentation
- 1.3. Research Methodology
- 1.4. Definitions and Assumptions
- 2. Executive Summary
- 2.1. Introduction
- 3. Market Dynamics
- 3.1. Introduction
- 3.2. Market Drivers
- 3.2.1. Rise in Prevalence of Glaucoma and Eye-related Disorders; Rise in Prevalence of Diabetic Retinopathy
- 3.3. Market Restrains
- 3.3.1. Inadequate Reimbursement Coverage for Pachymetry; Stringent Government Regulations
- 3.4. Market Trends
- 3.4.1. Glaucoma Diagnostics Segment Expects to Register a Significant CAGR Over the Forecast Period
- 4. Market Factor Analysis
- 4.1. Porters Five Forces
- 4.2. Supply/Value Chain
- 4.3. PESTEL analysis
- 4.4. Market Entropy
- 4.5. Patent/Trademark Analysis
- 5. Global Corneal Pachymetry Market Analysis, Insights and Forecast, 2019-2031
- 5.1. Market Analysis, Insights and Forecast - by Type
- 5.1.1. Ultrasonic Method
- 5.1.2. Optical Method
- 5.2. Market Analysis, Insights and Forecast - by Application
- 5.2.1. Refractive Surgery
- 5.2.2. Glaucoma Diagnostics
- 5.3. Market Analysis, Insights and Forecast - by Region
- 5.3.1. North America
- 5.3.2. Europe
- 5.3.3. Asia Pacific
- 5.3.4. Middle East and Africa
- 5.3.5. South America
- 5.1. Market Analysis, Insights and Forecast - by Type
- 6. North America Corneal Pachymetry Market Analysis, Insights and Forecast, 2019-2031
- 6.1. Market Analysis, Insights and Forecast - by Type
- 6.1.1. Ultrasonic Method
- 6.1.2. Optical Method
- 6.2. Market Analysis, Insights and Forecast - by Application
- 6.2.1. Refractive Surgery
- 6.2.2. Glaucoma Diagnostics
- 6.1. Market Analysis, Insights and Forecast - by Type
- 7. Europe Corneal Pachymetry Market Analysis, Insights and Forecast, 2019-2031
- 7.1. Market Analysis, Insights and Forecast - by Type
- 7.1.1. Ultrasonic Method
- 7.1.2. Optical Method
- 7.2. Market Analysis, Insights and Forecast - by Application
- 7.2.1. Refractive Surgery
- 7.2.2. Glaucoma Diagnostics
- 7.1. Market Analysis, Insights and Forecast - by Type
- 8. Asia Pacific Corneal Pachymetry Market Analysis, Insights and Forecast, 2019-2031
- 8.1. Market Analysis, Insights and Forecast - by Type
- 8.1.1. Ultrasonic Method
- 8.1.2. Optical Method
- 8.2. Market Analysis, Insights and Forecast - by Application
- 8.2.1. Refractive Surgery
- 8.2.2. Glaucoma Diagnostics
- 8.1. Market Analysis, Insights and Forecast - by Type
- 9. Middle East and Africa Corneal Pachymetry Market Analysis, Insights and Forecast, 2019-2031
- 9.1. Market Analysis, Insights and Forecast - by Type
- 9.1.1. Ultrasonic Method
- 9.1.2. Optical Method
- 9.2. Market Analysis, Insights and Forecast - by Application
- 9.2.1. Refractive Surgery
- 9.2.2. Glaucoma Diagnostics
- 9.1. Market Analysis, Insights and Forecast - by Type
- 10. South America Corneal Pachymetry Market Analysis, Insights and Forecast, 2019-2031
- 10.1. Market Analysis, Insights and Forecast - by Type
- 10.1.1. Ultrasonic Method
- 10.1.2. Optical Method
- 10.2. Market Analysis, Insights and Forecast - by Application
- 10.2.1. Refractive Surgery
- 10.2.2. Glaucoma Diagnostics
- 10.1. Market Analysis, Insights and Forecast - by Type
- 11. North America Corneal Pachymetry Market Analysis, Insights and Forecast, 2019-2031
- 11.1. Market Analysis, Insights and Forecast - By Country/Sub-region
- 11.1.1 United States
- 11.1.2 Canada
- 11.1.3 Mexico
- 12. Europe Corneal Pachymetry Market Analysis, Insights and Forecast, 2019-2031
- 12.1. Market Analysis, Insights and Forecast - By Country/Sub-region
- 12.1.1 Germany
- 12.1.2 United Kingdom
- 12.1.3 France
- 12.1.4 Italy
- 12.1.5 Spain
- 12.1.6 Rest of Europe
- 13. Asia Pacific Corneal Pachymetry Market Analysis, Insights and Forecast, 2019-2031
- 13.1. Market Analysis, Insights and Forecast - By Country/Sub-region
- 13.1.1 China
- 13.1.2 Japan
- 13.1.3 India
- 13.1.4 Australia
- 13.1.5 South Korea
- 13.1.6 Rest of Asia Pacific
- 14. Middle East and Africa Corneal Pachymetry Market Analysis, Insights and Forecast, 2019-2031
- 14.1. Market Analysis, Insights and Forecast - By Country/Sub-region
- 14.1.1 GCC
- 14.1.2 South Africa
- 14.1.3 Rest of Middle East and Africa
- 15. South America Corneal Pachymetry Market Analysis, Insights and Forecast, 2019-2031
- 15.1. Market Analysis, Insights and Forecast - By Country/Sub-region
- 15.1.1 Brazil
- 15.1.2 Argentina
- 15.1.3 Rest of South America
- 16. Competitive Analysis
- 16.1. Global Market Share Analysis 2024
- 16.2. Company Profiles
- 16.2.1 Lumibird Group (Quantel Medical)
- 16.2.1.1. Overview
- 16.2.1.2. Products
- 16.2.1.3. SWOT Analysis
- 16.2.1.4. Recent Developments
- 16.2.1.5. Financials (Based on Availability)
- 16.2.2 Xuzhou Kaixin Electronic Instrument Co
- 16.2.2.1. Overview
- 16.2.2.2. Products
- 16.2.2.3. SWOT Analysis
- 16.2.2.4. Recent Developments
- 16.2.2.5. Financials (Based on Availability)
- 16.2.3 DGH Technology Inc
- 16.2.3.1. Overview
- 16.2.3.2. Products
- 16.2.3.3. SWOT Analysis
- 16.2.3.4. Recent Developments
- 16.2.3.5. Financials (Based on Availability)
- 16.2.4 Optovue Incorporated
- 16.2.4.1. Overview
- 16.2.4.2. Products
- 16.2.4.3. SWOT Analysis
- 16.2.4.4. Recent Developments
- 16.2.4.5. Financials (Based on Availability)
- 16.2.5 TOMEY CORPORATION
- 16.2.5.1. Overview
- 16.2.5.2. Products
- 16.2.5.3. SWOT Analysis
- 16.2.5.4. Recent Developments
- 16.2.5.5. Financials (Based on Availability)
- 16.2.6 Reichert Inc
- 16.2.6.1. Overview
- 16.2.6.2. Products
- 16.2.6.3. SWOT Analysis
- 16.2.6.4. Recent Developments
- 16.2.6.5. Financials (Based on Availability)
- 16.2.7 Carl Zeiss AG
- 16.2.7.1. Overview
- 16.2.7.2. Products
- 16.2.7.3. SWOT Analysis
- 16.2.7.4. Recent Developments
- 16.2.7.5. Financials (Based on Availability)
- 16.2.8 Sonomed Escalon
- 16.2.8.1. Overview
- 16.2.8.2. Products
- 16.2.8.3. SWOT Analysis
- 16.2.8.4. Recent Developments
- 16.2.8.5. Financials (Based on Availability)
- 16.2.9 Topcon Corporation
- 16.2.9.1. Overview
- 16.2.9.2. Products
- 16.2.9.3. SWOT Analysis
- 16.2.9.4. Recent Developments
- 16.2.9.5. Financials (Based on Availability)
- 16.2.10 NIDEK CO LTD
- 16.2.10.1. Overview
- 16.2.10.2. Products
- 16.2.10.3. SWOT Analysis
- 16.2.10.4. Recent Developments
- 16.2.10.5. Financials (Based on Availability)
- 16.2.1 Lumibird Group (Quantel Medical)
List of Figures
- Figure 1: Global Corneal Pachymetry Market Revenue Breakdown (Million, %) by Region 2024 & 2032
- Figure 2: Global Corneal Pachymetry Market Volume Breakdown (K Unit, %) by Region 2024 & 2032
- Figure 3: North America Corneal Pachymetry Market Revenue (Million), by Country 2024 & 2032
- Figure 4: North America Corneal Pachymetry Market Volume (K Unit), by Country 2024 & 2032
- Figure 5: North America Corneal Pachymetry Market Revenue Share (%), by Country 2024 & 2032
- Figure 6: North America Corneal Pachymetry Market Volume Share (%), by Country 2024 & 2032
- Figure 7: Europe Corneal Pachymetry Market Revenue (Million), by Country 2024 & 2032
- Figure 8: Europe Corneal Pachymetry Market Volume (K Unit), by Country 2024 & 2032
- Figure 9: Europe Corneal Pachymetry Market Revenue Share (%), by Country 2024 & 2032
- Figure 10: Europe Corneal Pachymetry Market Volume Share (%), by Country 2024 & 2032
- Figure 11: Asia Pacific Corneal Pachymetry Market Revenue (Million), by Country 2024 & 2032
- Figure 12: Asia Pacific Corneal Pachymetry Market Volume (K Unit), by Country 2024 & 2032
- Figure 13: Asia Pacific Corneal Pachymetry Market Revenue Share (%), by Country 2024 & 2032
- Figure 14: Asia Pacific Corneal Pachymetry Market Volume Share (%), by Country 2024 & 2032
- Figure 15: Middle East and Africa Corneal Pachymetry Market Revenue (Million), by Country 2024 & 2032
- Figure 16: Middle East and Africa Corneal Pachymetry Market Volume (K Unit), by Country 2024 & 2032
- Figure 17: Middle East and Africa Corneal Pachymetry Market Revenue Share (%), by Country 2024 & 2032
- Figure 18: Middle East and Africa Corneal Pachymetry Market Volume Share (%), by Country 2024 & 2032
- Figure 19: South America Corneal Pachymetry Market Revenue (Million), by Country 2024 & 2032
- Figure 20: South America Corneal Pachymetry Market Volume (K Unit), by Country 2024 & 2032
- Figure 21: South America Corneal Pachymetry Market Revenue Share (%), by Country 2024 & 2032
- Figure 22: South America Corneal Pachymetry Market Volume Share (%), by Country 2024 & 2032
- Figure 23: North America Corneal Pachymetry Market Revenue (Million), by Type 2024 & 2032
- Figure 24: North America Corneal Pachymetry Market Volume (K Unit), by Type 2024 & 2032
- Figure 25: North America Corneal Pachymetry Market Revenue Share (%), by Type 2024 & 2032
- Figure 26: North America Corneal Pachymetry Market Volume Share (%), by Type 2024 & 2032
- Figure 27: North America Corneal Pachymetry Market Revenue (Million), by Application 2024 & 2032
- Figure 28: North America Corneal Pachymetry Market Volume (K Unit), by Application 2024 & 2032
- Figure 29: North America Corneal Pachymetry Market Revenue Share (%), by Application 2024 & 2032
- Figure 30: North America Corneal Pachymetry Market Volume Share (%), by Application 2024 & 2032
- Figure 31: North America Corneal Pachymetry Market Revenue (Million), by Country 2024 & 2032
- Figure 32: North America Corneal Pachymetry Market Volume (K Unit), by Country 2024 & 2032
- Figure 33: North America Corneal Pachymetry Market Revenue Share (%), by Country 2024 & 2032
- Figure 34: North America Corneal Pachymetry Market Volume Share (%), by Country 2024 & 2032
- Figure 35: Europe Corneal Pachymetry Market Revenue (Million), by Type 2024 & 2032
- Figure 36: Europe Corneal Pachymetry Market Volume (K Unit), by Type 2024 & 2032
- Figure 37: Europe Corneal Pachymetry Market Revenue Share (%), by Type 2024 & 2032
- Figure 38: Europe Corneal Pachymetry Market Volume Share (%), by Type 2024 & 2032
- Figure 39: Europe Corneal Pachymetry Market Revenue (Million), by Application 2024 & 2032
- Figure 40: Europe Corneal Pachymetry Market Volume (K Unit), by Application 2024 & 2032
- Figure 41: Europe Corneal Pachymetry Market Revenue Share (%), by Application 2024 & 2032
- Figure 42: Europe Corneal Pachymetry Market Volume Share (%), by Application 2024 & 2032
- Figure 43: Europe Corneal Pachymetry Market Revenue (Million), by Country 2024 & 2032
- Figure 44: Europe Corneal Pachymetry Market Volume (K Unit), by Country 2024 & 2032
- Figure 45: Europe Corneal Pachymetry Market Revenue Share (%), by Country 2024 & 2032
- Figure 46: Europe Corneal Pachymetry Market Volume Share (%), by Country 2024 & 2032
- Figure 47: Asia Pacific Corneal Pachymetry Market Revenue (Million), by Type 2024 & 2032
- Figure 48: Asia Pacific Corneal Pachymetry Market Volume (K Unit), by Type 2024 & 2032
- Figure 49: Asia Pacific Corneal Pachymetry Market Revenue Share (%), by Type 2024 & 2032
- Figure 50: Asia Pacific Corneal Pachymetry Market Volume Share (%), by Type 2024 & 2032
- Figure 51: Asia Pacific Corneal Pachymetry Market Revenue (Million), by Application 2024 & 2032
- Figure 52: Asia Pacific Corneal Pachymetry Market Volume (K Unit), by Application 2024 & 2032
- Figure 53: Asia Pacific Corneal Pachymetry Market Revenue Share (%), by Application 2024 & 2032
- Figure 54: Asia Pacific Corneal Pachymetry Market Volume Share (%), by Application 2024 & 2032
- Figure 55: Asia Pacific Corneal Pachymetry Market Revenue (Million), by Country 2024 & 2032
- Figure 56: Asia Pacific Corneal Pachymetry Market Volume (K Unit), by Country 2024 & 2032
- Figure 57: Asia Pacific Corneal Pachymetry Market Revenue Share (%), by Country 2024 & 2032
- Figure 58: Asia Pacific Corneal Pachymetry Market Volume Share (%), by Country 2024 & 2032
- Figure 59: Middle East and Africa Corneal Pachymetry Market Revenue (Million), by Type 2024 & 2032
- Figure 60: Middle East and Africa Corneal Pachymetry Market Volume (K Unit), by Type 2024 & 2032
- Figure 61: Middle East and Africa Corneal Pachymetry Market Revenue Share (%), by Type 2024 & 2032
- Figure 62: Middle East and Africa Corneal Pachymetry Market Volume Share (%), by Type 2024 & 2032
- Figure 63: Middle East and Africa Corneal Pachymetry Market Revenue (Million), by Application 2024 & 2032
- Figure 64: Middle East and Africa Corneal Pachymetry Market Volume (K Unit), by Application 2024 & 2032
- Figure 65: Middle East and Africa Corneal Pachymetry Market Revenue Share (%), by Application 2024 & 2032
- Figure 66: Middle East and Africa Corneal Pachymetry Market Volume Share (%), by Application 2024 & 2032
- Figure 67: Middle East and Africa Corneal Pachymetry Market Revenue (Million), by Country 2024 & 2032
- Figure 68: Middle East and Africa Corneal Pachymetry Market Volume (K Unit), by Country 2024 & 2032
- Figure 69: Middle East and Africa Corneal Pachymetry Market Revenue Share (%), by Country 2024 & 2032
- Figure 70: Middle East and Africa Corneal Pachymetry Market Volume Share (%), by Country 2024 & 2032
- Figure 71: South America Corneal Pachymetry Market Revenue (Million), by Type 2024 & 2032
- Figure 72: South America Corneal Pachymetry Market Volume (K Unit), by Type 2024 & 2032
- Figure 73: South America Corneal Pachymetry Market Revenue Share (%), by Type 2024 & 2032
- Figure 74: South America Corneal Pachymetry Market Volume Share (%), by Type 2024 & 2032
- Figure 75: South America Corneal Pachymetry Market Revenue (Million), by Application 2024 & 2032
- Figure 76: South America Corneal Pachymetry Market Volume (K Unit), by Application 2024 & 2032
- Figure 77: South America Corneal Pachymetry Market Revenue Share (%), by Application 2024 & 2032
- Figure 78: South America Corneal Pachymetry Market Volume Share (%), by Application 2024 & 2032
- Figure 79: South America Corneal Pachymetry Market Revenue (Million), by Country 2024 & 2032
- Figure 80: South America Corneal Pachymetry Market Volume (K Unit), by Country 2024 & 2032
- Figure 81: South America Corneal Pachymetry Market Revenue Share (%), by Country 2024 & 2032
- Figure 82: South America Corneal Pachymetry Market Volume Share (%), by Country 2024 & 2032
List of Tables
- Table 1: Global Corneal Pachymetry Market Revenue Million Forecast, by Region 2019 & 2032
- Table 2: Global Corneal Pachymetry Market Volume K Unit Forecast, by Region 2019 & 2032
- Table 3: Global Corneal Pachymetry Market Revenue Million Forecast, by Type 2019 & 2032
- Table 4: Global Corneal Pachymetry Market Volume K Unit Forecast, by Type 2019 & 2032
- Table 5: Global Corneal Pachymetry Market Revenue Million Forecast, by Application 2019 & 2032
- Table 6: Global Corneal Pachymetry Market Volume K Unit Forecast, by Application 2019 & 2032
- Table 7: Global Corneal Pachymetry Market Revenue Million Forecast, by Region 2019 & 2032
- Table 8: Global Corneal Pachymetry Market Volume K Unit Forecast, by Region 2019 & 2032
- Table 9: Global Corneal Pachymetry Market Revenue Million Forecast, by Country 2019 & 2032
- Table 10: Global Corneal Pachymetry Market Volume K Unit Forecast, by Country 2019 & 2032
- Table 11: United States Corneal Pachymetry Market Revenue (Million) Forecast, by Application 2019 & 2032
- Table 12: United States Corneal Pachymetry Market Volume (K Unit) Forecast, by Application 2019 & 2032
- Table 13: Canada Corneal Pachymetry Market Revenue (Million) Forecast, by Application 2019 & 2032
- Table 14: Canada Corneal Pachymetry Market Volume (K Unit) Forecast, by Application 2019 & 2032
- Table 15: Mexico Corneal Pachymetry Market Revenue (Million) Forecast, by Application 2019 & 2032
- Table 16: Mexico Corneal Pachymetry Market Volume (K Unit) Forecast, by Application 2019 & 2032
- Table 17: Global Corneal Pachymetry Market Revenue Million Forecast, by Country 2019 & 2032
- Table 18: Global Corneal Pachymetry Market Volume K Unit Forecast, by Country 2019 & 2032
- Table 19: Germany Corneal Pachymetry Market Revenue (Million) Forecast, by Application 2019 & 2032
- Table 20: Germany Corneal Pachymetry Market Volume (K Unit) Forecast, by Application 2019 & 2032
- Table 21: United Kingdom Corneal Pachymetry Market Revenue (Million) Forecast, by Application 2019 & 2032
- Table 22: United Kingdom Corneal Pachymetry Market Volume (K Unit) Forecast, by Application 2019 & 2032
- Table 23: France Corneal Pachymetry Market Revenue (Million) Forecast, by Application 2019 & 2032
- Table 24: France Corneal Pachymetry Market Volume (K Unit) Forecast, by Application 2019 & 2032
- Table 25: Italy Corneal Pachymetry Market Revenue (Million) Forecast, by Application 2019 & 2032
- Table 26: Italy Corneal Pachymetry Market Volume (K Unit) Forecast, by Application 2019 & 2032
- Table 27: Spain Corneal Pachymetry Market Revenue (Million) Forecast, by Application 2019 & 2032
- Table 28: Spain Corneal Pachymetry Market Volume (K Unit) Forecast, by Application 2019 & 2032
- Table 29: Rest of Europe Corneal Pachymetry Market Revenue (Million) Forecast, by Application 2019 & 2032
- Table 30: Rest of Europe Corneal Pachymetry Market Volume (K Unit) Forecast, by Application 2019 & 2032
- Table 31: Global Corneal Pachymetry Market Revenue Million Forecast, by Country 2019 & 2032
- Table 32: Global Corneal Pachymetry Market Volume K Unit Forecast, by Country 2019 & 2032
- Table 33: China Corneal Pachymetry Market Revenue (Million) Forecast, by Application 2019 & 2032
- Table 34: China Corneal Pachymetry Market Volume (K Unit) Forecast, by Application 2019 & 2032
- Table 35: Japan Corneal Pachymetry Market Revenue (Million) Forecast, by Application 2019 & 2032
- Table 36: Japan Corneal Pachymetry Market Volume (K Unit) Forecast, by Application 2019 & 2032
- Table 37: India Corneal Pachymetry Market Revenue (Million) Forecast, by Application 2019 & 2032
- Table 38: India Corneal Pachymetry Market Volume (K Unit) Forecast, by Application 2019 & 2032
- Table 39: Australia Corneal Pachymetry Market Revenue (Million) Forecast, by Application 2019 & 2032
- Table 40: Australia Corneal Pachymetry Market Volume (K Unit) Forecast, by Application 2019 & 2032
- Table 41: South Korea Corneal Pachymetry Market Revenue (Million) Forecast, by Application 2019 & 2032
- Table 42: South Korea Corneal Pachymetry Market Volume (K Unit) Forecast, by Application 2019 & 2032
- Table 43: Rest of Asia Pacific Corneal Pachymetry Market Revenue (Million) Forecast, by Application 2019 & 2032
- Table 44: Rest of Asia Pacific Corneal Pachymetry Market Volume (K Unit) Forecast, by Application 2019 & 2032
- Table 45: Global Corneal Pachymetry Market Revenue Million Forecast, by Country 2019 & 2032
- Table 46: Global Corneal Pachymetry Market Volume K Unit Forecast, by Country 2019 & 2032
- Table 47: GCC Corneal Pachymetry Market Revenue (Million) Forecast, by Application 2019 & 2032
- Table 48: GCC Corneal Pachymetry Market Volume (K Unit) Forecast, by Application 2019 & 2032
- Table 49: South Africa Corneal Pachymetry Market Revenue (Million) Forecast, by Application 2019 & 2032
- Table 50: South Africa Corneal Pachymetry Market Volume (K Unit) Forecast, by Application 2019 & 2032
- Table 51: Rest of Middle East and Africa Corneal Pachymetry Market Revenue (Million) Forecast, by Application 2019 & 2032
- Table 52: Rest of Middle East and Africa Corneal Pachymetry Market Volume (K Unit) Forecast, by Application 2019 & 2032
- Table 53: Global Corneal Pachymetry Market Revenue Million Forecast, by Country 2019 & 2032
- Table 54: Global Corneal Pachymetry Market Volume K Unit Forecast, by Country 2019 & 2032
- Table 55: Brazil Corneal Pachymetry Market Revenue (Million) Forecast, by Application 2019 & 2032
- Table 56: Brazil Corneal Pachymetry Market Volume (K Unit) Forecast, by Application 2019 & 2032
- Table 57: Argentina Corneal Pachymetry Market Revenue (Million) Forecast, by Application 2019 & 2032
- Table 58: Argentina Corneal Pachymetry Market Volume (K Unit) Forecast, by Application 2019 & 2032
- Table 59: Rest of South America Corneal Pachymetry Market Revenue (Million) Forecast, by Application 2019 & 2032
- Table 60: Rest of South America Corneal Pachymetry Market Volume (K Unit) Forecast, by Application 2019 & 2032
- Table 61: Global Corneal Pachymetry Market Revenue Million Forecast, by Type 2019 & 2032
- Table 62: Global Corneal Pachymetry Market Volume K Unit Forecast, by Type 2019 & 2032
- Table 63: Global Corneal Pachymetry Market Revenue Million Forecast, by Application 2019 & 2032
- Table 64: Global Corneal Pachymetry Market Volume K Unit Forecast, by Application 2019 & 2032
- Table 65: Global Corneal Pachymetry Market Revenue Million Forecast, by Country 2019 & 2032
- Table 66: Global Corneal Pachymetry Market Volume K Unit Forecast, by Country 2019 & 2032
- Table 67: United States Corneal Pachymetry Market Revenue (Million) Forecast, by Application 2019 & 2032
- Table 68: United States Corneal Pachymetry Market Volume (K Unit) Forecast, by Application 2019 & 2032
- Table 69: Canada Corneal Pachymetry Market Revenue (Million) Forecast, by Application 2019 & 2032
- Table 70: Canada Corneal Pachymetry Market Volume (K Unit) Forecast, by Application 2019 & 2032
- Table 71: Mexico Corneal Pachymetry Market Revenue (Million) Forecast, by Application 2019 & 2032
- Table 72: Mexico Corneal Pachymetry Market Volume (K Unit) Forecast, by Application 2019 & 2032
- Table 73: Global Corneal Pachymetry Market Revenue Million Forecast, by Type 2019 & 2032
- Table 74: Global Corneal Pachymetry Market Volume K Unit Forecast, by Type 2019 & 2032
- Table 75: Global Corneal Pachymetry Market Revenue Million Forecast, by Application 2019 & 2032
- Table 76: Global Corneal Pachymetry Market Volume K Unit Forecast, by Application 2019 & 2032
- Table 77: Global Corneal Pachymetry Market Revenue Million Forecast, by Country 2019 & 2032
- Table 78: Global Corneal Pachymetry Market Volume K Unit Forecast, by Country 2019 & 2032
- Table 79: Germany Corneal Pachymetry Market Revenue (Million) Forecast, by Application 2019 & 2032
- Table 80: Germany Corneal Pachymetry Market Volume (K Unit) Forecast, by Application 2019 & 2032
- Table 81: United Kingdom Corneal Pachymetry Market Revenue (Million) Forecast, by Application 2019 & 2032
- Table 82: United Kingdom Corneal Pachymetry Market Volume (K Unit) Forecast, by Application 2019 & 2032
- Table 83: France Corneal Pachymetry Market Revenue (Million) Forecast, by Application 2019 & 2032
- Table 84: France Corneal Pachymetry Market Volume (K Unit) Forecast, by Application 2019 & 2032
- Table 85: Italy Corneal Pachymetry Market Revenue (Million) Forecast, by Application 2019 & 2032
- Table 86: Italy Corneal Pachymetry Market Volume (K Unit) Forecast, by Application 2019 & 2032
- Table 87: Spain Corneal Pachymetry Market Revenue (Million) Forecast, by Application 2019 & 2032
- Table 88: Spain Corneal Pachymetry Market Volume (K Unit) Forecast, by Application 2019 & 2032
- Table 89: Rest of Europe Corneal Pachymetry Market Revenue (Million) Forecast, by Application 2019 & 2032
- Table 90: Rest of Europe Corneal Pachymetry Market Volume (K Unit) Forecast, by Application 2019 & 2032
- Table 91: Global Corneal Pachymetry Market Revenue Million Forecast, by Type 2019 & 2032
- Table 92: Global Corneal Pachymetry Market Volume K Unit Forecast, by Type 2019 & 2032
- Table 93: Global Corneal Pachymetry Market Revenue Million Forecast, by Application 2019 & 2032
- Table 94: Global Corneal Pachymetry Market Volume K Unit Forecast, by Application 2019 & 2032
- Table 95: Global Corneal Pachymetry Market Revenue Million Forecast, by Country 2019 & 2032
- Table 96: Global Corneal Pachymetry Market Volume K Unit Forecast, by Country 2019 & 2032
- Table 97: China Corneal Pachymetry Market Revenue (Million) Forecast, by Application 2019 & 2032
- Table 98: China Corneal Pachymetry Market Volume (K Unit) Forecast, by Application 2019 & 2032
- Table 99: Japan Corneal Pachymetry Market Revenue (Million) Forecast, by Application 2019 & 2032
- Table 100: Japan Corneal Pachymetry Market Volume (K Unit) Forecast, by Application 2019 & 2032
- Table 101: India Corneal Pachymetry Market Revenue (Million) Forecast, by Application 2019 & 2032
- Table 102: India Corneal Pachymetry Market Volume (K Unit) Forecast, by Application 2019 & 2032
- Table 103: Australia Corneal Pachymetry Market Revenue (Million) Forecast, by Application 2019 & 2032
- Table 104: Australia Corneal Pachymetry Market Volume (K Unit) Forecast, by Application 2019 & 2032
- Table 105: South Korea Corneal Pachymetry Market Revenue (Million) Forecast, by Application 2019 & 2032
- Table 106: South Korea Corneal Pachymetry Market Volume (K Unit) Forecast, by Application 2019 & 2032
- Table 107: Rest of Asia Pacific Corneal Pachymetry Market Revenue (Million) Forecast, by Application 2019 & 2032
- Table 108: Rest of Asia Pacific Corneal Pachymetry Market Volume (K Unit) Forecast, by Application 2019 & 2032
- Table 109: Global Corneal Pachymetry Market Revenue Million Forecast, by Type 2019 & 2032
- Table 110: Global Corneal Pachymetry Market Volume K Unit Forecast, by Type 2019 & 2032
- Table 111: Global Corneal Pachymetry Market Revenue Million Forecast, by Application 2019 & 2032
- Table 112: Global Corneal Pachymetry Market Volume K Unit Forecast, by Application 2019 & 2032
- Table 113: Global Corneal Pachymetry Market Revenue Million Forecast, by Country 2019 & 2032
- Table 114: Global Corneal Pachymetry Market Volume K Unit Forecast, by Country 2019 & 2032
- Table 115: GCC Corneal Pachymetry Market Revenue (Million) Forecast, by Application 2019 & 2032
- Table 116: GCC Corneal Pachymetry Market Volume (K Unit) Forecast, by Application 2019 & 2032
- Table 117: South Africa Corneal Pachymetry Market Revenue (Million) Forecast, by Application 2019 & 2032
- Table 118: South Africa Corneal Pachymetry Market Volume (K Unit) Forecast, by Application 2019 & 2032
- Table 119: Rest of Middle East and Africa Corneal Pachymetry Market Revenue (Million) Forecast, by Application 2019 & 2032
- Table 120: Rest of Middle East and Africa Corneal Pachymetry Market Volume (K Unit) Forecast, by Application 2019 & 2032
- Table 121: Global Corneal Pachymetry Market Revenue Million Forecast, by Type 2019 & 2032
- Table 122: Global Corneal Pachymetry Market Volume K Unit Forecast, by Type 2019 & 2032
- Table 123: Global Corneal Pachymetry Market Revenue Million Forecast, by Application 2019 & 2032
- Table 124: Global Corneal Pachymetry Market Volume K Unit Forecast, by Application 2019 & 2032
- Table 125: Global Corneal Pachymetry Market Revenue Million Forecast, by Country 2019 & 2032
- Table 126: Global Corneal Pachymetry Market Volume K Unit Forecast, by Country 2019 & 2032
- Table 127: Brazil Corneal Pachymetry Market Revenue (Million) Forecast, by Application 2019 & 2032
- Table 128: Brazil Corneal Pachymetry Market Volume (K Unit) Forecast, by Application 2019 & 2032
- Table 129: Argentina Corneal Pachymetry Market Revenue (Million) Forecast, by Application 2019 & 2032
- Table 130: Argentina Corneal Pachymetry Market Volume (K Unit) Forecast, by Application 2019 & 2032
- Table 131: Rest of South America Corneal Pachymetry Market Revenue (Million) Forecast, by Application 2019 & 2032
- Table 132: Rest of South America Corneal Pachymetry Market Volume (K Unit) Forecast, by Application 2019 & 2032
Frequently Asked Questions
1. What is the projected Compound Annual Growth Rate (CAGR) of the Corneal Pachymetry Market?
The projected CAGR is approximately 4.88%.
2. Which companies are prominent players in the Corneal Pachymetry Market?
Key companies in the market include Lumibird Group (Quantel Medical), Xuzhou Kaixin Electronic Instrument Co , DGH Technology Inc, Optovue Incorporated, TOMEY CORPORATION, Reichert Inc, Carl Zeiss AG, Sonomed Escalon, Topcon Corporation, NIDEK CO LTD.
3. What are the main segments of the Corneal Pachymetry Market?
The market segments include Type, Application.
4. Can you provide details about the market size?
The market size is estimated to be USD 304.82 Million as of 2022.
5. What are some drivers contributing to market growth?
Rise in Prevalence of Glaucoma and Eye-related Disorders; Rise in Prevalence of Diabetic Retinopathy.
6. What are the notable trends driving market growth?
Glaucoma Diagnostics Segment Expects to Register a Significant CAGR Over the Forecast Period.
7. Are there any restraints impacting market growth?
Inadequate Reimbursement Coverage for Pachymetry; Stringent Government Regulations.
8. Can you provide examples of recent developments in the market?
January 2023: Bausch + Lomb Corp. and the Glaucoma Research Foundation (GRF) launched "Screen, Protect, Cure," a campaign designed to provide educational resources and raise awareness of glaucoma in the United States.
9. What pricing options are available for accessing the report?
Pricing options include single-user, multi-user, and enterprise licenses priced at USD 4750, USD 5250, and USD 8750 respectively.
10. Is the market size provided in terms of value or volume?
The market size is provided in terms of value, measured in Million and volume, measured in K Unit.
11. Are there any specific market keywords associated with the report?
Yes, the market keyword associated with the report is "Corneal Pachymetry Market," which aids in identifying and referencing the specific market segment covered.
12. How do I determine which pricing option suits my needs best?
The pricing options vary based on user requirements and access needs. Individual users may opt for single-user licenses, while businesses requiring broader access may choose multi-user or enterprise licenses for cost-effective access to the report.
13. Are there any additional resources or data provided in the Corneal Pachymetry Market report?
While the report offers comprehensive insights, it's advisable to review the specific contents or supplementary materials provided to ascertain if additional resources or data are available.
14. How can I stay updated on further developments or reports in the Corneal Pachymetry Market?
To stay informed about further developments, trends, and reports in the Corneal Pachymetry Market, consider subscribing to industry newsletters, following relevant companies and organizations, or regularly checking reputable industry news sources and publications.
Methodology
Step 1 - Identification of Relevant Samples Size from Population Database


Step 2 - Approaches for Defining Global Market Size (Value, Volume* & Price*)

Note*: In applicable scenarios
Step 3 - Data Sources
Primary Research
- Web Analytics
- Survey Reports
- Research Institute
- Latest Research Reports
- Opinion Leaders
Secondary Research
- Annual Reports
- White Paper
- Latest Press Release
- Industry Association
- Paid Database
- Investor Presentations

Step 4 - Data Triangulation
Involves using different sources of information in order to increase the validity of a study
These sources are likely to be stakeholders in a program - participants, other researchers, program staff, other community members, and so on.
Then we put all data in single framework & apply various statistical tools to find out the dynamic on the market.
During the analysis stage, feedback from the stakeholder groups would be compared to determine areas of agreement as well as areas of divergence


