
Key Insights
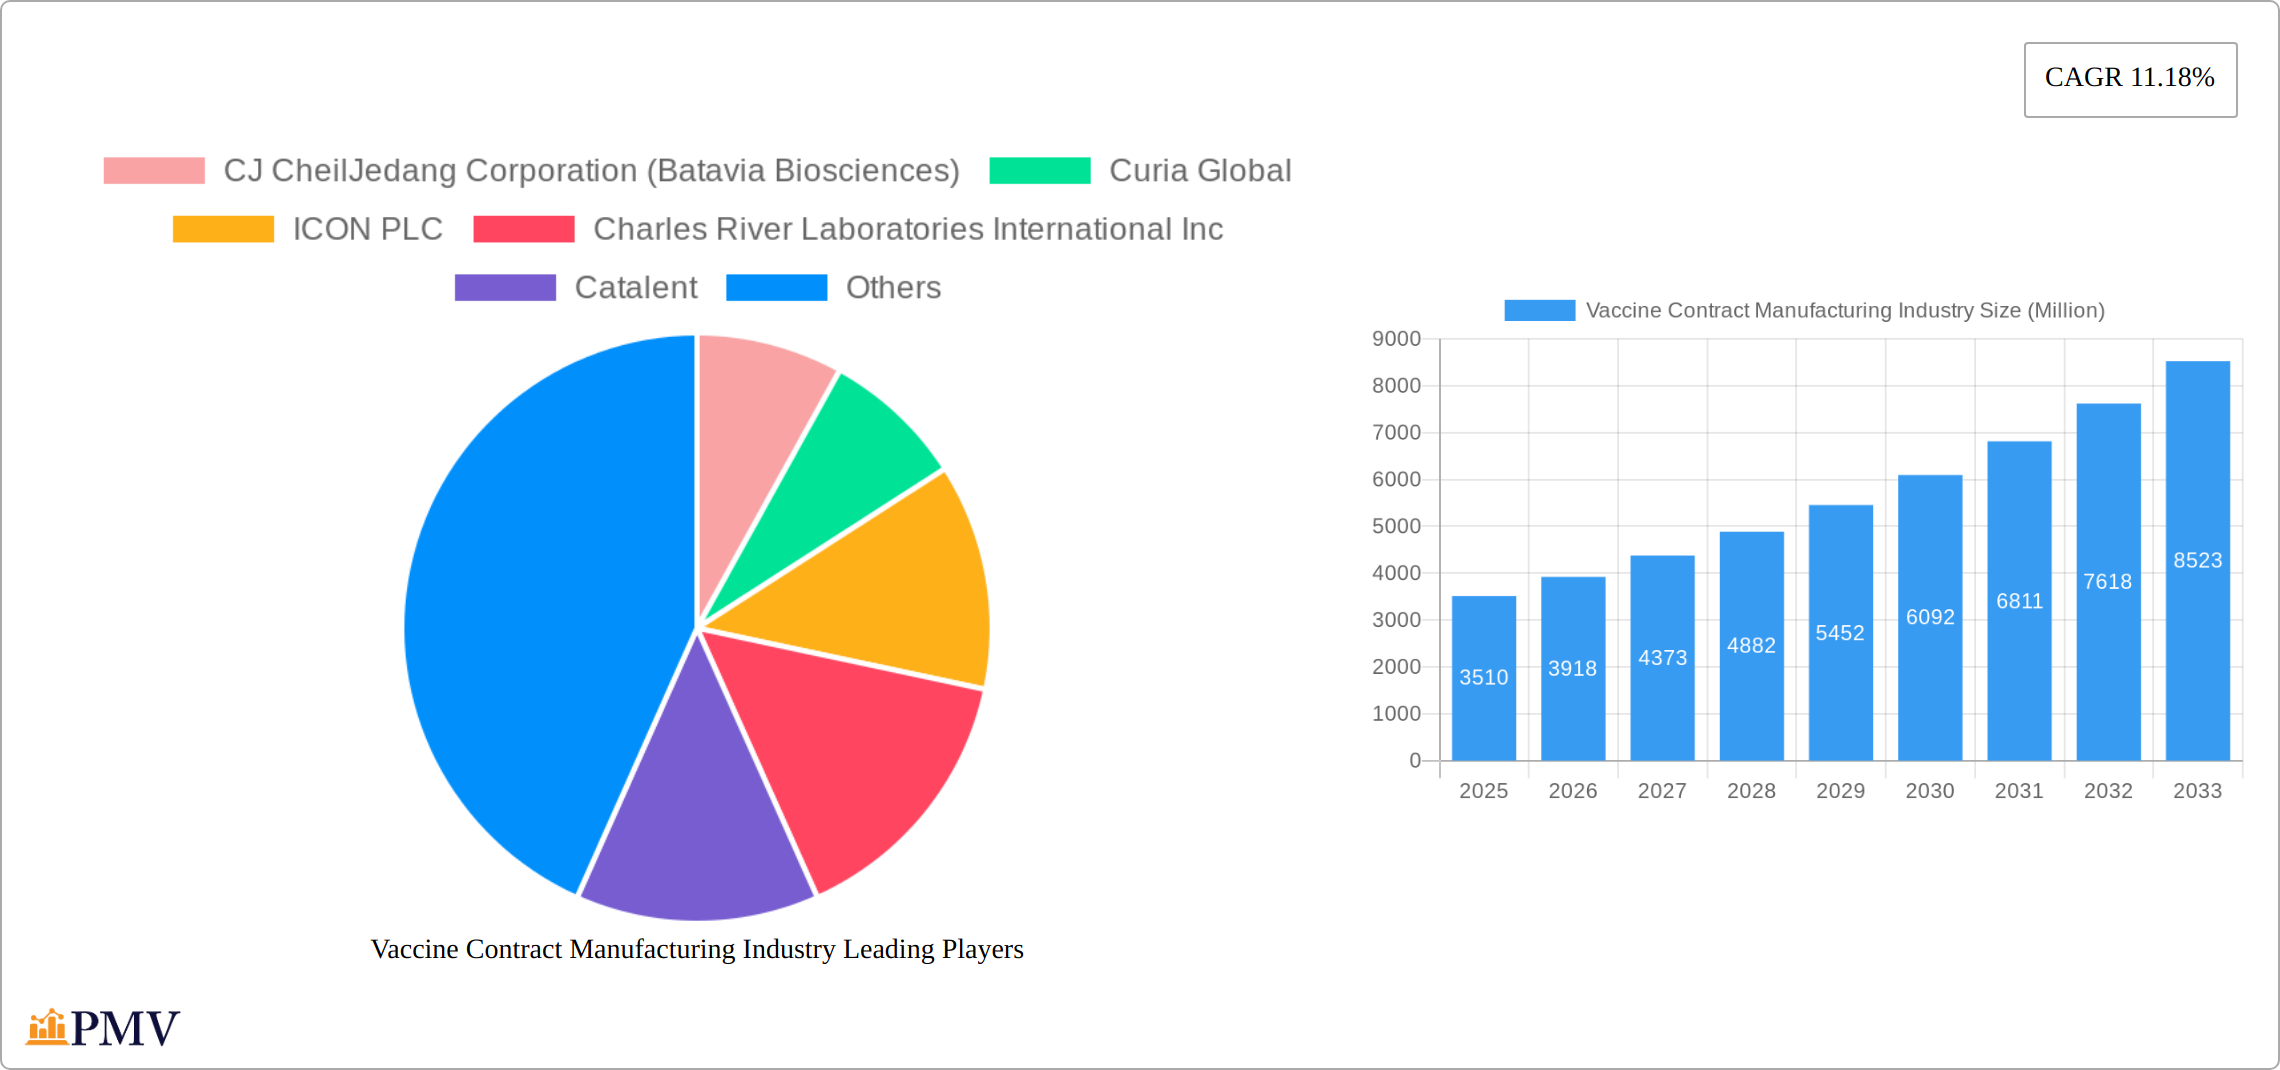
The global vaccine contract manufacturing market, valued at $3.51 billion in 2025, is projected to experience robust growth, driven by increasing demand for vaccines globally and the rising prevalence of infectious diseases. A Compound Annual Growth Rate (CAGR) of 11.18% from 2025 to 2033 indicates significant expansion. This growth is fueled by several key factors, including the ongoing need for pandemic preparedness, advancements in vaccine technologies (such as mRNA and novel delivery systems), and the outsourcing trend among pharmaceutical companies seeking to optimize their manufacturing capabilities and reduce costs. The market's segmentation reveals strong demand across various end-uses, including human and veterinary applications, and diverse vaccine types, ranging from traditional inactivated and live-attenuated vaccines to more modern RNA and subunit vaccines. The downstream segment of the manufacturing process contributes significantly to the overall market size. Leading players like Catalent, Lonza, and Charles River Laboratories are strategically expanding their capacities and technological capabilities to capitalize on this burgeoning market. The geographical distribution reflects strong growth across North America and Europe, alongside promising expansion in the Asia-Pacific region driven by increasing healthcare infrastructure and rising disposable incomes.
The competitive landscape is highly consolidated, with several large Contract Development and Manufacturing Organizations (CDMOs) holding significant market share. However, smaller specialized players also contribute, often focusing on niche vaccine types or specific manufacturing processes. The market is characterized by continuous innovation, with companies investing heavily in research and development to meet the evolving needs of vaccine developers. Regulatory hurdles and stringent quality control requirements present challenges, but the overall market outlook remains positive, indicating significant opportunities for growth and innovation in the coming years. The preclinical and clinical stages contribute significantly to the market due to the need for contract manufacturers during the development and testing phases of vaccine production. Commercial-scale manufacturing, while representing a substantial portion, shows growth proportionate to successful vaccine development and market entry.
Vaccine Contract Manufacturing Industry: A Comprehensive Market Report (2019-2033)
This detailed report provides a comprehensive analysis of the Vaccine Contract Manufacturing industry, offering invaluable insights for stakeholders, investors, and industry professionals. With a study period spanning 2019-2033, a base year of 2025, and a forecast period of 2025-2033, this report offers a robust understanding of current market dynamics and future growth trajectories. The market is projected to reach xx Million by 2033, exhibiting a CAGR of xx% during the forecast period.
Vaccine Contract Manufacturing Industry Market Structure & Competitive Dynamics
The Vaccine Contract Manufacturing industry is characterized by a moderately concentrated market structure, with several large players holding significant market share. The top 10 companies account for approximately xx% of the global market, while a fragmented landscape of smaller contract manufacturers also exists. Market concentration is influenced by factors such as technological capabilities, regulatory approvals, and established client relationships. Innovation ecosystems are vibrant, driven by continuous advancements in vaccine technology and manufacturing processes. Stringent regulatory frameworks, including those from the FDA and EMA, heavily influence market dynamics, ensuring high quality and safety standards. Product substitutes are limited, primarily focusing on in-house vaccine manufacturing by larger pharmaceutical companies, however, the growing prevalence of outsourcing favors contract manufacturers. End-user trends demonstrate a significant shift towards outsourcing manufacturing to reduce costs and accelerate time to market. Mergers and acquisitions (M&A) activity has been substantial, with several billion-dollar deals reported in recent years. For example, the acquisition of xx company by xx company in 202x valued at xx Million reflects the consolidation trend within the sector. Key M&A drivers include expanding manufacturing capabilities, accessing new technologies, and achieving greater geographic reach.
- Market Share: Top 5 players hold approximately xx%.
- M&A Deal Values: Average deal size in recent years: xx Million.
- Regulatory Landscape: FDA, EMA, and other regional bodies heavily influence market access.
Vaccine Contract Manufacturing Industry Industry Trends & Insights
The Vaccine Contract Manufacturing industry is experiencing robust growth, propelled by several key factors. The increasing prevalence of infectious diseases and growing demand for vaccines are major drivers. Technological advancements, such as mRNA vaccine technology and improved downstream processing techniques, are revolutionizing manufacturing capabilities and efficiency. Consumer preferences are shifting towards more accessible and affordable vaccines, pressuring contract manufacturers to optimize production costs while maintaining quality. Competitive dynamics are intensified by continuous innovation, capacity expansion, and strategic partnerships. The market penetration of advanced vaccine technologies like RNA vaccines is increasing rapidly, and the industry is witnessing the emergence of specialized contract manufacturers focusing on these novel platforms. This leads to significant investments in capital expenditures and R&D to keep pace with demand and maintain competitive advantages.
Dominant Markets & Segments in Vaccine Contract Manufacturing Industry
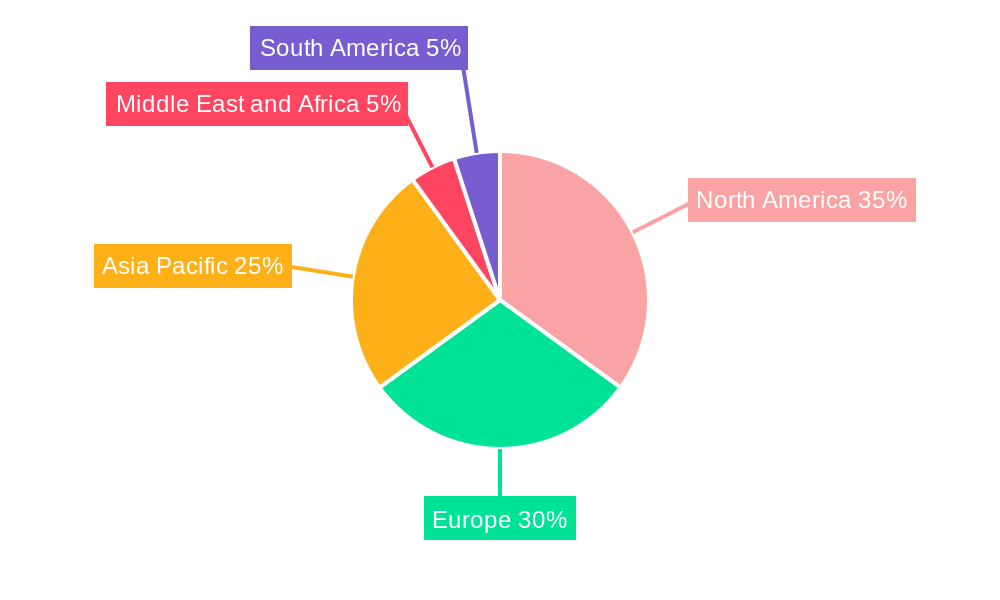
The human use segment dominates the vaccine contract manufacturing market, accounting for approximately xx% of the total revenue in 2024. North America and Europe represent the largest regional markets, driven by strong regulatory frameworks, robust healthcare infrastructure, and high vaccine demand.
- Leading Region: North America
- Key Drivers:
- Strong regulatory support and healthcare infrastructure.
- High per capita disposable income and health expenditure.
- Established pharmaceutical industry and R&D ecosystem.
- Focus on preventative healthcare.
Segment-wise dominance:
- End Use: Human Use (xx Million) significantly surpasses Veterinary (xx Million).
- Vaccine Type: Inactivated vaccines maintain the largest share, followed by live-attenuated vaccines. The growth in RNA vaccines is significant, though from a smaller current base. Subunit and toxoid-based vaccines also exhibit substantial market sizes.
- Process: Downstream processing constitutes a larger share, as upstream is often undertaken in-house by vaccine developers.
- Scale of Operations: Commercial scale dominates, with a significant portion of clinical scale operations. Preclinical manufacturing forms a smaller niche market.
Vaccine Contract Manufacturing Industry Product Innovations
Recent advancements in vaccine manufacturing processes, particularly in downstream purification and formulation, are driving innovation. Single-use technologies, continuous manufacturing processes, and automation are enhancing efficiency, reducing costs, and improving quality. The emergence of mRNA vaccines has opened up new avenues for rapid vaccine development and manufacturing, presenting significant opportunities for contract manufacturers specializing in this technology. This increased efficiency and capacity expansion are crucial for meeting the growing global demand for vaccines.
Report Segmentation & Scope
This report segments the vaccine contract manufacturing market across various parameters to provide a granular view of market dynamics.
- End Use: Human Use, Veterinary
- Vaccine Type: Inactivated Vaccines, Live-attenuated Vaccines, RNA Vaccines, Subunit Vaccines, Toxoid-based Vaccines
- Process: Upstream, Downstream
- Scale of Operations: Preclinical, Clinical, Commercial
Each segment includes growth projections, market size estimations, and competitive landscape analysis. The report predicts a xx Million market size for human use vaccines by 2033.
Key Drivers of Vaccine Contract Manufacturing Industry Growth
Several factors are propelling the growth of the vaccine contract manufacturing industry. These include:
- Technological advancements: mRNA technology, automation, and single-use systems are improving efficiency and reducing costs.
- Increased prevalence of infectious diseases: Growing incidence of both established and emerging infectious diseases fuels vaccine demand.
- Favorable regulatory environment: Regulatory bodies are streamlining approval processes for new vaccines, facilitating market entry.
- Outsourcing trend: Pharmaceutical companies increasingly outsource manufacturing to focus on R&D and marketing.
Challenges in the Vaccine Contract Manufacturing Industry Sector
Despite significant growth, the industry faces several challenges:
- Stringent regulatory requirements: Meeting stringent quality and safety standards entails high costs and compliance burdens.
- Supply chain complexities: Ensuring a stable supply of raw materials and consumables can be challenging.
- Competitive landscape: Intense competition among contract manufacturers necessitates continuous innovation and cost optimization. Price pressure from large pharmaceutical clients also presents a challenge.
- Capacity constraints: Meeting surges in demand, especially during pandemics, may result in capacity bottlenecks.
Leading Players in the Vaccine Contract Manufacturing Industry Market
- CJ CheilJedang Corporation (Batavia Biosciences)
- Curia Global
- ICON PLC
- Charles River Laboratories International Inc
- Catalent
- IDT Biologika GmbH
- Lonza Group AG
- Gedeon Richter (Richter-Helm BioLogics)
- Ajinomoto Bio-Pharma Services
- Recipharm AB
- Emergent BioSolutions Inc
- Fujifilm Holdings Corporation
Key Developments in Vaccine Contract Manufacturing Industry Sector
- August 2022: Moderna's agreement with the Canadian government to build an mRNA vaccine manufacturing facility signifies a major investment in domestic vaccine production capabilities, potentially impacting regional market dynamics and influencing other companies to consider similar partnerships.
- June 2022: The collaboration between Merck and Agilent Technologies to improve downstream processing technologies highlights the continuous drive for enhanced efficiency and reduced manufacturing costs within the industry. This can lead to increased competitiveness among contract manufacturers.
Strategic Vaccine Contract Manufacturing Industry Market Outlook
The future of the vaccine contract manufacturing industry is bright. Continued growth is expected, driven by increasing demand for vaccines, technological advancements, and strategic partnerships. The industry will witness further consolidation through mergers and acquisitions, resulting in larger, more integrated players with enhanced manufacturing capabilities. Strategic opportunities lie in specializing in niche vaccine technologies, expanding into emerging markets, and investing in advanced manufacturing technologies to maintain a competitive edge. The focus on speed, efficiency, and cost-effectiveness will be paramount for success in this dynamic market.
Vaccine Contract Manufacturing Industry Segmentation
-
1. Vaccine Type
- 1.1. Inactivated Vaccines
- 1.2. Live-attenuated Vaccines
- 1.3. RNA Vaccines
- 1.4. Subunit Vaccines
- 1.5. Toxoid-based Vaccines
-
2. Process
-
2.1. Downstream
- 2.1.1. Analytical and QC Studies
- 2.1.2. Fill and Finish
- 2.1.3. Packaging
- 2.1.4. Other Downstream Processes
-
2.2. Upstream
- 2.2.1. Bacterial Expression Systems
- 2.2.2. Baculovirus/Insect Expression Systems
- 2.2.3. Mammalian Expression Systems
- 2.2.4. Yeast Expression Systems
- 2.2.5. Other Upstream Processes
-
2.1. Downstream
-
3. Scale of Operations
- 3.1. Preclinical
- 3.2. Clinical
- 3.3. Commercial
-
4. End Use
- 4.1. Human Use
- 4.2. Veterinary
Vaccine Contract Manufacturing Industry Segmentation By Geography
-
1. North America
- 1.1. United States
- 1.2. Canada
- 1.3. Mexico
-
2. Europe
- 2.1. Germany
- 2.2. United Kingdom
- 2.3. France
- 2.4. Italy
- 2.5. Spain
- 2.6. Rest of Europe
-
3. Asia Pacific
- 3.1. China
- 3.2. Japan
- 3.3. India
- 3.4. Australia
- 3.5. South Korea
- 3.6. Rest of Asia Pacific
-
4. Middle East and Africa
- 4.1. GCC
- 4.2. South Africa
- 4.3. Rest of Middle East and Africa
-
5. South America
- 5.1. Brazil
- 5.2. Argentina
- 5.3. Rest of South America
Vaccine Contract Manufacturing Industry REPORT HIGHLIGHTS
| Aspects | Details |
|---|---|
| Study Period | 2019-2033 |
| Base Year | 2024 |
| Estimated Year | 2025 |
| Forecast Period | 2025-2033 |
| Historical Period | 2019-2024 |
| Growth Rate | CAGR of 11.18% from 2019-2033 |
| Segmentation |
|
Table of Contents
- 1. Introduction
- 1.1. Research Scope
- 1.2. Market Segmentation
- 1.3. Research Methodology
- 1.4. Definitions and Assumptions
- 2. Executive Summary
- 2.1. Introduction
- 3. Market Dynamics
- 3.1. Introduction
- 3.2. Market Drivers
- 3.2.1. Advancements in Technology and Cost Benefits in Infrastructure and Operational Benefits; Increase in Initiatives Favoring Vaccinations; Favorable Patient Demographics and Growing Vaccinations of Newborns and Children
- 3.3. Market Restrains
- 3.3.1. Rising High Costs of Vaccines; Lack of Storage Infrastructure and Limitations Associated with Supply Chain
- 3.4. Market Trends
- 3.4.1. The Inactivated Vaccines Segment is Expected to Hold a Significant Share in the Vaccine Contract Manufacturing Market over the Forecast Period
- 4. Market Factor Analysis
- 4.1. Porters Five Forces
- 4.2. Supply/Value Chain
- 4.3. PESTEL analysis
- 4.4. Market Entropy
- 4.5. Patent/Trademark Analysis
- 5. Global Vaccine Contract Manufacturing Industry Analysis, Insights and Forecast, 2019-2031
- 5.1. Market Analysis, Insights and Forecast - by Vaccine Type
- 5.1.1. Inactivated Vaccines
- 5.1.2. Live-attenuated Vaccines
- 5.1.3. RNA Vaccines
- 5.1.4. Subunit Vaccines
- 5.1.5. Toxoid-based Vaccines
- 5.2. Market Analysis, Insights and Forecast - by Process
- 5.2.1. Downstream
- 5.2.1.1. Analytical and QC Studies
- 5.2.1.2. Fill and Finish
- 5.2.1.3. Packaging
- 5.2.1.4. Other Downstream Processes
- 5.2.2. Upstream
- 5.2.2.1. Bacterial Expression Systems
- 5.2.2.2. Baculovirus/Insect Expression Systems
- 5.2.2.3. Mammalian Expression Systems
- 5.2.2.4. Yeast Expression Systems
- 5.2.2.5. Other Upstream Processes
- 5.2.1. Downstream
- 5.3. Market Analysis, Insights and Forecast - by Scale of Operations
- 5.3.1. Preclinical
- 5.3.2. Clinical
- 5.3.3. Commercial
- 5.4. Market Analysis, Insights and Forecast - by End Use
- 5.4.1. Human Use
- 5.4.2. Veterinary
- 5.5. Market Analysis, Insights and Forecast - by Region
- 5.5.1. North America
- 5.5.2. Europe
- 5.5.3. Asia Pacific
- 5.5.4. Middle East and Africa
- 5.5.5. South America
- 5.1. Market Analysis, Insights and Forecast - by Vaccine Type
- 6. North America Vaccine Contract Manufacturing Industry Analysis, Insights and Forecast, 2019-2031
- 6.1. Market Analysis, Insights and Forecast - by Vaccine Type
- 6.1.1. Inactivated Vaccines
- 6.1.2. Live-attenuated Vaccines
- 6.1.3. RNA Vaccines
- 6.1.4. Subunit Vaccines
- 6.1.5. Toxoid-based Vaccines
- 6.2. Market Analysis, Insights and Forecast - by Process
- 6.2.1. Downstream
- 6.2.1.1. Analytical and QC Studies
- 6.2.1.2. Fill and Finish
- 6.2.1.3. Packaging
- 6.2.1.4. Other Downstream Processes
- 6.2.2. Upstream
- 6.2.2.1. Bacterial Expression Systems
- 6.2.2.2. Baculovirus/Insect Expression Systems
- 6.2.2.3. Mammalian Expression Systems
- 6.2.2.4. Yeast Expression Systems
- 6.2.2.5. Other Upstream Processes
- 6.2.1. Downstream
- 6.3. Market Analysis, Insights and Forecast - by Scale of Operations
- 6.3.1. Preclinical
- 6.3.2. Clinical
- 6.3.3. Commercial
- 6.4. Market Analysis, Insights and Forecast - by End Use
- 6.4.1. Human Use
- 6.4.2. Veterinary
- 6.1. Market Analysis, Insights and Forecast - by Vaccine Type
- 7. Europe Vaccine Contract Manufacturing Industry Analysis, Insights and Forecast, 2019-2031
- 7.1. Market Analysis, Insights and Forecast - by Vaccine Type
- 7.1.1. Inactivated Vaccines
- 7.1.2. Live-attenuated Vaccines
- 7.1.3. RNA Vaccines
- 7.1.4. Subunit Vaccines
- 7.1.5. Toxoid-based Vaccines
- 7.2. Market Analysis, Insights and Forecast - by Process
- 7.2.1. Downstream
- 7.2.1.1. Analytical and QC Studies
- 7.2.1.2. Fill and Finish
- 7.2.1.3. Packaging
- 7.2.1.4. Other Downstream Processes
- 7.2.2. Upstream
- 7.2.2.1. Bacterial Expression Systems
- 7.2.2.2. Baculovirus/Insect Expression Systems
- 7.2.2.3. Mammalian Expression Systems
- 7.2.2.4. Yeast Expression Systems
- 7.2.2.5. Other Upstream Processes
- 7.2.1. Downstream
- 7.3. Market Analysis, Insights and Forecast - by Scale of Operations
- 7.3.1. Preclinical
- 7.3.2. Clinical
- 7.3.3. Commercial
- 7.4. Market Analysis, Insights and Forecast - by End Use
- 7.4.1. Human Use
- 7.4.2. Veterinary
- 7.1. Market Analysis, Insights and Forecast - by Vaccine Type
- 8. Asia Pacific Vaccine Contract Manufacturing Industry Analysis, Insights and Forecast, 2019-2031
- 8.1. Market Analysis, Insights and Forecast - by Vaccine Type
- 8.1.1. Inactivated Vaccines
- 8.1.2. Live-attenuated Vaccines
- 8.1.3. RNA Vaccines
- 8.1.4. Subunit Vaccines
- 8.1.5. Toxoid-based Vaccines
- 8.2. Market Analysis, Insights and Forecast - by Process
- 8.2.1. Downstream
- 8.2.1.1. Analytical and QC Studies
- 8.2.1.2. Fill and Finish
- 8.2.1.3. Packaging
- 8.2.1.4. Other Downstream Processes
- 8.2.2. Upstream
- 8.2.2.1. Bacterial Expression Systems
- 8.2.2.2. Baculovirus/Insect Expression Systems
- 8.2.2.3. Mammalian Expression Systems
- 8.2.2.4. Yeast Expression Systems
- 8.2.2.5. Other Upstream Processes
- 8.2.1. Downstream
- 8.3. Market Analysis, Insights and Forecast - by Scale of Operations
- 8.3.1. Preclinical
- 8.3.2. Clinical
- 8.3.3. Commercial
- 8.4. Market Analysis, Insights and Forecast - by End Use
- 8.4.1. Human Use
- 8.4.2. Veterinary
- 8.1. Market Analysis, Insights and Forecast - by Vaccine Type
- 9. Middle East and Africa Vaccine Contract Manufacturing Industry Analysis, Insights and Forecast, 2019-2031
- 9.1. Market Analysis, Insights and Forecast - by Vaccine Type
- 9.1.1. Inactivated Vaccines
- 9.1.2. Live-attenuated Vaccines
- 9.1.3. RNA Vaccines
- 9.1.4. Subunit Vaccines
- 9.1.5. Toxoid-based Vaccines
- 9.2. Market Analysis, Insights and Forecast - by Process
- 9.2.1. Downstream
- 9.2.1.1. Analytical and QC Studies
- 9.2.1.2. Fill and Finish
- 9.2.1.3. Packaging
- 9.2.1.4. Other Downstream Processes
- 9.2.2. Upstream
- 9.2.2.1. Bacterial Expression Systems
- 9.2.2.2. Baculovirus/Insect Expression Systems
- 9.2.2.3. Mammalian Expression Systems
- 9.2.2.4. Yeast Expression Systems
- 9.2.2.5. Other Upstream Processes
- 9.2.1. Downstream
- 9.3. Market Analysis, Insights and Forecast - by Scale of Operations
- 9.3.1. Preclinical
- 9.3.2. Clinical
- 9.3.3. Commercial
- 9.4. Market Analysis, Insights and Forecast - by End Use
- 9.4.1. Human Use
- 9.4.2. Veterinary
- 9.1. Market Analysis, Insights and Forecast - by Vaccine Type
- 10. South America Vaccine Contract Manufacturing Industry Analysis, Insights and Forecast, 2019-2031
- 10.1. Market Analysis, Insights and Forecast - by Vaccine Type
- 10.1.1. Inactivated Vaccines
- 10.1.2. Live-attenuated Vaccines
- 10.1.3. RNA Vaccines
- 10.1.4. Subunit Vaccines
- 10.1.5. Toxoid-based Vaccines
- 10.2. Market Analysis, Insights and Forecast - by Process
- 10.2.1. Downstream
- 10.2.1.1. Analytical and QC Studies
- 10.2.1.2. Fill and Finish
- 10.2.1.3. Packaging
- 10.2.1.4. Other Downstream Processes
- 10.2.2. Upstream
- 10.2.2.1. Bacterial Expression Systems
- 10.2.2.2. Baculovirus/Insect Expression Systems
- 10.2.2.3. Mammalian Expression Systems
- 10.2.2.4. Yeast Expression Systems
- 10.2.2.5. Other Upstream Processes
- 10.2.1. Downstream
- 10.3. Market Analysis, Insights and Forecast - by Scale of Operations
- 10.3.1. Preclinical
- 10.3.2. Clinical
- 10.3.3. Commercial
- 10.4. Market Analysis, Insights and Forecast - by End Use
- 10.4.1. Human Use
- 10.4.2. Veterinary
- 10.1. Market Analysis, Insights and Forecast - by Vaccine Type
- 11. North America Vaccine Contract Manufacturing Industry Analysis, Insights and Forecast, 2019-2031
- 11.1. Market Analysis, Insights and Forecast - By Country/Sub-region
- 11.1.1. undefined
- 12. Europe Vaccine Contract Manufacturing Industry Analysis, Insights and Forecast, 2019-2031
- 12.1. Market Analysis, Insights and Forecast - By Country/Sub-region
- 12.1.1. undefined
- 13. Asia Pacific Vaccine Contract Manufacturing Industry Analysis, Insights and Forecast, 2019-2031
- 13.1. Market Analysis, Insights and Forecast - By Country/Sub-region
- 13.1.1. undefined
- 14. Middle East and Africa Vaccine Contract Manufacturing Industry Analysis, Insights and Forecast, 2019-2031
- 14.1. Market Analysis, Insights and Forecast - By Country/Sub-region
- 14.1.1. undefined
- 15. South America Vaccine Contract Manufacturing Industry Analysis, Insights and Forecast, 2019-2031
- 15.1. Market Analysis, Insights and Forecast - By Country/Sub-region
- 15.1.1. undefined
- 16. Competitive Analysis
- 16.1. Global Market Share Analysis 2024
- 16.2. Company Profiles
- 16.2.1 CJ CheilJedang Corporation (Batavia Biosciences)
- 16.2.1.1. Overview
- 16.2.1.2. Products
- 16.2.1.3. SWOT Analysis
- 16.2.1.4. Recent Developments
- 16.2.1.5. Financials (Based on Availability)
- 16.2.2 Curia Global
- 16.2.2.1. Overview
- 16.2.2.2. Products
- 16.2.2.3. SWOT Analysis
- 16.2.2.4. Recent Developments
- 16.2.2.5. Financials (Based on Availability)
- 16.2.3 ICON PLC
- 16.2.3.1. Overview
- 16.2.3.2. Products
- 16.2.3.3. SWOT Analysis
- 16.2.3.4. Recent Developments
- 16.2.3.5. Financials (Based on Availability)
- 16.2.4 Charles River Laboratories International Inc
- 16.2.4.1. Overview
- 16.2.4.2. Products
- 16.2.4.3. SWOT Analysis
- 16.2.4.4. Recent Developments
- 16.2.4.5. Financials (Based on Availability)
- 16.2.5 Catalent
- 16.2.5.1. Overview
- 16.2.5.2. Products
- 16.2.5.3. SWOT Analysis
- 16.2.5.4. Recent Developments
- 16.2.5.5. Financials (Based on Availability)
- 16.2.6 IDT Biologika GmbH
- 16.2.6.1. Overview
- 16.2.6.2. Products
- 16.2.6.3. SWOT Analysis
- 16.2.6.4. Recent Developments
- 16.2.6.5. Financials (Based on Availability)
- 16.2.7 Lonza Group AG
- 16.2.7.1. Overview
- 16.2.7.2. Products
- 16.2.7.3. SWOT Analysis
- 16.2.7.4. Recent Developments
- 16.2.7.5. Financials (Based on Availability)
- 16.2.8 Gedeon Richter (Richter-Helm BioLogics)
- 16.2.8.1. Overview
- 16.2.8.2. Products
- 16.2.8.3. SWOT Analysis
- 16.2.8.4. Recent Developments
- 16.2.8.5. Financials (Based on Availability)
- 16.2.9 Ajinomoto Bio-Pharma Services
- 16.2.9.1. Overview
- 16.2.9.2. Products
- 16.2.9.3. SWOT Analysis
- 16.2.9.4. Recent Developments
- 16.2.9.5. Financials (Based on Availability)
- 16.2.10 Recipharm AB
- 16.2.10.1. Overview
- 16.2.10.2. Products
- 16.2.10.3. SWOT Analysis
- 16.2.10.4. Recent Developments
- 16.2.10.5. Financials (Based on Availability)
- 16.2.11 Emergent BioSolutions Inc
- 16.2.11.1. Overview
- 16.2.11.2. Products
- 16.2.11.3. SWOT Analysis
- 16.2.11.4. Recent Developments
- 16.2.11.5. Financials (Based on Availability)
- 16.2.12 Fujifilm Holdings Corporation
- 16.2.12.1. Overview
- 16.2.12.2. Products
- 16.2.12.3. SWOT Analysis
- 16.2.12.4. Recent Developments
- 16.2.12.5. Financials (Based on Availability)
- 16.2.1 CJ CheilJedang Corporation (Batavia Biosciences)
List of Figures
- Figure 1: Global Vaccine Contract Manufacturing Industry Revenue Breakdown (Million, %) by Region 2024 & 2032
- Figure 2: Global Vaccine Contract Manufacturing Industry Volume Breakdown (K Unit, %) by Region 2024 & 2032
- Figure 3: North America Vaccine Contract Manufacturing Industry Revenue (Million), by Country 2024 & 2032
- Figure 4: North America Vaccine Contract Manufacturing Industry Volume (K Unit), by Country 2024 & 2032
- Figure 5: North America Vaccine Contract Manufacturing Industry Revenue Share (%), by Country 2024 & 2032
- Figure 6: North America Vaccine Contract Manufacturing Industry Volume Share (%), by Country 2024 & 2032
- Figure 7: Europe Vaccine Contract Manufacturing Industry Revenue (Million), by Country 2024 & 2032
- Figure 8: Europe Vaccine Contract Manufacturing Industry Volume (K Unit), by Country 2024 & 2032
- Figure 9: Europe Vaccine Contract Manufacturing Industry Revenue Share (%), by Country 2024 & 2032
- Figure 10: Europe Vaccine Contract Manufacturing Industry Volume Share (%), by Country 2024 & 2032
- Figure 11: Asia Pacific Vaccine Contract Manufacturing Industry Revenue (Million), by Country 2024 & 2032
- Figure 12: Asia Pacific Vaccine Contract Manufacturing Industry Volume (K Unit), by Country 2024 & 2032
- Figure 13: Asia Pacific Vaccine Contract Manufacturing Industry Revenue Share (%), by Country 2024 & 2032
- Figure 14: Asia Pacific Vaccine Contract Manufacturing Industry Volume Share (%), by Country 2024 & 2032
- Figure 15: Middle East and Africa Vaccine Contract Manufacturing Industry Revenue (Million), by Country 2024 & 2032
- Figure 16: Middle East and Africa Vaccine Contract Manufacturing Industry Volume (K Unit), by Country 2024 & 2032
- Figure 17: Middle East and Africa Vaccine Contract Manufacturing Industry Revenue Share (%), by Country 2024 & 2032
- Figure 18: Middle East and Africa Vaccine Contract Manufacturing Industry Volume Share (%), by Country 2024 & 2032
- Figure 19: South America Vaccine Contract Manufacturing Industry Revenue (Million), by Country 2024 & 2032
- Figure 20: South America Vaccine Contract Manufacturing Industry Volume (K Unit), by Country 2024 & 2032
- Figure 21: South America Vaccine Contract Manufacturing Industry Revenue Share (%), by Country 2024 & 2032
- Figure 22: South America Vaccine Contract Manufacturing Industry Volume Share (%), by Country 2024 & 2032
- Figure 23: North America Vaccine Contract Manufacturing Industry Revenue (Million), by Vaccine Type 2024 & 2032
- Figure 24: North America Vaccine Contract Manufacturing Industry Volume (K Unit), by Vaccine Type 2024 & 2032
- Figure 25: North America Vaccine Contract Manufacturing Industry Revenue Share (%), by Vaccine Type 2024 & 2032
- Figure 26: North America Vaccine Contract Manufacturing Industry Volume Share (%), by Vaccine Type 2024 & 2032
- Figure 27: North America Vaccine Contract Manufacturing Industry Revenue (Million), by Process 2024 & 2032
- Figure 28: North America Vaccine Contract Manufacturing Industry Volume (K Unit), by Process 2024 & 2032
- Figure 29: North America Vaccine Contract Manufacturing Industry Revenue Share (%), by Process 2024 & 2032
- Figure 30: North America Vaccine Contract Manufacturing Industry Volume Share (%), by Process 2024 & 2032
- Figure 31: North America Vaccine Contract Manufacturing Industry Revenue (Million), by Scale of Operations 2024 & 2032
- Figure 32: North America Vaccine Contract Manufacturing Industry Volume (K Unit), by Scale of Operations 2024 & 2032
- Figure 33: North America Vaccine Contract Manufacturing Industry Revenue Share (%), by Scale of Operations 2024 & 2032
- Figure 34: North America Vaccine Contract Manufacturing Industry Volume Share (%), by Scale of Operations 2024 & 2032
- Figure 35: North America Vaccine Contract Manufacturing Industry Revenue (Million), by End Use 2024 & 2032
- Figure 36: North America Vaccine Contract Manufacturing Industry Volume (K Unit), by End Use 2024 & 2032
- Figure 37: North America Vaccine Contract Manufacturing Industry Revenue Share (%), by End Use 2024 & 2032
- Figure 38: North America Vaccine Contract Manufacturing Industry Volume Share (%), by End Use 2024 & 2032
- Figure 39: North America Vaccine Contract Manufacturing Industry Revenue (Million), by Country 2024 & 2032
- Figure 40: North America Vaccine Contract Manufacturing Industry Volume (K Unit), by Country 2024 & 2032
- Figure 41: North America Vaccine Contract Manufacturing Industry Revenue Share (%), by Country 2024 & 2032
- Figure 42: North America Vaccine Contract Manufacturing Industry Volume Share (%), by Country 2024 & 2032
- Figure 43: Europe Vaccine Contract Manufacturing Industry Revenue (Million), by Vaccine Type 2024 & 2032
- Figure 44: Europe Vaccine Contract Manufacturing Industry Volume (K Unit), by Vaccine Type 2024 & 2032
- Figure 45: Europe Vaccine Contract Manufacturing Industry Revenue Share (%), by Vaccine Type 2024 & 2032
- Figure 46: Europe Vaccine Contract Manufacturing Industry Volume Share (%), by Vaccine Type 2024 & 2032
- Figure 47: Europe Vaccine Contract Manufacturing Industry Revenue (Million), by Process 2024 & 2032
- Figure 48: Europe Vaccine Contract Manufacturing Industry Volume (K Unit), by Process 2024 & 2032
- Figure 49: Europe Vaccine Contract Manufacturing Industry Revenue Share (%), by Process 2024 & 2032
- Figure 50: Europe Vaccine Contract Manufacturing Industry Volume Share (%), by Process 2024 & 2032
- Figure 51: Europe Vaccine Contract Manufacturing Industry Revenue (Million), by Scale of Operations 2024 & 2032
- Figure 52: Europe Vaccine Contract Manufacturing Industry Volume (K Unit), by Scale of Operations 2024 & 2032
- Figure 53: Europe Vaccine Contract Manufacturing Industry Revenue Share (%), by Scale of Operations 2024 & 2032
- Figure 54: Europe Vaccine Contract Manufacturing Industry Volume Share (%), by Scale of Operations 2024 & 2032
- Figure 55: Europe Vaccine Contract Manufacturing Industry Revenue (Million), by End Use 2024 & 2032
- Figure 56: Europe Vaccine Contract Manufacturing Industry Volume (K Unit), by End Use 2024 & 2032
- Figure 57: Europe Vaccine Contract Manufacturing Industry Revenue Share (%), by End Use 2024 & 2032
- Figure 58: Europe Vaccine Contract Manufacturing Industry Volume Share (%), by End Use 2024 & 2032
- Figure 59: Europe Vaccine Contract Manufacturing Industry Revenue (Million), by Country 2024 & 2032
- Figure 60: Europe Vaccine Contract Manufacturing Industry Volume (K Unit), by Country 2024 & 2032
- Figure 61: Europe Vaccine Contract Manufacturing Industry Revenue Share (%), by Country 2024 & 2032
- Figure 62: Europe Vaccine Contract Manufacturing Industry Volume Share (%), by Country 2024 & 2032
- Figure 63: Asia Pacific Vaccine Contract Manufacturing Industry Revenue (Million), by Vaccine Type 2024 & 2032
- Figure 64: Asia Pacific Vaccine Contract Manufacturing Industry Volume (K Unit), by Vaccine Type 2024 & 2032
- Figure 65: Asia Pacific Vaccine Contract Manufacturing Industry Revenue Share (%), by Vaccine Type 2024 & 2032
- Figure 66: Asia Pacific Vaccine Contract Manufacturing Industry Volume Share (%), by Vaccine Type 2024 & 2032
- Figure 67: Asia Pacific Vaccine Contract Manufacturing Industry Revenue (Million), by Process 2024 & 2032
- Figure 68: Asia Pacific Vaccine Contract Manufacturing Industry Volume (K Unit), by Process 2024 & 2032
- Figure 69: Asia Pacific Vaccine Contract Manufacturing Industry Revenue Share (%), by Process 2024 & 2032
- Figure 70: Asia Pacific Vaccine Contract Manufacturing Industry Volume Share (%), by Process 2024 & 2032
- Figure 71: Asia Pacific Vaccine Contract Manufacturing Industry Revenue (Million), by Scale of Operations 2024 & 2032
- Figure 72: Asia Pacific Vaccine Contract Manufacturing Industry Volume (K Unit), by Scale of Operations 2024 & 2032
- Figure 73: Asia Pacific Vaccine Contract Manufacturing Industry Revenue Share (%), by Scale of Operations 2024 & 2032
- Figure 74: Asia Pacific Vaccine Contract Manufacturing Industry Volume Share (%), by Scale of Operations 2024 & 2032
- Figure 75: Asia Pacific Vaccine Contract Manufacturing Industry Revenue (Million), by End Use 2024 & 2032
- Figure 76: Asia Pacific Vaccine Contract Manufacturing Industry Volume (K Unit), by End Use 2024 & 2032
- Figure 77: Asia Pacific Vaccine Contract Manufacturing Industry Revenue Share (%), by End Use 2024 & 2032
- Figure 78: Asia Pacific Vaccine Contract Manufacturing Industry Volume Share (%), by End Use 2024 & 2032
- Figure 79: Asia Pacific Vaccine Contract Manufacturing Industry Revenue (Million), by Country 2024 & 2032
- Figure 80: Asia Pacific Vaccine Contract Manufacturing Industry Volume (K Unit), by Country 2024 & 2032
- Figure 81: Asia Pacific Vaccine Contract Manufacturing Industry Revenue Share (%), by Country 2024 & 2032
- Figure 82: Asia Pacific Vaccine Contract Manufacturing Industry Volume Share (%), by Country 2024 & 2032
- Figure 83: Middle East and Africa Vaccine Contract Manufacturing Industry Revenue (Million), by Vaccine Type 2024 & 2032
- Figure 84: Middle East and Africa Vaccine Contract Manufacturing Industry Volume (K Unit), by Vaccine Type 2024 & 2032
- Figure 85: Middle East and Africa Vaccine Contract Manufacturing Industry Revenue Share (%), by Vaccine Type 2024 & 2032
- Figure 86: Middle East and Africa Vaccine Contract Manufacturing Industry Volume Share (%), by Vaccine Type 2024 & 2032
- Figure 87: Middle East and Africa Vaccine Contract Manufacturing Industry Revenue (Million), by Process 2024 & 2032
- Figure 88: Middle East and Africa Vaccine Contract Manufacturing Industry Volume (K Unit), by Process 2024 & 2032
- Figure 89: Middle East and Africa Vaccine Contract Manufacturing Industry Revenue Share (%), by Process 2024 & 2032
- Figure 90: Middle East and Africa Vaccine Contract Manufacturing Industry Volume Share (%), by Process 2024 & 2032
- Figure 91: Middle East and Africa Vaccine Contract Manufacturing Industry Revenue (Million), by Scale of Operations 2024 & 2032
- Figure 92: Middle East and Africa Vaccine Contract Manufacturing Industry Volume (K Unit), by Scale of Operations 2024 & 2032
- Figure 93: Middle East and Africa Vaccine Contract Manufacturing Industry Revenue Share (%), by Scale of Operations 2024 & 2032
- Figure 94: Middle East and Africa Vaccine Contract Manufacturing Industry Volume Share (%), by Scale of Operations 2024 & 2032
- Figure 95: Middle East and Africa Vaccine Contract Manufacturing Industry Revenue (Million), by End Use 2024 & 2032
- Figure 96: Middle East and Africa Vaccine Contract Manufacturing Industry Volume (K Unit), by End Use 2024 & 2032
- Figure 97: Middle East and Africa Vaccine Contract Manufacturing Industry Revenue Share (%), by End Use 2024 & 2032
- Figure 98: Middle East and Africa Vaccine Contract Manufacturing Industry Volume Share (%), by End Use 2024 & 2032
- Figure 99: Middle East and Africa Vaccine Contract Manufacturing Industry Revenue (Million), by Country 2024 & 2032
- Figure 100: Middle East and Africa Vaccine Contract Manufacturing Industry Volume (K Unit), by Country 2024 & 2032
- Figure 101: Middle East and Africa Vaccine Contract Manufacturing Industry Revenue Share (%), by Country 2024 & 2032
- Figure 102: Middle East and Africa Vaccine Contract Manufacturing Industry Volume Share (%), by Country 2024 & 2032
- Figure 103: South America Vaccine Contract Manufacturing Industry Revenue (Million), by Vaccine Type 2024 & 2032
- Figure 104: South America Vaccine Contract Manufacturing Industry Volume (K Unit), by Vaccine Type 2024 & 2032
- Figure 105: South America Vaccine Contract Manufacturing Industry Revenue Share (%), by Vaccine Type 2024 & 2032
- Figure 106: South America Vaccine Contract Manufacturing Industry Volume Share (%), by Vaccine Type 2024 & 2032
- Figure 107: South America Vaccine Contract Manufacturing Industry Revenue (Million), by Process 2024 & 2032
- Figure 108: South America Vaccine Contract Manufacturing Industry Volume (K Unit), by Process 2024 & 2032
- Figure 109: South America Vaccine Contract Manufacturing Industry Revenue Share (%), by Process 2024 & 2032
- Figure 110: South America Vaccine Contract Manufacturing Industry Volume Share (%), by Process 2024 & 2032
- Figure 111: South America Vaccine Contract Manufacturing Industry Revenue (Million), by Scale of Operations 2024 & 2032
- Figure 112: South America Vaccine Contract Manufacturing Industry Volume (K Unit), by Scale of Operations 2024 & 2032
- Figure 113: South America Vaccine Contract Manufacturing Industry Revenue Share (%), by Scale of Operations 2024 & 2032
- Figure 114: South America Vaccine Contract Manufacturing Industry Volume Share (%), by Scale of Operations 2024 & 2032
- Figure 115: South America Vaccine Contract Manufacturing Industry Revenue (Million), by End Use 2024 & 2032
- Figure 116: South America Vaccine Contract Manufacturing Industry Volume (K Unit), by End Use 2024 & 2032
- Figure 117: South America Vaccine Contract Manufacturing Industry Revenue Share (%), by End Use 2024 & 2032
- Figure 118: South America Vaccine Contract Manufacturing Industry Volume Share (%), by End Use 2024 & 2032
- Figure 119: South America Vaccine Contract Manufacturing Industry Revenue (Million), by Country 2024 & 2032
- Figure 120: South America Vaccine Contract Manufacturing Industry Volume (K Unit), by Country 2024 & 2032
- Figure 121: South America Vaccine Contract Manufacturing Industry Revenue Share (%), by Country 2024 & 2032
- Figure 122: South America Vaccine Contract Manufacturing Industry Volume Share (%), by Country 2024 & 2032
List of Tables
- Table 1: Global Vaccine Contract Manufacturing Industry Revenue Million Forecast, by Region 2019 & 2032
- Table 2: Global Vaccine Contract Manufacturing Industry Volume K Unit Forecast, by Region 2019 & 2032
- Table 3: Global Vaccine Contract Manufacturing Industry Revenue Million Forecast, by Vaccine Type 2019 & 2032
- Table 4: Global Vaccine Contract Manufacturing Industry Volume K Unit Forecast, by Vaccine Type 2019 & 2032
- Table 5: Global Vaccine Contract Manufacturing Industry Revenue Million Forecast, by Process 2019 & 2032
- Table 6: Global Vaccine Contract Manufacturing Industry Volume K Unit Forecast, by Process 2019 & 2032
- Table 7: Global Vaccine Contract Manufacturing Industry Revenue Million Forecast, by Scale of Operations 2019 & 2032
- Table 8: Global Vaccine Contract Manufacturing Industry Volume K Unit Forecast, by Scale of Operations 2019 & 2032
- Table 9: Global Vaccine Contract Manufacturing Industry Revenue Million Forecast, by End Use 2019 & 2032
- Table 10: Global Vaccine Contract Manufacturing Industry Volume K Unit Forecast, by End Use 2019 & 2032
- Table 11: Global Vaccine Contract Manufacturing Industry Revenue Million Forecast, by Region 2019 & 2032
- Table 12: Global Vaccine Contract Manufacturing Industry Volume K Unit Forecast, by Region 2019 & 2032
- Table 13: Global Vaccine Contract Manufacturing Industry Revenue Million Forecast, by Country 2019 & 2032
- Table 14: Global Vaccine Contract Manufacturing Industry Volume K Unit Forecast, by Country 2019 & 2032
- Table 15: Global Vaccine Contract Manufacturing Industry Revenue Million Forecast, by Country 2019 & 2032
- Table 16: Global Vaccine Contract Manufacturing Industry Volume K Unit Forecast, by Country 2019 & 2032
- Table 17: Global Vaccine Contract Manufacturing Industry Revenue Million Forecast, by Country 2019 & 2032
- Table 18: Global Vaccine Contract Manufacturing Industry Volume K Unit Forecast, by Country 2019 & 2032
- Table 19: Global Vaccine Contract Manufacturing Industry Revenue Million Forecast, by Country 2019 & 2032
- Table 20: Global Vaccine Contract Manufacturing Industry Volume K Unit Forecast, by Country 2019 & 2032
- Table 21: Global Vaccine Contract Manufacturing Industry Revenue Million Forecast, by Country 2019 & 2032
- Table 22: Global Vaccine Contract Manufacturing Industry Volume K Unit Forecast, by Country 2019 & 2032
- Table 23: Global Vaccine Contract Manufacturing Industry Revenue Million Forecast, by Vaccine Type 2019 & 2032
- Table 24: Global Vaccine Contract Manufacturing Industry Volume K Unit Forecast, by Vaccine Type 2019 & 2032
- Table 25: Global Vaccine Contract Manufacturing Industry Revenue Million Forecast, by Process 2019 & 2032
- Table 26: Global Vaccine Contract Manufacturing Industry Volume K Unit Forecast, by Process 2019 & 2032
- Table 27: Global Vaccine Contract Manufacturing Industry Revenue Million Forecast, by Scale of Operations 2019 & 2032
- Table 28: Global Vaccine Contract Manufacturing Industry Volume K Unit Forecast, by Scale of Operations 2019 & 2032
- Table 29: Global Vaccine Contract Manufacturing Industry Revenue Million Forecast, by End Use 2019 & 2032
- Table 30: Global Vaccine Contract Manufacturing Industry Volume K Unit Forecast, by End Use 2019 & 2032
- Table 31: Global Vaccine Contract Manufacturing Industry Revenue Million Forecast, by Country 2019 & 2032
- Table 32: Global Vaccine Contract Manufacturing Industry Volume K Unit Forecast, by Country 2019 & 2032
- Table 33: United States Vaccine Contract Manufacturing Industry Revenue (Million) Forecast, by Application 2019 & 2032
- Table 34: United States Vaccine Contract Manufacturing Industry Volume (K Unit) Forecast, by Application 2019 & 2032
- Table 35: Canada Vaccine Contract Manufacturing Industry Revenue (Million) Forecast, by Application 2019 & 2032
- Table 36: Canada Vaccine Contract Manufacturing Industry Volume (K Unit) Forecast, by Application 2019 & 2032
- Table 37: Mexico Vaccine Contract Manufacturing Industry Revenue (Million) Forecast, by Application 2019 & 2032
- Table 38: Mexico Vaccine Contract Manufacturing Industry Volume (K Unit) Forecast, by Application 2019 & 2032
- Table 39: Global Vaccine Contract Manufacturing Industry Revenue Million Forecast, by Vaccine Type 2019 & 2032
- Table 40: Global Vaccine Contract Manufacturing Industry Volume K Unit Forecast, by Vaccine Type 2019 & 2032
- Table 41: Global Vaccine Contract Manufacturing Industry Revenue Million Forecast, by Process 2019 & 2032
- Table 42: Global Vaccine Contract Manufacturing Industry Volume K Unit Forecast, by Process 2019 & 2032
- Table 43: Global Vaccine Contract Manufacturing Industry Revenue Million Forecast, by Scale of Operations 2019 & 2032
- Table 44: Global Vaccine Contract Manufacturing Industry Volume K Unit Forecast, by Scale of Operations 2019 & 2032
- Table 45: Global Vaccine Contract Manufacturing Industry Revenue Million Forecast, by End Use 2019 & 2032
- Table 46: Global Vaccine Contract Manufacturing Industry Volume K Unit Forecast, by End Use 2019 & 2032
- Table 47: Global Vaccine Contract Manufacturing Industry Revenue Million Forecast, by Country 2019 & 2032
- Table 48: Global Vaccine Contract Manufacturing Industry Volume K Unit Forecast, by Country 2019 & 2032
- Table 49: Germany Vaccine Contract Manufacturing Industry Revenue (Million) Forecast, by Application 2019 & 2032
- Table 50: Germany Vaccine Contract Manufacturing Industry Volume (K Unit) Forecast, by Application 2019 & 2032
- Table 51: United Kingdom Vaccine Contract Manufacturing Industry Revenue (Million) Forecast, by Application 2019 & 2032
- Table 52: United Kingdom Vaccine Contract Manufacturing Industry Volume (K Unit) Forecast, by Application 2019 & 2032
- Table 53: France Vaccine Contract Manufacturing Industry Revenue (Million) Forecast, by Application 2019 & 2032
- Table 54: France Vaccine Contract Manufacturing Industry Volume (K Unit) Forecast, by Application 2019 & 2032
- Table 55: Italy Vaccine Contract Manufacturing Industry Revenue (Million) Forecast, by Application 2019 & 2032
- Table 56: Italy Vaccine Contract Manufacturing Industry Volume (K Unit) Forecast, by Application 2019 & 2032
- Table 57: Spain Vaccine Contract Manufacturing Industry Revenue (Million) Forecast, by Application 2019 & 2032
- Table 58: Spain Vaccine Contract Manufacturing Industry Volume (K Unit) Forecast, by Application 2019 & 2032
- Table 59: Rest of Europe Vaccine Contract Manufacturing Industry Revenue (Million) Forecast, by Application 2019 & 2032
- Table 60: Rest of Europe Vaccine Contract Manufacturing Industry Volume (K Unit) Forecast, by Application 2019 & 2032
- Table 61: Global Vaccine Contract Manufacturing Industry Revenue Million Forecast, by Vaccine Type 2019 & 2032
- Table 62: Global Vaccine Contract Manufacturing Industry Volume K Unit Forecast, by Vaccine Type 2019 & 2032
- Table 63: Global Vaccine Contract Manufacturing Industry Revenue Million Forecast, by Process 2019 & 2032
- Table 64: Global Vaccine Contract Manufacturing Industry Volume K Unit Forecast, by Process 2019 & 2032
- Table 65: Global Vaccine Contract Manufacturing Industry Revenue Million Forecast, by Scale of Operations 2019 & 2032
- Table 66: Global Vaccine Contract Manufacturing Industry Volume K Unit Forecast, by Scale of Operations 2019 & 2032
- Table 67: Global Vaccine Contract Manufacturing Industry Revenue Million Forecast, by End Use 2019 & 2032
- Table 68: Global Vaccine Contract Manufacturing Industry Volume K Unit Forecast, by End Use 2019 & 2032
- Table 69: Global Vaccine Contract Manufacturing Industry Revenue Million Forecast, by Country 2019 & 2032
- Table 70: Global Vaccine Contract Manufacturing Industry Volume K Unit Forecast, by Country 2019 & 2032
- Table 71: China Vaccine Contract Manufacturing Industry Revenue (Million) Forecast, by Application 2019 & 2032
- Table 72: China Vaccine Contract Manufacturing Industry Volume (K Unit) Forecast, by Application 2019 & 2032
- Table 73: Japan Vaccine Contract Manufacturing Industry Revenue (Million) Forecast, by Application 2019 & 2032
- Table 74: Japan Vaccine Contract Manufacturing Industry Volume (K Unit) Forecast, by Application 2019 & 2032
- Table 75: India Vaccine Contract Manufacturing Industry Revenue (Million) Forecast, by Application 2019 & 2032
- Table 76: India Vaccine Contract Manufacturing Industry Volume (K Unit) Forecast, by Application 2019 & 2032
- Table 77: Australia Vaccine Contract Manufacturing Industry Revenue (Million) Forecast, by Application 2019 & 2032
- Table 78: Australia Vaccine Contract Manufacturing Industry Volume (K Unit) Forecast, by Application 2019 & 2032
- Table 79: South Korea Vaccine Contract Manufacturing Industry Revenue (Million) Forecast, by Application 2019 & 2032
- Table 80: South Korea Vaccine Contract Manufacturing Industry Volume (K Unit) Forecast, by Application 2019 & 2032
- Table 81: Rest of Asia Pacific Vaccine Contract Manufacturing Industry Revenue (Million) Forecast, by Application 2019 & 2032
- Table 82: Rest of Asia Pacific Vaccine Contract Manufacturing Industry Volume (K Unit) Forecast, by Application 2019 & 2032
- Table 83: Global Vaccine Contract Manufacturing Industry Revenue Million Forecast, by Vaccine Type 2019 & 2032
- Table 84: Global Vaccine Contract Manufacturing Industry Volume K Unit Forecast, by Vaccine Type 2019 & 2032
- Table 85: Global Vaccine Contract Manufacturing Industry Revenue Million Forecast, by Process 2019 & 2032
- Table 86: Global Vaccine Contract Manufacturing Industry Volume K Unit Forecast, by Process 2019 & 2032
- Table 87: Global Vaccine Contract Manufacturing Industry Revenue Million Forecast, by Scale of Operations 2019 & 2032
- Table 88: Global Vaccine Contract Manufacturing Industry Volume K Unit Forecast, by Scale of Operations 2019 & 2032
- Table 89: Global Vaccine Contract Manufacturing Industry Revenue Million Forecast, by End Use 2019 & 2032
- Table 90: Global Vaccine Contract Manufacturing Industry Volume K Unit Forecast, by End Use 2019 & 2032
- Table 91: Global Vaccine Contract Manufacturing Industry Revenue Million Forecast, by Country 2019 & 2032
- Table 92: Global Vaccine Contract Manufacturing Industry Volume K Unit Forecast, by Country 2019 & 2032
- Table 93: GCC Vaccine Contract Manufacturing Industry Revenue (Million) Forecast, by Application 2019 & 2032
- Table 94: GCC Vaccine Contract Manufacturing Industry Volume (K Unit) Forecast, by Application 2019 & 2032
- Table 95: South Africa Vaccine Contract Manufacturing Industry Revenue (Million) Forecast, by Application 2019 & 2032
- Table 96: South Africa Vaccine Contract Manufacturing Industry Volume (K Unit) Forecast, by Application 2019 & 2032
- Table 97: Rest of Middle East and Africa Vaccine Contract Manufacturing Industry Revenue (Million) Forecast, by Application 2019 & 2032
- Table 98: Rest of Middle East and Africa Vaccine Contract Manufacturing Industry Volume (K Unit) Forecast, by Application 2019 & 2032
- Table 99: Global Vaccine Contract Manufacturing Industry Revenue Million Forecast, by Vaccine Type 2019 & 2032
- Table 100: Global Vaccine Contract Manufacturing Industry Volume K Unit Forecast, by Vaccine Type 2019 & 2032
- Table 101: Global Vaccine Contract Manufacturing Industry Revenue Million Forecast, by Process 2019 & 2032
- Table 102: Global Vaccine Contract Manufacturing Industry Volume K Unit Forecast, by Process 2019 & 2032
- Table 103: Global Vaccine Contract Manufacturing Industry Revenue Million Forecast, by Scale of Operations 2019 & 2032
- Table 104: Global Vaccine Contract Manufacturing Industry Volume K Unit Forecast, by Scale of Operations 2019 & 2032
- Table 105: Global Vaccine Contract Manufacturing Industry Revenue Million Forecast, by End Use 2019 & 2032
- Table 106: Global Vaccine Contract Manufacturing Industry Volume K Unit Forecast, by End Use 2019 & 2032
- Table 107: Global Vaccine Contract Manufacturing Industry Revenue Million Forecast, by Country 2019 & 2032
- Table 108: Global Vaccine Contract Manufacturing Industry Volume K Unit Forecast, by Country 2019 & 2032
- Table 109: Brazil Vaccine Contract Manufacturing Industry Revenue (Million) Forecast, by Application 2019 & 2032
- Table 110: Brazil Vaccine Contract Manufacturing Industry Volume (K Unit) Forecast, by Application 2019 & 2032
- Table 111: Argentina Vaccine Contract Manufacturing Industry Revenue (Million) Forecast, by Application 2019 & 2032
- Table 112: Argentina Vaccine Contract Manufacturing Industry Volume (K Unit) Forecast, by Application 2019 & 2032
- Table 113: Rest of South America Vaccine Contract Manufacturing Industry Revenue (Million) Forecast, by Application 2019 & 2032
- Table 114: Rest of South America Vaccine Contract Manufacturing Industry Volume (K Unit) Forecast, by Application 2019 & 2032
Frequently Asked Questions
1. What is the projected Compound Annual Growth Rate (CAGR) of the Vaccine Contract Manufacturing Industry?
The projected CAGR is approximately 11.18%.
2. Which companies are prominent players in the Vaccine Contract Manufacturing Industry?
Key companies in the market include CJ CheilJedang Corporation (Batavia Biosciences), Curia Global, ICON PLC, Charles River Laboratories International Inc, Catalent, IDT Biologika GmbH, Lonza Group AG, Gedeon Richter (Richter-Helm BioLogics), Ajinomoto Bio-Pharma Services, Recipharm AB, Emergent BioSolutions Inc, Fujifilm Holdings Corporation.
3. What are the main segments of the Vaccine Contract Manufacturing Industry?
The market segments include Vaccine Type, Process, Scale of Operations, End Use.
4. Can you provide details about the market size?
The market size is estimated to be USD 3.51 Million as of 2022.
5. What are some drivers contributing to market growth?
Advancements in Technology and Cost Benefits in Infrastructure and Operational Benefits; Increase in Initiatives Favoring Vaccinations; Favorable Patient Demographics and Growing Vaccinations of Newborns and Children.
6. What are the notable trends driving market growth?
The Inactivated Vaccines Segment is Expected to Hold a Significant Share in the Vaccine Contract Manufacturing Market over the Forecast Period.
7. Are there any restraints impacting market growth?
Rising High Costs of Vaccines; Lack of Storage Infrastructure and Limitations Associated with Supply Chain.
8. Can you provide examples of recent developments in the market?
August 2022: Moderna inked an agreement with the Canadian government to construct a messenger RNA vaccine manufacturing factory in an undetermined location in Canada. According to the biotech firm, the partnership will give Canadians access to mRNA vaccines made in Canada against respiratory viruses such as SARS-CoV-2, influenza, and respiratory syncytial virus.
9. What pricing options are available for accessing the report?
Pricing options include single-user, multi-user, and enterprise licenses priced at USD 4750, USD 5250, and USD 8750 respectively.
10. Is the market size provided in terms of value or volume?
The market size is provided in terms of value, measured in Million and volume, measured in K Unit.
11. Are there any specific market keywords associated with the report?
Yes, the market keyword associated with the report is "Vaccine Contract Manufacturing Industry," which aids in identifying and referencing the specific market segment covered.
12. How do I determine which pricing option suits my needs best?
The pricing options vary based on user requirements and access needs. Individual users may opt for single-user licenses, while businesses requiring broader access may choose multi-user or enterprise licenses for cost-effective access to the report.
13. Are there any additional resources or data provided in the Vaccine Contract Manufacturing Industry report?
While the report offers comprehensive insights, it's advisable to review the specific contents or supplementary materials provided to ascertain if additional resources or data are available.
14. How can I stay updated on further developments or reports in the Vaccine Contract Manufacturing Industry?
To stay informed about further developments, trends, and reports in the Vaccine Contract Manufacturing Industry, consider subscribing to industry newsletters, following relevant companies and organizations, or regularly checking reputable industry news sources and publications.
Methodology
Step 1 - Identification of Relevant Samples Size from Population Database


Step 2 - Approaches for Defining Global Market Size (Value, Volume* & Price*)

Note*: In applicable scenarios
Step 3 - Data Sources
Primary Research
- Web Analytics
- Survey Reports
- Research Institute
- Latest Research Reports
- Opinion Leaders
Secondary Research
- Annual Reports
- White Paper
- Latest Press Release
- Industry Association
- Paid Database
- Investor Presentations

Step 4 - Data Triangulation
Involves using different sources of information in order to increase the validity of a study
These sources are likely to be stakeholders in a program - participants, other researchers, program staff, other community members, and so on.
Then we put all data in single framework & apply various statistical tools to find out the dynamic on the market.
During the analysis stage, feedback from the stakeholder groups would be compared to determine areas of agreement as well as areas of divergence


