

Key Insights
The global used smartphone market is experiencing robust expansion, driven by heightened consumer demand for cost-effective devices and growing environmental consciousness. A projected Compound Annual Growth Rate (CAGR) of 22.6% over the forecast period indicates significant market development. Key growth drivers include the increasing price of new smartphones, compelling budget-conscious consumers towards the pre-owned sector. Simultaneously, rising environmental concerns regarding electronic waste are encouraging the adoption of refurbished and used devices, thereby extending product lifecycles. Market segmentation reveals distinct consumer preferences, with 'Used-Like New' condition devices commanding a premium, while the sub-$200 price segment represents the largest volume. E-commerce platforms are increasingly dominating sales channels due to their inherent convenience and accessibility. The continued prevalence of Android and iOS operating systems highlights the critical role of platform compatibility. Leading players such as Alibaba, Amazon, and Flipkart are capitalizing on their extensive e-commerce networks, while specialized refurbishers like Reboxed are addressing specific niche market demands. Geographically, North America and the Asia Pacific regions are exhibiting strong performance, characterized by high smartphone penetration rates and active secondary markets.
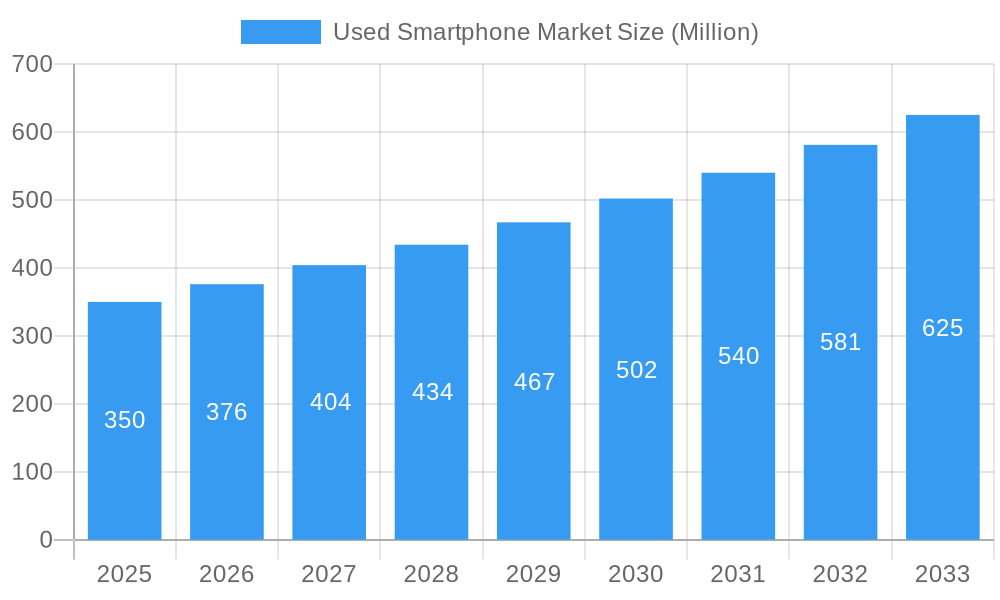
Used Smartphone Market Market Size (In Billion)
The market's future outlook remains exceptionally strong. Advancements in refurbishment processes, leading to enhanced device quality and extended warranties, are expected to bolster consumer trust. Innovations in battery technology and repair services will further contribute to the longevity of used smartphones. However, potential challenges such as data security concerns and device malfunction risks may temper growth. Implementing effective mitigation strategies, including stringent data sanitization protocols and comprehensive warranty offerings, will be paramount for sustained market expansion. As the market matures, competition among participants, particularly between online and offline retailers, will intensify. Differentiation through superior customer service, robust warranties, and a wider selection of devices will be crucial for long-term success in this dynamic and expanding market. We project the market size to reach $42.33 billion by 2025, with a projected CAGR of 22.6% from the base year 2025.
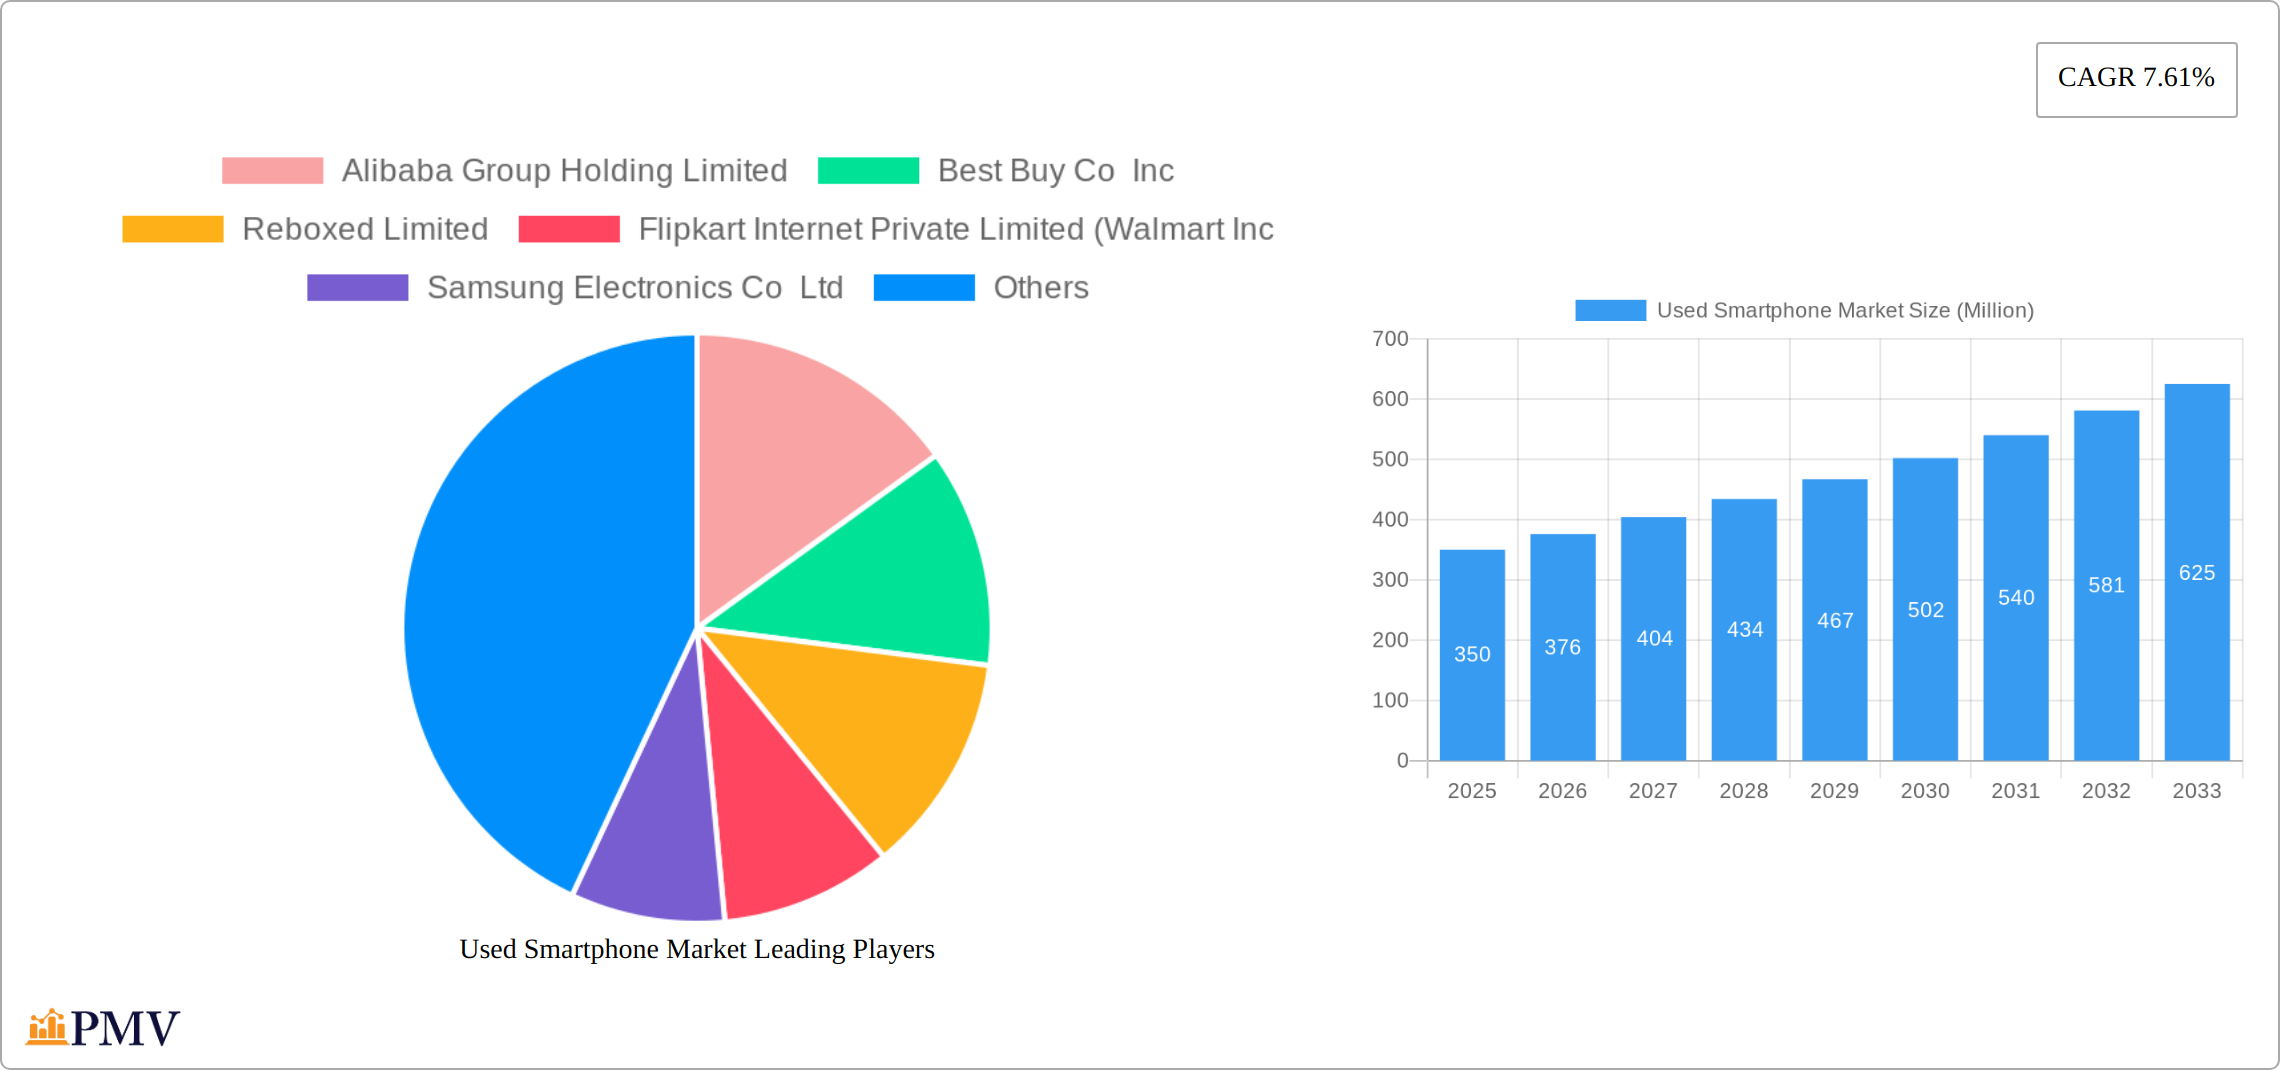
Used Smartphone Market Company Market Share
Used Smartphone Market: A Comprehensive Report (2019-2033)
This in-depth report provides a comprehensive analysis of the global used smartphone market, encompassing market size, segmentation, competitive landscape, and future growth prospects. The study period covers 2019-2033, with 2025 as the base and estimated year. This report is crucial for businesses, investors, and stakeholders seeking to understand and capitalize on opportunities within this rapidly evolving sector. The report forecasts a market value reaching xx Million by 2033.
Used Smartphone Market Market Structure & Competitive Dynamics
The used smartphone market exhibits a moderately concentrated structure, with key players like Alibaba Group Holding Limited, Best Buy Co Inc, Samsung Electronics Co Ltd, Verizon Communications Inc, Amazon com Inc, and Apple Inc holding significant market share. However, a growing number of smaller players and online marketplaces are increasing competition. The market is characterized by a dynamic innovation ecosystem, driven by advancements in refurbishment technologies and the growing demand for sustainable electronics. Regulatory frameworks, varying across regions, significantly influence market operations, particularly concerning data privacy and e-waste management. Product substitutes, such as lower-priced new smartphones from emerging brands, pose a constant challenge. End-user trends favor affordability and sustainability, driving demand for certified pre-owned devices. Recent M&A activities, like REFURBED's Series C funding round (USD 57 Million in September 2023), signify investors’ confidence in the market’s growth. The average M&A deal value in the past 5 years is estimated at xx Million. Market share distribution among top 5 players is predicted to be approximately 60% in 2025.
- High Market Concentration: Top players account for a significant percentage of the market.
- Dynamic Innovation: Continuous improvements in refurbishment technologies and sustainability initiatives.
- Varying Regulations: Data privacy and e-waste management regulations impacting operations.
- Competitive Pressure: Substitute products and rising competition from emerging brands.
- Growing M&A Activity: Significant investments signal investor confidence.
Used Smartphone Market Industry Trends & Insights
The used smartphone market is experiencing robust growth, driven by several key factors. Increasing consumer awareness of environmental sustainability is pushing preference towards refurbished devices. The affordability of used smartphones compared to new ones, particularly in developing economies, is a significant driver. Technological advancements in refurbishment processes, enhancing device quality and reliability, are building consumer trust. The rise of online marketplaces facilitates easier access to a wider range of options and increased transparency. The market is further fueled by evolving consumer preferences, with a shift towards longer device lifecycles and increased value consciousness. Competitive dynamics include price wars, brand loyalty, and the emergence of specialized refurbishment businesses. The compound annual growth rate (CAGR) for the market is projected to be xx% during the forecast period (2025-2033). Market penetration is expected to reach xx% by 2033.
Dominant Markets & Segments in Used Smartphone Market
The Asia-Pacific region, particularly India and China, leads the used smartphone market, fueled by substantial populations, escalating smartphone penetration, and a preference for budget-friendly options. Market segmentation reveals key trends:
- Condition: Refurbished smartphones comprise the largest segment, followed closely by "Used-like New" and "Used-Good." The refurbished segment thrives due to advancements in repair technology and robust certification processes. This segment benefits from increasingly sophisticated repair capabilities and rigorous quality checks, leading to higher consumer trust.
- Sales Channel: Online channels (e-commerce platforms and specialized online retailers) dominate market share, offering unparalleled convenience and broader reach. This trend is expected to continue as online shopping habits solidify.
- Price Range: The $200-$500 price bracket experiences the highest demand, striking a balance between affordability and device quality. This sweet spot caters to a large consumer base seeking value for their money.
- Operating System: Android retains its leading position due to wider device availability and competitive pricing, offering a broader selection of devices at various price points.
Key Drivers of Market Dominance:
- High Smartphone Penetration: Rapid mobile phone adoption in developing economies creates a massive pool of potential used device buyers.
- Budget-Conscious Consumers: The preference for affordable alternatives fuels demand in price-sensitive markets.
- Robust E-commerce Infrastructure: Convenient online access significantly expands market reach and accessibility.
- Supportive Government Policies: Government initiatives promoting digital economies and responsible recycling contribute to market growth and sustainability.
- Environmental Concerns: Growing awareness of e-waste and the importance of sustainable consumption practices is driving demand for refurbished devices.
Used Smartphone Market Product Innovations
Recent innovations prioritize enhancing the quality and reliability of refurbished smartphones. Improvements include more precise diagnostic tools, cutting-edge repair techniques, and stringent quality control measures ensuring superior device performance and extended lifespans. The integration of AI and machine learning in automated testing and diagnostics streamlines processes, improves accuracy, and increases efficiency. These advancements directly alleviate consumer concerns about the reliability of used devices, thereby stimulating market expansion. Many companies now offer extended warranties and comprehensive repair services to further bolster consumer confidence and reduce purchase hesitancy.
Report Segmentation & Scope
This report segments the used smartphone market based on:
- Condition: Refurbished, Used-like New, Used-Good (Growth projections vary significantly, with Refurbished exhibiting the most substantial growth potential).
- Channel: Online, Offline (Online channels demonstrate considerably faster growth rates, reflecting the shift towards digital commerce).
- Price Range: Below $200, $200-$500, Above $500 (The $200-$500 segment is poised to maintain its dominance due to its optimal balance of price and quality).
- Operating System: Android, iOS (Android is expected to retain a larger market share due to its extensive device ecosystem and affordability).
The report provides a thorough analysis of each segment's market size, growth trajectory, and competitive landscape.
Key Drivers of Used Smartphone Market Growth
The used smartphone market is propelled by several key growth drivers:
- Environmental Concerns: Growing awareness of e-waste reduction and sustainable consumption.
- Affordability: Used smartphones offer a budget-friendly alternative to new devices.
- Technological Advancements: Improved refurbishment processes and increased reliability.
- E-commerce Growth: Increased accessibility through online marketplaces.
Challenges in the Used Smartphone Market Sector
Several challenges hinder market growth:
- Data Security Concerns: Potential risks related to data privacy and device security.
- Supply Chain complexities: Efficient sourcing and managing refurbished devices.
- Counterfeit Products: Presence of non-certified and unreliable refurbished phones.
- Lack of standardization: Inconsistent quality and certification standards across different players.
These issues impact consumer trust and present regulatory challenges.
Leading Players in the Used Smartphone Market Market
- Alibaba Group Holding Limited
- Best Buy Co Inc
- Reboxed Limited
- Flipkart Internet Private Limited (Walmart Inc)
- Samsung Electronics Co Ltd
- Verizon Communications Inc
- FoneGiant
- Paytm (One97 Communications Limited)
- Amazon com Inc
- Nippon Telephone Inc
- Back Market
- AT&T Inc
- Apple Inc
Key Developments in Used Smartphone Market Sector
- September 2023: REFURBED secures USD 57 Million in Series C funding, emphasizing the investor confidence in the sustainable technology market.
- December 2023: ControlZ plans a USD 2 Million investment to expand its refurbishment capacity, signaling significant growth within the sector.
Strategic Used Smartphone Market Market Outlook
The used smartphone market holds significant future potential. Continued advancements in refurbishment technologies, a growing emphasis on sustainability, and increasing affordability will drive market expansion. Strategic opportunities exist for companies to improve their supply chains, enhance data security measures, and establish robust quality control processes. Expansion into emerging markets and focusing on niche segments, such as enterprise-grade refurbished devices, will also be key for future success.
Used Smartphone Market Segmentation
- 1. Production Analysis
- 2. Consumption Analysis
- 3. Import Market Analysis (Value & Volume)
- 4. Export Market Analysis (Value & Volume)
- 5. Price Trend Analysis
Used Smartphone Market Segmentation By Geography
- 1. North America
- 2. Europe
- 3. Asia Pacific
- 4. Rest of the World

Used Smartphone Market Regional Market Share
Geographic Coverage of Used Smartphone Market
Used Smartphone Market REPORT HIGHLIGHTS
| Aspects | Details |
|---|---|
| Study Period | 2020-2034 |
| Base Year | 2025 |
| Estimated Year | 2026 |
| Forecast Period | 2026-2034 |
| Historical Period | 2020-2025 |
| Growth Rate | CAGR of 22.6% from 2020-2034 |
| Segmentation |
|
Table of Contents
- 1. Introduction
- 1.1. Research Scope
- 1.2. Market Segmentation
- 1.3. Research Methodology
- 1.4. Definitions and Assumptions
- 2. Executive Summary
- 2.1. Introduction
- 3. Market Dynamics
- 3.1. Introduction
- 3.2. Market Drivers
- 3.2.1. Trend Toward Premium Phones (Rise in Upgrade Costs); Growing Popularity of E-commerce Platforms for Used and Refurbished Smartphones; Telecom Operators Focusing on Used Phones with Attractive Plans
- 3.3. Market Restrains
- 3.3.1. Short term supply chain challenges due to the pandemic scenario and the US-China Trade war scenario
- 3.4. Market Trends
- 3.4.1. Growing Popularity of E-commerce Platforms for Used and Refurbished Smartphones to Drive the Market
- 4. Market Factor Analysis
- 4.1. Porters Five Forces
- 4.2. Supply/Value Chain
- 4.3. PESTEL analysis
- 4.4. Market Entropy
- 4.5. Patent/Trademark Analysis
- 5. Global Used Smartphone Market Analysis, Insights and Forecast, 2020-2032
- 5.1. Market Analysis, Insights and Forecast - by Production Analysis
- 5.2. Market Analysis, Insights and Forecast - by Consumption Analysis
- 5.3. Market Analysis, Insights and Forecast - by Import Market Analysis (Value & Volume)
- 5.4. Market Analysis, Insights and Forecast - by Export Market Analysis (Value & Volume)
- 5.5. Market Analysis, Insights and Forecast - by Price Trend Analysis
- 5.6. Market Analysis, Insights and Forecast - by Region
- 5.6.1. North America
- 5.6.2. Europe
- 5.6.3. Asia Pacific
- 5.6.4. Rest of the World
- 5.1. Market Analysis, Insights and Forecast - by Production Analysis
- 6. North America Used Smartphone Market Analysis, Insights and Forecast, 2020-2032
- 6.1. Market Analysis, Insights and Forecast - by Production Analysis
- 6.2. Market Analysis, Insights and Forecast - by Consumption Analysis
- 6.3. Market Analysis, Insights and Forecast - by Import Market Analysis (Value & Volume)
- 6.4. Market Analysis, Insights and Forecast - by Export Market Analysis (Value & Volume)
- 6.5. Market Analysis, Insights and Forecast - by Price Trend Analysis
- 6.1. Market Analysis, Insights and Forecast - by Production Analysis
- 7. Europe Used Smartphone Market Analysis, Insights and Forecast, 2020-2032
- 7.1. Market Analysis, Insights and Forecast - by Production Analysis
- 7.2. Market Analysis, Insights and Forecast - by Consumption Analysis
- 7.3. Market Analysis, Insights and Forecast - by Import Market Analysis (Value & Volume)
- 7.4. Market Analysis, Insights and Forecast - by Export Market Analysis (Value & Volume)
- 7.5. Market Analysis, Insights and Forecast - by Price Trend Analysis
- 7.1. Market Analysis, Insights and Forecast - by Production Analysis
- 8. Asia Pacific Used Smartphone Market Analysis, Insights and Forecast, 2020-2032
- 8.1. Market Analysis, Insights and Forecast - by Production Analysis
- 8.2. Market Analysis, Insights and Forecast - by Consumption Analysis
- 8.3. Market Analysis, Insights and Forecast - by Import Market Analysis (Value & Volume)
- 8.4. Market Analysis, Insights and Forecast - by Export Market Analysis (Value & Volume)
- 8.5. Market Analysis, Insights and Forecast - by Price Trend Analysis
- 8.1. Market Analysis, Insights and Forecast - by Production Analysis
- 9. Rest of the World Used Smartphone Market Analysis, Insights and Forecast, 2020-2032
- 9.1. Market Analysis, Insights and Forecast - by Production Analysis
- 9.2. Market Analysis, Insights and Forecast - by Consumption Analysis
- 9.3. Market Analysis, Insights and Forecast - by Import Market Analysis (Value & Volume)
- 9.4. Market Analysis, Insights and Forecast - by Export Market Analysis (Value & Volume)
- 9.5. Market Analysis, Insights and Forecast - by Price Trend Analysis
- 9.1. Market Analysis, Insights and Forecast - by Production Analysis
- 10. Competitive Analysis
- 10.1. Global Market Share Analysis 2025
- 10.2. Company Profiles
- 10.2.1 Alibaba Group Holding Limited
- 10.2.1.1. Overview
- 10.2.1.2. Products
- 10.2.1.3. SWOT Analysis
- 10.2.1.4. Recent Developments
- 10.2.1.5. Financials (Based on Availability)
- 10.2.2 Best Buy Co Inc
- 10.2.2.1. Overview
- 10.2.2.2. Products
- 10.2.2.3. SWOT Analysis
- 10.2.2.4. Recent Developments
- 10.2.2.5. Financials (Based on Availability)
- 10.2.3 Reboxed Limited
- 10.2.3.1. Overview
- 10.2.3.2. Products
- 10.2.3.3. SWOT Analysis
- 10.2.3.4. Recent Developments
- 10.2.3.5. Financials (Based on Availability)
- 10.2.4 Flipkart Internet Private Limited (Walmart Inc
- 10.2.4.1. Overview
- 10.2.4.2. Products
- 10.2.4.3. SWOT Analysis
- 10.2.4.4. Recent Developments
- 10.2.4.5. Financials (Based on Availability)
- 10.2.5 Samsung Electronics Co Ltd
- 10.2.5.1. Overview
- 10.2.5.2. Products
- 10.2.5.3. SWOT Analysis
- 10.2.5.4. Recent Developments
- 10.2.5.5. Financials (Based on Availability)
- 10.2.6 Verizon Communications Inc
- 10.2.6.1. Overview
- 10.2.6.2. Products
- 10.2.6.3. SWOT Analysis
- 10.2.6.4. Recent Developments
- 10.2.6.5. Financials (Based on Availability)
- 10.2.7 FoneGiant
- 10.2.7.1. Overview
- 10.2.7.2. Products
- 10.2.7.3. SWOT Analysis
- 10.2.7.4. Recent Developments
- 10.2.7.5. Financials (Based on Availability)
- 10.2.8 Paytm (One97 Communications Limited)
- 10.2.8.1. Overview
- 10.2.8.2. Products
- 10.2.8.3. SWOT Analysis
- 10.2.8.4. Recent Developments
- 10.2.8.5. Financials (Based on Availability)
- 10.2.9 Amazon com Inc
- 10.2.9.1. Overview
- 10.2.9.2. Products
- 10.2.9.3. SWOT Analysis
- 10.2.9.4. Recent Developments
- 10.2.9.5. Financials (Based on Availability)
- 10.2.10 Nippon Telephone Inc
- 10.2.10.1. Overview
- 10.2.10.2. Products
- 10.2.10.3. SWOT Analysis
- 10.2.10.4. Recent Developments
- 10.2.10.5. Financials (Based on Availability)
- 10.2.11 Back Market
- 10.2.11.1. Overview
- 10.2.11.2. Products
- 10.2.11.3. SWOT Analysis
- 10.2.11.4. Recent Developments
- 10.2.11.5. Financials (Based on Availability)
- 10.2.12 AT&T Inc
- 10.2.12.1. Overview
- 10.2.12.2. Products
- 10.2.12.3. SWOT Analysis
- 10.2.12.4. Recent Developments
- 10.2.12.5. Financials (Based on Availability)
- 10.2.13 Apple Inc
- 10.2.13.1. Overview
- 10.2.13.2. Products
- 10.2.13.3. SWOT Analysis
- 10.2.13.4. Recent Developments
- 10.2.13.5. Financials (Based on Availability)
- 10.2.1 Alibaba Group Holding Limited
List of Figures
- Figure 1: Global Used Smartphone Market Revenue Breakdown (billion, %) by Region 2025 & 2033
- Figure 2: Global Used Smartphone Market Volume Breakdown (Million, %) by Region 2025 & 2033
- Figure 3: North America Used Smartphone Market Revenue (billion), by Production Analysis 2025 & 2033
- Figure 4: North America Used Smartphone Market Volume (Million), by Production Analysis 2025 & 2033
- Figure 5: North America Used Smartphone Market Revenue Share (%), by Production Analysis 2025 & 2033
- Figure 6: North America Used Smartphone Market Volume Share (%), by Production Analysis 2025 & 2033
- Figure 7: North America Used Smartphone Market Revenue (billion), by Consumption Analysis 2025 & 2033
- Figure 8: North America Used Smartphone Market Volume (Million), by Consumption Analysis 2025 & 2033
- Figure 9: North America Used Smartphone Market Revenue Share (%), by Consumption Analysis 2025 & 2033
- Figure 10: North America Used Smartphone Market Volume Share (%), by Consumption Analysis 2025 & 2033
- Figure 11: North America Used Smartphone Market Revenue (billion), by Import Market Analysis (Value & Volume) 2025 & 2033
- Figure 12: North America Used Smartphone Market Volume (Million), by Import Market Analysis (Value & Volume) 2025 & 2033
- Figure 13: North America Used Smartphone Market Revenue Share (%), by Import Market Analysis (Value & Volume) 2025 & 2033
- Figure 14: North America Used Smartphone Market Volume Share (%), by Import Market Analysis (Value & Volume) 2025 & 2033
- Figure 15: North America Used Smartphone Market Revenue (billion), by Export Market Analysis (Value & Volume) 2025 & 2033
- Figure 16: North America Used Smartphone Market Volume (Million), by Export Market Analysis (Value & Volume) 2025 & 2033
- Figure 17: North America Used Smartphone Market Revenue Share (%), by Export Market Analysis (Value & Volume) 2025 & 2033
- Figure 18: North America Used Smartphone Market Volume Share (%), by Export Market Analysis (Value & Volume) 2025 & 2033
- Figure 19: North America Used Smartphone Market Revenue (billion), by Price Trend Analysis 2025 & 2033
- Figure 20: North America Used Smartphone Market Volume (Million), by Price Trend Analysis 2025 & 2033
- Figure 21: North America Used Smartphone Market Revenue Share (%), by Price Trend Analysis 2025 & 2033
- Figure 22: North America Used Smartphone Market Volume Share (%), by Price Trend Analysis 2025 & 2033
- Figure 23: North America Used Smartphone Market Revenue (billion), by Country 2025 & 2033
- Figure 24: North America Used Smartphone Market Volume (Million), by Country 2025 & 2033
- Figure 25: North America Used Smartphone Market Revenue Share (%), by Country 2025 & 2033
- Figure 26: North America Used Smartphone Market Volume Share (%), by Country 2025 & 2033
- Figure 27: Europe Used Smartphone Market Revenue (billion), by Production Analysis 2025 & 2033
- Figure 28: Europe Used Smartphone Market Volume (Million), by Production Analysis 2025 & 2033
- Figure 29: Europe Used Smartphone Market Revenue Share (%), by Production Analysis 2025 & 2033
- Figure 30: Europe Used Smartphone Market Volume Share (%), by Production Analysis 2025 & 2033
- Figure 31: Europe Used Smartphone Market Revenue (billion), by Consumption Analysis 2025 & 2033
- Figure 32: Europe Used Smartphone Market Volume (Million), by Consumption Analysis 2025 & 2033
- Figure 33: Europe Used Smartphone Market Revenue Share (%), by Consumption Analysis 2025 & 2033
- Figure 34: Europe Used Smartphone Market Volume Share (%), by Consumption Analysis 2025 & 2033
- Figure 35: Europe Used Smartphone Market Revenue (billion), by Import Market Analysis (Value & Volume) 2025 & 2033
- Figure 36: Europe Used Smartphone Market Volume (Million), by Import Market Analysis (Value & Volume) 2025 & 2033
- Figure 37: Europe Used Smartphone Market Revenue Share (%), by Import Market Analysis (Value & Volume) 2025 & 2033
- Figure 38: Europe Used Smartphone Market Volume Share (%), by Import Market Analysis (Value & Volume) 2025 & 2033
- Figure 39: Europe Used Smartphone Market Revenue (billion), by Export Market Analysis (Value & Volume) 2025 & 2033
- Figure 40: Europe Used Smartphone Market Volume (Million), by Export Market Analysis (Value & Volume) 2025 & 2033
- Figure 41: Europe Used Smartphone Market Revenue Share (%), by Export Market Analysis (Value & Volume) 2025 & 2033
- Figure 42: Europe Used Smartphone Market Volume Share (%), by Export Market Analysis (Value & Volume) 2025 & 2033
- Figure 43: Europe Used Smartphone Market Revenue (billion), by Price Trend Analysis 2025 & 2033
- Figure 44: Europe Used Smartphone Market Volume (Million), by Price Trend Analysis 2025 & 2033
- Figure 45: Europe Used Smartphone Market Revenue Share (%), by Price Trend Analysis 2025 & 2033
- Figure 46: Europe Used Smartphone Market Volume Share (%), by Price Trend Analysis 2025 & 2033
- Figure 47: Europe Used Smartphone Market Revenue (billion), by Country 2025 & 2033
- Figure 48: Europe Used Smartphone Market Volume (Million), by Country 2025 & 2033
- Figure 49: Europe Used Smartphone Market Revenue Share (%), by Country 2025 & 2033
- Figure 50: Europe Used Smartphone Market Volume Share (%), by Country 2025 & 2033
- Figure 51: Asia Pacific Used Smartphone Market Revenue (billion), by Production Analysis 2025 & 2033
- Figure 52: Asia Pacific Used Smartphone Market Volume (Million), by Production Analysis 2025 & 2033
- Figure 53: Asia Pacific Used Smartphone Market Revenue Share (%), by Production Analysis 2025 & 2033
- Figure 54: Asia Pacific Used Smartphone Market Volume Share (%), by Production Analysis 2025 & 2033
- Figure 55: Asia Pacific Used Smartphone Market Revenue (billion), by Consumption Analysis 2025 & 2033
- Figure 56: Asia Pacific Used Smartphone Market Volume (Million), by Consumption Analysis 2025 & 2033
- Figure 57: Asia Pacific Used Smartphone Market Revenue Share (%), by Consumption Analysis 2025 & 2033
- Figure 58: Asia Pacific Used Smartphone Market Volume Share (%), by Consumption Analysis 2025 & 2033
- Figure 59: Asia Pacific Used Smartphone Market Revenue (billion), by Import Market Analysis (Value & Volume) 2025 & 2033
- Figure 60: Asia Pacific Used Smartphone Market Volume (Million), by Import Market Analysis (Value & Volume) 2025 & 2033
- Figure 61: Asia Pacific Used Smartphone Market Revenue Share (%), by Import Market Analysis (Value & Volume) 2025 & 2033
- Figure 62: Asia Pacific Used Smartphone Market Volume Share (%), by Import Market Analysis (Value & Volume) 2025 & 2033
- Figure 63: Asia Pacific Used Smartphone Market Revenue (billion), by Export Market Analysis (Value & Volume) 2025 & 2033
- Figure 64: Asia Pacific Used Smartphone Market Volume (Million), by Export Market Analysis (Value & Volume) 2025 & 2033
- Figure 65: Asia Pacific Used Smartphone Market Revenue Share (%), by Export Market Analysis (Value & Volume) 2025 & 2033
- Figure 66: Asia Pacific Used Smartphone Market Volume Share (%), by Export Market Analysis (Value & Volume) 2025 & 2033
- Figure 67: Asia Pacific Used Smartphone Market Revenue (billion), by Price Trend Analysis 2025 & 2033
- Figure 68: Asia Pacific Used Smartphone Market Volume (Million), by Price Trend Analysis 2025 & 2033
- Figure 69: Asia Pacific Used Smartphone Market Revenue Share (%), by Price Trend Analysis 2025 & 2033
- Figure 70: Asia Pacific Used Smartphone Market Volume Share (%), by Price Trend Analysis 2025 & 2033
- Figure 71: Asia Pacific Used Smartphone Market Revenue (billion), by Country 2025 & 2033
- Figure 72: Asia Pacific Used Smartphone Market Volume (Million), by Country 2025 & 2033
- Figure 73: Asia Pacific Used Smartphone Market Revenue Share (%), by Country 2025 & 2033
- Figure 74: Asia Pacific Used Smartphone Market Volume Share (%), by Country 2025 & 2033
- Figure 75: Rest of the World Used Smartphone Market Revenue (billion), by Production Analysis 2025 & 2033
- Figure 76: Rest of the World Used Smartphone Market Volume (Million), by Production Analysis 2025 & 2033
- Figure 77: Rest of the World Used Smartphone Market Revenue Share (%), by Production Analysis 2025 & 2033
- Figure 78: Rest of the World Used Smartphone Market Volume Share (%), by Production Analysis 2025 & 2033
- Figure 79: Rest of the World Used Smartphone Market Revenue (billion), by Consumption Analysis 2025 & 2033
- Figure 80: Rest of the World Used Smartphone Market Volume (Million), by Consumption Analysis 2025 & 2033
- Figure 81: Rest of the World Used Smartphone Market Revenue Share (%), by Consumption Analysis 2025 & 2033
- Figure 82: Rest of the World Used Smartphone Market Volume Share (%), by Consumption Analysis 2025 & 2033
- Figure 83: Rest of the World Used Smartphone Market Revenue (billion), by Import Market Analysis (Value & Volume) 2025 & 2033
- Figure 84: Rest of the World Used Smartphone Market Volume (Million), by Import Market Analysis (Value & Volume) 2025 & 2033
- Figure 85: Rest of the World Used Smartphone Market Revenue Share (%), by Import Market Analysis (Value & Volume) 2025 & 2033
- Figure 86: Rest of the World Used Smartphone Market Volume Share (%), by Import Market Analysis (Value & Volume) 2025 & 2033
- Figure 87: Rest of the World Used Smartphone Market Revenue (billion), by Export Market Analysis (Value & Volume) 2025 & 2033
- Figure 88: Rest of the World Used Smartphone Market Volume (Million), by Export Market Analysis (Value & Volume) 2025 & 2033
- Figure 89: Rest of the World Used Smartphone Market Revenue Share (%), by Export Market Analysis (Value & Volume) 2025 & 2033
- Figure 90: Rest of the World Used Smartphone Market Volume Share (%), by Export Market Analysis (Value & Volume) 2025 & 2033
- Figure 91: Rest of the World Used Smartphone Market Revenue (billion), by Price Trend Analysis 2025 & 2033
- Figure 92: Rest of the World Used Smartphone Market Volume (Million), by Price Trend Analysis 2025 & 2033
- Figure 93: Rest of the World Used Smartphone Market Revenue Share (%), by Price Trend Analysis 2025 & 2033
- Figure 94: Rest of the World Used Smartphone Market Volume Share (%), by Price Trend Analysis 2025 & 2033
- Figure 95: Rest of the World Used Smartphone Market Revenue (billion), by Country 2025 & 2033
- Figure 96: Rest of the World Used Smartphone Market Volume (Million), by Country 2025 & 2033
- Figure 97: Rest of the World Used Smartphone Market Revenue Share (%), by Country 2025 & 2033
- Figure 98: Rest of the World Used Smartphone Market Volume Share (%), by Country 2025 & 2033
List of Tables
- Table 1: Global Used Smartphone Market Revenue billion Forecast, by Production Analysis 2020 & 2033
- Table 2: Global Used Smartphone Market Volume Million Forecast, by Production Analysis 2020 & 2033
- Table 3: Global Used Smartphone Market Revenue billion Forecast, by Consumption Analysis 2020 & 2033
- Table 4: Global Used Smartphone Market Volume Million Forecast, by Consumption Analysis 2020 & 2033
- Table 5: Global Used Smartphone Market Revenue billion Forecast, by Import Market Analysis (Value & Volume) 2020 & 2033
- Table 6: Global Used Smartphone Market Volume Million Forecast, by Import Market Analysis (Value & Volume) 2020 & 2033
- Table 7: Global Used Smartphone Market Revenue billion Forecast, by Export Market Analysis (Value & Volume) 2020 & 2033
- Table 8: Global Used Smartphone Market Volume Million Forecast, by Export Market Analysis (Value & Volume) 2020 & 2033
- Table 9: Global Used Smartphone Market Revenue billion Forecast, by Price Trend Analysis 2020 & 2033
- Table 10: Global Used Smartphone Market Volume Million Forecast, by Price Trend Analysis 2020 & 2033
- Table 11: Global Used Smartphone Market Revenue billion Forecast, by Region 2020 & 2033
- Table 12: Global Used Smartphone Market Volume Million Forecast, by Region 2020 & 2033
- Table 13: Global Used Smartphone Market Revenue billion Forecast, by Production Analysis 2020 & 2033
- Table 14: Global Used Smartphone Market Volume Million Forecast, by Production Analysis 2020 & 2033
- Table 15: Global Used Smartphone Market Revenue billion Forecast, by Consumption Analysis 2020 & 2033
- Table 16: Global Used Smartphone Market Volume Million Forecast, by Consumption Analysis 2020 & 2033
- Table 17: Global Used Smartphone Market Revenue billion Forecast, by Import Market Analysis (Value & Volume) 2020 & 2033
- Table 18: Global Used Smartphone Market Volume Million Forecast, by Import Market Analysis (Value & Volume) 2020 & 2033
- Table 19: Global Used Smartphone Market Revenue billion Forecast, by Export Market Analysis (Value & Volume) 2020 & 2033
- Table 20: Global Used Smartphone Market Volume Million Forecast, by Export Market Analysis (Value & Volume) 2020 & 2033
- Table 21: Global Used Smartphone Market Revenue billion Forecast, by Price Trend Analysis 2020 & 2033
- Table 22: Global Used Smartphone Market Volume Million Forecast, by Price Trend Analysis 2020 & 2033
- Table 23: Global Used Smartphone Market Revenue billion Forecast, by Country 2020 & 2033
- Table 24: Global Used Smartphone Market Volume Million Forecast, by Country 2020 & 2033
- Table 25: Global Used Smartphone Market Revenue billion Forecast, by Production Analysis 2020 & 2033
- Table 26: Global Used Smartphone Market Volume Million Forecast, by Production Analysis 2020 & 2033
- Table 27: Global Used Smartphone Market Revenue billion Forecast, by Consumption Analysis 2020 & 2033
- Table 28: Global Used Smartphone Market Volume Million Forecast, by Consumption Analysis 2020 & 2033
- Table 29: Global Used Smartphone Market Revenue billion Forecast, by Import Market Analysis (Value & Volume) 2020 & 2033
- Table 30: Global Used Smartphone Market Volume Million Forecast, by Import Market Analysis (Value & Volume) 2020 & 2033
- Table 31: Global Used Smartphone Market Revenue billion Forecast, by Export Market Analysis (Value & Volume) 2020 & 2033
- Table 32: Global Used Smartphone Market Volume Million Forecast, by Export Market Analysis (Value & Volume) 2020 & 2033
- Table 33: Global Used Smartphone Market Revenue billion Forecast, by Price Trend Analysis 2020 & 2033
- Table 34: Global Used Smartphone Market Volume Million Forecast, by Price Trend Analysis 2020 & 2033
- Table 35: Global Used Smartphone Market Revenue billion Forecast, by Country 2020 & 2033
- Table 36: Global Used Smartphone Market Volume Million Forecast, by Country 2020 & 2033
- Table 37: Global Used Smartphone Market Revenue billion Forecast, by Production Analysis 2020 & 2033
- Table 38: Global Used Smartphone Market Volume Million Forecast, by Production Analysis 2020 & 2033
- Table 39: Global Used Smartphone Market Revenue billion Forecast, by Consumption Analysis 2020 & 2033
- Table 40: Global Used Smartphone Market Volume Million Forecast, by Consumption Analysis 2020 & 2033
- Table 41: Global Used Smartphone Market Revenue billion Forecast, by Import Market Analysis (Value & Volume) 2020 & 2033
- Table 42: Global Used Smartphone Market Volume Million Forecast, by Import Market Analysis (Value & Volume) 2020 & 2033
- Table 43: Global Used Smartphone Market Revenue billion Forecast, by Export Market Analysis (Value & Volume) 2020 & 2033
- Table 44: Global Used Smartphone Market Volume Million Forecast, by Export Market Analysis (Value & Volume) 2020 & 2033
- Table 45: Global Used Smartphone Market Revenue billion Forecast, by Price Trend Analysis 2020 & 2033
- Table 46: Global Used Smartphone Market Volume Million Forecast, by Price Trend Analysis 2020 & 2033
- Table 47: Global Used Smartphone Market Revenue billion Forecast, by Country 2020 & 2033
- Table 48: Global Used Smartphone Market Volume Million Forecast, by Country 2020 & 2033
- Table 49: Global Used Smartphone Market Revenue billion Forecast, by Production Analysis 2020 & 2033
- Table 50: Global Used Smartphone Market Volume Million Forecast, by Production Analysis 2020 & 2033
- Table 51: Global Used Smartphone Market Revenue billion Forecast, by Consumption Analysis 2020 & 2033
- Table 52: Global Used Smartphone Market Volume Million Forecast, by Consumption Analysis 2020 & 2033
- Table 53: Global Used Smartphone Market Revenue billion Forecast, by Import Market Analysis (Value & Volume) 2020 & 2033
- Table 54: Global Used Smartphone Market Volume Million Forecast, by Import Market Analysis (Value & Volume) 2020 & 2033
- Table 55: Global Used Smartphone Market Revenue billion Forecast, by Export Market Analysis (Value & Volume) 2020 & 2033
- Table 56: Global Used Smartphone Market Volume Million Forecast, by Export Market Analysis (Value & Volume) 2020 & 2033
- Table 57: Global Used Smartphone Market Revenue billion Forecast, by Price Trend Analysis 2020 & 2033
- Table 58: Global Used Smartphone Market Volume Million Forecast, by Price Trend Analysis 2020 & 2033
- Table 59: Global Used Smartphone Market Revenue billion Forecast, by Country 2020 & 2033
- Table 60: Global Used Smartphone Market Volume Million Forecast, by Country 2020 & 2033
Frequently Asked Questions
1. What is the projected Compound Annual Growth Rate (CAGR) of the Used Smartphone Market?
The projected CAGR is approximately 22.6%.
2. Which companies are prominent players in the Used Smartphone Market?
Key companies in the market include Alibaba Group Holding Limited, Best Buy Co Inc, Reboxed Limited, Flipkart Internet Private Limited (Walmart Inc, Samsung Electronics Co Ltd, Verizon Communications Inc, FoneGiant, Paytm (One97 Communications Limited), Amazon com Inc, Nippon Telephone Inc, Back Market, AT&T Inc, Apple Inc.
3. What are the main segments of the Used Smartphone Market?
The market segments include Production Analysis, Consumption Analysis, Import Market Analysis (Value & Volume), Export Market Analysis (Value & Volume), Price Trend Analysis.
4. Can you provide details about the market size?
The market size is estimated to be USD 42.33 billion as of 2022.
5. What are some drivers contributing to market growth?
Trend Toward Premium Phones (Rise in Upgrade Costs); Growing Popularity of E-commerce Platforms for Used and Refurbished Smartphones; Telecom Operators Focusing on Used Phones with Attractive Plans.
6. What are the notable trends driving market growth?
Growing Popularity of E-commerce Platforms for Used and Refurbished Smartphones to Drive the Market.
7. Are there any restraints impacting market growth?
Short term supply chain challenges due to the pandemic scenario and the US-China Trade war scenario.
8. Can you provide examples of recent developments in the market?
December 2023 - Smartphone refurbishing startup ControlZ aims to invest nearly USD 2 million in its Gurugram repair facility again in 2024. The company aims to repair 1 lakh units at the facility in 2024 and scale it to 5 lakh units by 2025.
9. What pricing options are available for accessing the report?
Pricing options include single-user, multi-user, and enterprise licenses priced at USD 4750, USD 5250, and USD 8750 respectively.
10. Is the market size provided in terms of value or volume?
The market size is provided in terms of value, measured in billion and volume, measured in Million.
11. Are there any specific market keywords associated with the report?
Yes, the market keyword associated with the report is "Used Smartphone Market," which aids in identifying and referencing the specific market segment covered.
12. How do I determine which pricing option suits my needs best?
The pricing options vary based on user requirements and access needs. Individual users may opt for single-user licenses, while businesses requiring broader access may choose multi-user or enterprise licenses for cost-effective access to the report.
13. Are there any additional resources or data provided in the Used Smartphone Market report?
While the report offers comprehensive insights, it's advisable to review the specific contents or supplementary materials provided to ascertain if additional resources or data are available.
14. How can I stay updated on further developments or reports in the Used Smartphone Market?
To stay informed about further developments, trends, and reports in the Used Smartphone Market, consider subscribing to industry newsletters, following relevant companies and organizations, or regularly checking reputable industry news sources and publications.
Methodology
Step 1 - Identification of Relevant Samples Size from Population Database


Step 2 - Approaches for Defining Global Market Size (Value, Volume* & Price*)

Note*: In applicable scenarios
Step 3 - Data Sources
Primary Research
- Web Analytics
- Survey Reports
- Research Institute
- Latest Research Reports
- Opinion Leaders
Secondary Research
- Annual Reports
- White Paper
- Latest Press Release
- Industry Association
- Paid Database
- Investor Presentations

Step 4 - Data Triangulation
Involves using different sources of information in order to increase the validity of a study
These sources are likely to be stakeholders in a program - participants, other researchers, program staff, other community members, and so on.
Then we put all data in single framework & apply various statistical tools to find out the dynamic on the market.
During the analysis stage, feedback from the stakeholder groups would be compared to determine areas of agreement as well as areas of divergence